
 ?Mathematical formulae have been encoded as MathML and are displayed in this HTML version using MathJax in order to improve their display. Uncheck the box to turn MathJax off. This feature requires Javascript. Click on a formula to zoom.
ABSTRACT
This paper presents results from the Sydney inhomogeneous burner for two gaseous hydrocarbons: methane (CH4) and propane (C3H8). These different hydrocarbons enable the exploration of fuels with significantly different stoichiometric air-fuel ratios (A/F) and hence mixing requirements in the burner. Stability limits of blow-off velocities vs. fuel jet recession, identify that both fuels exhibit improvement due to inhomogeneity, albeit occurring at different equivalence ratios. For CH4, the largest improvement due to inhomogeneity, compared to the homogeneous limit, was close to φ = 4.76, which corresponds to VA/VF = 2. For C3H8, the peak stability occurred at φ = 12, which interestingly also corresponds to VA/VF = 2. Rayleigh imaging at 10 Hz, performed at the burner exit plane, was used to identify the mixing profiles of the two fuels for different equivalence ratios. It was verified that the optimal recess distance coincides with the most stoichiometric samples contacting the pilot, with the samples augmenting the pilot heat release. The addition of N2 further reduced the inhomogeneous improvement, verifying that mixing and the mixture near the pilot controls the inhomogeneous stability.
Introduction
Practical combustors, such as compression ignition (CI) engines and gas turbines typically exhibit significant fuel/air mixture stratification with large compositional gradients. For CI engines, the fuel mixture ratio at injection is used to control emissions, timing and efficiency (DEC Citation2009). In gas turbines, compositional inhomogeneity may be induced by combustor instability leading to multi-modes of burning, which also prevail in multi-staged systems and in regions of flow recirculation (GICQUEL, STAFFELBACH, and POINSOT Citation2012). In these applications, the fuel enters the combustor and the fuel kernel ignites close to stoichiometry while the rest of the chamber is at varying states of mixedness. The ignition kernel encounters varying degrees of diffusion to premixed burning modes with significant inhomogeneity in between; the rate of flame propagation is dictated by the initial mixture and the mixture the flame propagates into (WEI et al. Citation2018).
To replicate levels of compositional inhomogeneity in practical combustors, the Sydney inhomogeneous burner is utilized in this work; the burner provides an excellent method to explore laboratory flames in a repeatable/controlled manner. The burner consists of three concentric tubes: the pilot, annulus and central jet. The central jet is recessed to enable a range of premixing conditions with varying mixing due to shear layer interaction (MEARES et al. Citation2015). An excellent review on the stabilizing mechanisms of stratified flames for a range of burners is given by Masri (MASRI Citation2015).
The relative flame stability with varying degrees of diffusive to premixed burning in the inhomogeneous burner has been explored extensively both numerically (GALINDO et al. Citation2017) and experimentally (BARLOW et al. Citation2015; CUTCHER et al. Citation2017; MEARES et al. Citation2015). When the fuel jet is flush with the annulus outlet (a jet recession of zero) the flame is deemed to be a diffusion flame. With increased recession, the flame becomes more stratified until recession is increased to the condition where premixed burning occurs. It is identified that fuel reactivity rather than pilot interaction and mixing controls stability (GUIBERTI et al. Citation2017). Furthermore, for the fuel in the central jet and air in annulus configuration (FJ), the configuration used in this paper, peak stability was attributed to a large degree of inhomogeneity (MEARES et al. Citation2015). It has been shown that the fuel ignites near stoichiometry at the pilot, with a quick transition from stratified-premixed burning to diffusion-dominated burning within 10 diameters (BARLOW et al. Citation2015).
Previous work on the Sydney Inhomogeneous burner has focused on CH4, for φ = 4.76 (BARLOW et al. Citation2015; MEARES et al. Citation2015), with a small exploration being done on equivalence ratios and hence A/F (MEARES and MASRI Citation2014). Furthermore, a small campaign was extended to different fuels, namely dimethyl ether and propane (GUIBERTI et al. Citation2017). For these fuels, only minor improvements due to compositional inhomogeneity were noted at these equivalence ratios, identifying reactivities controlled the improvement due to stability. However, the equivalence ratio was fixed at φ = 2.9, so it didn’t explore the dependency of the differences in stoichiometric air to fuel ratios between fuels. The sensitivity of the inhomogeneous improvement due to equivalence ratio for two fuels, CH4 and C3H8, is therefore the focus of this paper. The paper utilizes stability plots to verify the inhomogeneous improvement and uses 10 Hz Rayleigh imaging (MANSOUR et al. Citation2017; STEPOWSKI and CABOT Citation1992) to understand the mixing and mixture fraction gradients at the nozzle exit leading to this improvement.
Burner
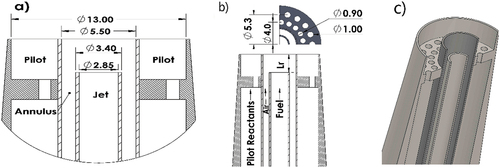
The Sydney inhomogeneous burner consists of three concentric tubes: the outer pilot (ØID = 13 mm), the middle annulus (ØA, ID = 5.5 mm) and the central jet (ØJ, ID = 2.85 mm), the dimensions are given in . The burner is 25% smaller than those in previous studies (BARLOW et al. Citation2015; MEARES and MASRI Citation2014) to reduce the pilot power and hence flow rates required. The ~ 50% larger annulus diameter, than the central jet, entails that the area is twice as large, which influences the velocity ratio between annulus and jet (UJ/UA) for the range of A/F, explored in the discussion. The burner, throughout this paper, was operated in the FJ configuration, with fuel in the central jet and air in the annulus. The equivalence ratio, referred to throughout the paper, is the ratio between the fuel in the jet and air in the annulus.
Figure 1. Inhomogeneous burner dimensions a), flow configuration b) and 3-D view c).
Experimental setup
Rayleigh scattering at the exit plane of the burner was generated by a 532 nm, 1.4 J/Pulse, 10 Hz, laser (Spectra Physics Pro 350). To image the entire burner exit plane, the horizontally polarized 532 nm (Ø = 12 mm) beam was made into a horizontal sheet with a 12 mm width and 300 µm thickness using a f = 300 mm plano-convex lens. The Rayleigh scattering from the burner was collected using a four-inch silver coated mirror that directed the scattered light into a CCD camera (LaVision image intense). The mirror was placed 250 mm from the burner exit with a Canon collection lens (f = 200 mm, Ø = 72 mm) 150 mm from the mirror giving the system a f# = 5 and the required image magnification. A LaVision PTUx timing box was used to trigger both the laser flash lamps and Q switch, with a third pulse triggering the camera. A 532 nm, 10 nm FWHM band pass filter was used to remove interferences from flame chemiluminescence and ambient light. The correction for the background reflections from the burner, which are challenging to eliminate in the present configuration, were generated from scattering images of pure helium and air.
The experiment was conducted using a reacting jet and high-temperature pilot so as to match the true pilot gas velocity, viscosity and density rather than using a cold pilot where not all of these parameters could be matched. The measurements were taken 4 mm (x/D = 0.7) from the jet exit plane, such that the bulk of the fuel jet mixture was not heated and in an unreacted state. Any reactions or preheating of the jet fluid was limited to the thin interface between the pilot and the jet fluid. To verify the minimal impact of a burnt pilot on the Rayleigh cross sections of the fuel jet, measurements were compared between a non-reacting and reacting pilot. It was observed that the mean Rayleigh signals only differed slightly for r/D > 0.7 between the reacting and non-reacting pilot cases due to intermittent pilot hot gas entrainment in that region.
The mixture fraction (f) is bound between the pure fuel signal (IFuel) and air signal (Iair) at room temperature (T = 293 K) given in EquationEquation (1)(1)
(1) . The conversion of the mixture Rayleigh signal (Isignal) to mixture fraction is given by:
The fuel molecular weight (MWfuel) and corresponding mixture molecular weight (MWmix) change based on the fuel composition and mixture with N2 addition. The burnt pilot products have cross sections much lower than pure air at 293 K, and are not included in the mixture fraction definition. As such mixture fraction values less than zero are observed in this paper and should be interpreted as either hot pilot gases or regions where the preheating and reaction of the jet mixture is not negligible. It is noted that the region where burnt products are observed are outside the region of interest, since the focus of this paper is on the unburnt fuel and air mixing between the air in the annulus and fuel jet.
Results
The results presented in this section include the stability plots which are characteristic for each fuel and fuel composition. The Rayleigh images are then presented for specific recess distances corresponding to a chosen blow-off velocity. Single shot mean and RMS fluctuations of the Rayleigh images are given to indicate the type of mixing and structure the fuel exhibits at the nozzle outlet, for different recess positions. Finally, the Rayleigh images are analyzed using mean and RMS line plots together with radial PDFs to understand the type of mixing each fuel undergoes for a given recess distance and equivalence ratio.
Stability plots
Stability plots are used to characterize the Sydney Inhomogeneous burner, they identify the jet velocity required for a given pilot power to detach and blow-off the flame. The stability plots for pure CH4 and pure C3H8 are seen in , for a range of equivalence ratios (φ). For CH4, φ = 6 and 4.76, there is a distinct peak in blow-off velocity (UP) around Lr = 25 mm; this is termed the optimal recess distance. This velocity is significantly higher than the diffusion flame recess distance (Lr = 0) and the homogeneous limit (Lr = 300, UH). The improvement at the optimal recess distance is the ratio between the homogeneous velocity (UH) and the peak velocity (UP), i.e., UImprv=UP/UH; as such UImprv = 42% for φ = 4.76. As the equivalence ratio increases the diffusion flame (Lr = 0) blow-off velocity increases (for the φ cases presented), whilst the peak stability (UP) and homogeneous limit decrease. For the later discussion, the relative ratio between the air in the annulus and fuel in the jet (VA/VF) is shown to be influential to the blow-off velocity so given in .
Figure 2. Stability plots for CH4 and C3H8 for a range of equivalence ratios (φ) with the air to fuel ratio (VA/VF) given.
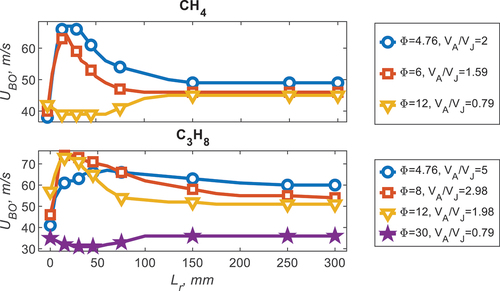
For C3H8, the same phenomenon is observed as CH4, albeit for a different equivalence ratio range. The peak in stability occurs at φ = 8 and 12 (UImprv = 44%) for C3H8 which is much richer than CH4. This difference in optimal recess distance, with equivalence ratio, is the investigation of this paper. The ratio between the flow rate of the air in the annulus and the fuel in the jet (VA/VF) for peak stability occurs around two for both fuels, implying that the relevant mixing parameter is the velocity ratio between the fuel and air. Furthermore, for a relatively rich case, specific to each fuel, no optimal peak is observed, this occurs at φ = 12 and φ = 30 for CH4 and C3H8 respectively. It is noted that the differences between the homogeneous velocity, for each fuel, is consistent with the difference in the laminar flame speed, or reactivity, of each fuel.
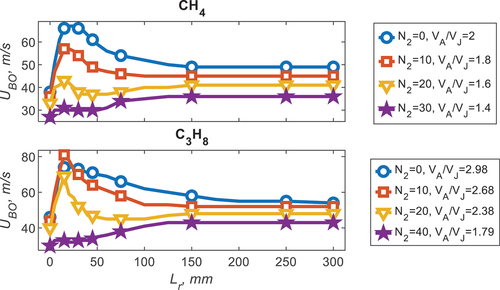
To emphasize the importance of mixing and the reactivity of the fuels, blends of N2 were conducted for C3H8 and CH4, seen in for CH4, with the addition of 10% N2 there is a decrease in all characteristic velocities, however, with the addition of 30% N2 the homogeneous limit is reduced whilst the inhomogeneous improvement is suppressed entirely. A slightly different observation is made for C3H8, whereby, for a small addition of N2 (10%) the peak stability slightly increases. With increased N2, like CH4, all blow-off velocities decrease and the improvement due to homogeneity is completely suppressed with 40% N2. The relative differences between the improvement due equivalence ratio and N2 addition with recess distance is explored in the following section using Rayleigh imaging.
Figure 3. Stability plots of CH4 (φ = 4.76) and C3H8 (φ = 8) for a range of N2 dilutions with the air to fuel ratio (VA/VF) given.
Instantaneous Rayleigh images
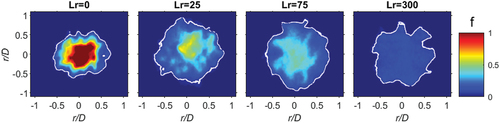
Single shot images for CH4, φ = 4.76, is seen in for a range of recess distances. The white contour identifies the stoichiometric contour (fst). For the diffusive burning case, Lr = 0 mm, pure fuel remains somewhat constant on the centreline. For the small recess distance of Lr = 25 no pure fuel exists, and the peak mixture fraction has dropped to f 0.6. With further jet recess, the mixture fraction at the center decreases and the mixture becomes more homogeneous until at Lr = 300 mm the mixture is homogeneous at f = 0.22 (φ = 4.76).
Figure 4. Instantaneous single shot Rayleigh images for CH4, φ = 4.76, for four recess positions: Lr = 0, 25, 75 and 300 mm.
Mean Rayleigh images
For each fuel and recess position, 1000 images were taken to resolve lower and higher order statistics. The mean from the Rayleigh images of CH4 (φ = 4.76), including those from , is seen in . The stoichiometric mixture fraction is given by the white contour, indicating the stoichiometric mixture fraction (fst). Like the single shot images, in , at Lr = 0 pure fuel (f = 1) occurs along the centreline, with increased recession the mixture becomes more premixed until it is completely homogeneous at Lr = 300 mm.
Figure 5. Mean Rayleigh images for CH4 (φ = 4.76) at four recess positions: Lr = 0, 25, 75 and 300. The color bar indicates the mixture fraction intensity.
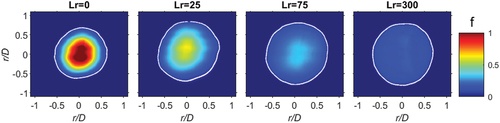
The focus for this paper is the interface between the edge of the annulus/fuel jet and the pilot with the purpose of extracting the mixture strength and its corresponding flammability. The edge of the annulus is at 0.5 r/D, as such, it can be seen in that the fuel mixture (f > 0) extends beyond r/D = 0.5 since measurements are taken at x/D = 0.7 above the exit nozzle and some jet dispersion has occurred at this position. It has therefore been determined that the pilot interference, with the addition of dispersion, is at r/D = 0.65–0.7. It is evident from that the fst contour for Lr = 0 mm and Lr = 300 mm is “inside” and “outside” r/D = 0.6, respectively. For the optimal stability recess position (Lr = 25), seen in the stoichiometric contour (fst) occurs at the pilot interface ~ r/D = 0.6. This mixture fraction (f) interface, at the pilot, is analyzed in detail in the following sections.
RMS of Rayleigh images
The RMS of the Rayleigh images are given in to showcase the fluctuation of the mixture fraction with jet recession. At Lr = 0 there is no mixing between the fuel and air inside the burner, as such, the mixture is pure on the centreline and the RMS is nearly zero. The fluctuation in mixture fraction is at the interface with the annulus (0.3 r/D), where the fuel and air begin to mix at the exit plane of the burner. At Lr = 25 there is now stochastic mixing of air in the burner along the centreline and the RMS increases. The upward shift of the RMS at Lr = 25 is attributed to the small asymmetry, of the burner, due to the long jet in the annulus.
Figure 6. RMS Rayleigh images for CH4 (φ = 4.76) at four recess positions: Lr = 0, 25, 75 and 300.
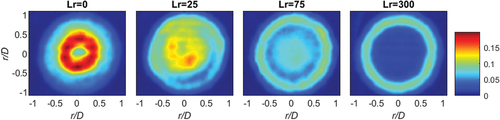
As the jet is further recessed, premixing in the burner occurs, the RMS along the centreline becomes more uniform. The dominant RMS mode is now due to the interface between the annulus and the pilot (r/D > 0.7). As the jet is completely recessed (Lr = 300 mm) the mixture becomes completely premixed before the exit of the nozzle, the RMS becomes almost zero across the burner exit plane (0 < r/D < 0.7). For the completely recessed case the fluctuation in the RMS is due to the pilot interaction with the premixed fuel and air from the jet and annulus, respectively.
Mean and RMS line plots
The mean and RMS plots of mixture fraction with radial position, for CH4 (φ = 4.76), are given in . The plots highlight, as was seen pictorially in , that for Lr = 0 pure fuel occurs along the centreline (given by the mean). The RMS at Lr = 0 is minimal, on the centerline, since no mixing occurs in the burner. The stoichiometric mixture fraction (fst) is given by the dashed line, and it verifies that flammable mixtures are only realized near the pilot (r/D > 0.6). It is noted that in these plots a mixture fraction less than one is observed, and this is due to the hot pilot cross sections being much smaller than pure air at room temperature.
Figure 7. Mean and RMS plots of mixture fraction for CH4 (φ = 4.76) at four recess positions: Lr = 0, 25, 75 and 300.
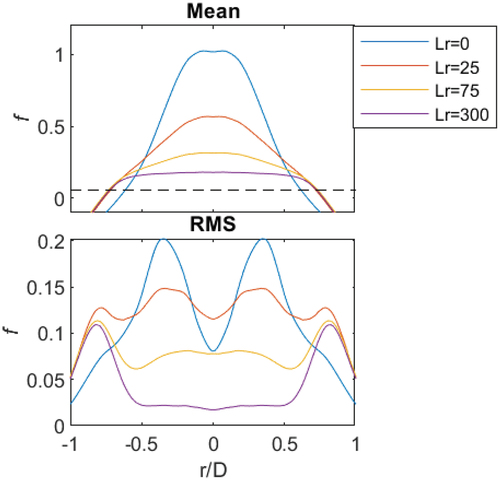
As the jet is slightly recessed (Lr = 25 mm), the mean mixture fraction is no longer pure CH4 on the centreline. The RMS on the centreline has slightly increased, compared to Lr = 0, as air is introduced and mixing occurs. For increased recess, the mean mixture approaches the global equivalence ratio of φ = 4.76, for this example. The homogeneous mixture is greater than the flammability limit of CH4, and the mixture fraction (f = 0.2) sits “above” the fst dashed line in . The RMS decreases for Lr > 25 mm as the mixture becomes more homogeneous until the RMS is nearly zero at Lr = 300 mm. The RMS, at r/D > 0.7, is significant since it is where the interaction of the pilot is large. It is noted that this is the region where large pilot interactions are observed; these positions are not included in the following analysis since the Rayleigh cross-section and temperature have not been resolved. It is observed that in the mean mixture fraction, it is difficult to ascertain the difference between Lr = 25–300 mm at the pilot interface (r/D = 0.6–0.7). Therefore, PDFs are used in the following section to identify the mixture for CH4 and all fuel mixtures investigated.
Mixture fraction PDF of CH4
The PDFs for CH4 (φ = 4.76 and φ = 12) at discrete radial bins is given in . Five radial bins are selected and their locations are indicated. These PDF plots make it more evident, than with the previous mean plots (), that for Lr = 0 pure fuel is observed near the centreline (r/D = 0–0.1). Moving from the centreline to the pilot interface, for Lr = 0, there is a large change in the PDFs going from f = 1 to f 0. Conversely, for Lr = 300 mm there is minimal difference between the PDFs at the center (r/D = 0–0.1) and close to the pilot (r/D = 0.4–0.6), since the mixture is homogeneous. At the pilot interface region (r/D = 0.6–0.7), there is notable pilot interaction, as the mixture fraction is extending lower than zero, and the PDF is skewed to the left.
Figure 8. Binned radial PDFs of CH4, φ = 4.76 (a) and φ = 12 (b) at four recess positions: Lr = 0, 25, 75 and 300. The vertical dashed line indicates the stoichiometric mixture fraction (fst).
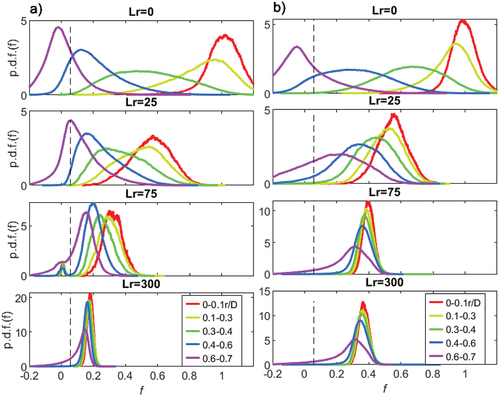
The stoichiometric mixture fraction fst (dashed line) is given on each plot, in , to indicate the relative mixture observed at each radial bin. In relation to the fst, dashed line, it is evident that for Lr = 0, the PDF is bimodal, indicating that most samples are either lean f 0 next to the pilot (r/D = 0. 58–0.7) or very rich when close to the central jet. Conversely, for Lr = 300 mm the PDF is monomodal, reflecting mixture homogeneity with most samples close to φ = 4.76. It is now discernible that at peak stability (Lr = 25 mm) seen from the stability plot in , the peak mode in the PDF is at stoichiometry and hence a lot of the mixture contacting the pilot is within flammability limits. It is these significant stoichiometric “parcels” that burn and augment the power from the pilot and improvement combustion stability.
As the mixture becomes richer, as seen in , for the extreme case φ = 12, the PDFs are different from those in . At Lr = 0 the PDF profiles are somewhat like φ = 4.76, with pure fuel on the centreline and air in contact with the pilot. There is a larger portion of pure fuel (f = 1) for φ = 12 since more fuel is issuing into the burner with a relatively higher velocity (compared to the annulus). It is the optimal recess distance, Lr = 25, where the notable differences in mixing occur. For the bin position in contact with the pilot (0.6–0.7 r/D), the peak mode mixture fraction is much richer than stoichiometry and far fewer stoichiometric samples occur. It is this large reduction in stoichiometric samples that stops the improvement in stability from . For the recess distances Lr = 75 and Lr = 300, the two PDFs are very similar, compared to φ = 4.76; this is because both mixtures are homogeneous. The richer mixture (φ = 12) has reached homogeneity earlier since the fuel is mixing with the annulus faster owing to relatively high fuel jet velocities; the mixing due to the annulus and fuel jet velocity ratio is discussed in the final section. It is noted here that the radial bins are large (r/D = 0.15), and the following analysis of the integrated PDFs has smaller bins to avoid the spatial location where the pilot interaction occurs, which skews the results.
Integrated CH4 PDFs near stoichiometry
The radially binned PDFs, from the previous section (), are integrated well within flammability limits, between 0.9 < φ < 1.1 or equivalently between 0.05 < f < 0.06 for pure CH4. The integrated PDFs are seen in for the three equivalence ratios investigated for pure CH4. The gray band represents the interface with the pilot at r/D = 0.65–0.7, and the symbols indicate the percentage of stoichiometric mixtures contacting the pilot band for each recess position. For the φ = 4.76 cases, it is evident, as shown previously, that the peak stability recess distance (Lr = 25, UP) has the flammable mixture coinciding with the pilot interface with ~ 7% of the samples being close to stoichiometry (triangle). For Lr = 0 and Lr = 300, the mixture at the pilot interface is lean and rich, respectively, with minimal stoichiometric samples given by the star and square, respectively. Particularly notable is that only 3.5% of the mixture is near flammable conditions for the homogeneous case (UH); where it is in this homogeneous case that the improvement (UImprv = UP/UH) due to inhomogeneity is compared ().
Figure 9. Integrated PDFs versus radial position of mixture fraction, between 0.9 < φ < 1.1 for three equivalence ratios: φ = 4.76, 6 and 12 for CH4 at four recession positions. The gray band represents the pilot interface (r/D = 0.65–0.7). The symbols indicate the intersection of each recess position with the pilot.
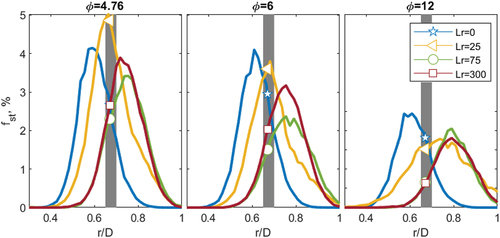
Increasing the equivalence ratio to φ = 6, the number of samples near stoichiometry reduces, compared to φ = 4.76, since the global mixture between the air in the annulus and fuel in the jet is further away from stoichiometry. At the same time, the number of stoichiometric samples close to the pilot for the Lr = 0 and the Lr = 25 cases becomes similar. Analysing the stability plots from the richer case (φ = 6) has a greater blow-off velocity at Lr = 0 (UBO = 40 m.s−1) than the leaner, φ = 4.76 case (UBO = 38 ms−1). The same comparison is found for the optimal recess position (Lr = 25), there are fewer stoichiometric samples contacting the pilot at φ = 6 than φ = 4.76, and the stability velocity decreases from φ = 67 ms−1 to 64 ms−1.
For the φ = 12 cases, the number of stoichiometric samples has further decreased. The previously optimal position of Lr = 25 has fewer stoichiometric samples near the pilot, causing a large decrease in the blow-off velocity from UBO = 67 m.s−1 to UBO = 39 m.s−1. The peak mode mixture seen by the pilot, at the optimal position (Lr = 25), is very rich, f = 0.2 (). Furthermore, the diffusive case (Lr = 0) now has more stoichiometric samples than the previously optimal case (Lr = 25) given by the star and triangle, respectively. This greater flammability of Lr = 0 at the pilot interface compared to Lr = 25 is reflected in the blow-off velocity (), with Lr = 0 having a higher blow-off velocity than Lr = 25. Finally, there are now a similar number of stoichiometric samples at Lr = 0 compared to Lr = 300, and the two cases have similar blow-off velocities (). Whilst there are still more stoichiometric samples near the pilot for Lr = 25 than in the homogeneous case (Lr = 300), there is not enough to significantly augment the power of the pilot, and hence no improvement due to inhomogeneity is observed ().
Integrated C3H8 PDFs near stoichiometry
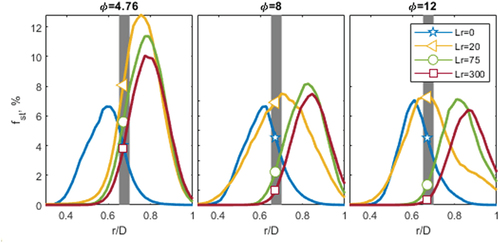
For C3H8, there was a reduction in the improvement due to inhomogeneity for φ = 4.76 compared to CH4, observed in . However, for C3H8, there was a significant improvement at far richer equivalence ratios of φ = 8 and φ = 12. The difference in equivalence ratio for a comparable improvement in stability, for C3H8 compared to CH4, is from the relative number of stoichiometric samples for the conditions at peak stability (Lr = 20) compared to the homogeneous case (Lr = 300). For φ = 4.76 there are 8% and 4% of the samples near stoichiometry at Lr = 20 and Lr = 300 respectively, observed in . Whilst for φ = 12 there are 7% and 0.3% at Lr = 20 and Lr = 300. For φ = 4.76, there are two times more stoichiometric samples at Lr = 20 compared to Lr = 300, whilst for φ = 12 there are up to 20 times more samples. This relative difference is what causes the larger difference in improvement with inhomogeneity seen in for the richer equivalence ratio.
Figure 10. Integrated PDFs versus radial position of mixture fraction, between 0.9 < φ < 1.1 for three equivalence ratios: φ = 4.76, 6 and 12 for C3H8 at four recession positions. The gray band represents the pilot interface (0.65–0.7 r/D). The symbols indicate the intersection of each recess position with the pilot.
Integrate CH4/N2 PDFs
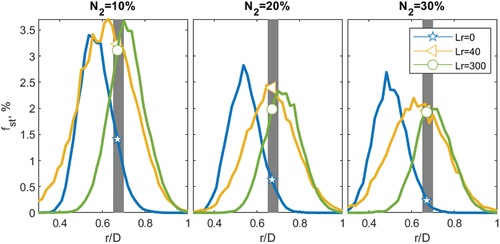
The addition of N2 to CH4, in the fuel stream, was observed to suppress the improvement due to inhomogeneity at 10% and completely negated any improvement at 30%. This phenomenon can also be attributed to the number of stoichiometric samples at the pilot interface (). The mixing profiles are somewhat similar between N2 addition, where at Lr = 40 the most samples are observed. However, the number of flammable samples at fst decreases with the addition of N2. The reduction in stoichiometric samples is in addition to the decrease in the reactivity and adiabatic flame temperature of the mixture due to N2 addition; these combining factors is what leads to the suppression of the inhomogeneous peak ().
Figure 11. Integrated PDFs versus radial position of mixture fraction, between 0.9 < φ < 1.1 for three N2 blends with CH4 at four recession positions. The dashed vertical line indicates the pilot interface.
Discussion
Equivalence ratio effect on peak stability improvement
The integrated PDFs of stoichiometric samples identified that to gain significant improvement, with inhomogeneity, a significant number of stoichiometric samples needs to be in contact with the pilot; significantly more than the homogeneous case (Lr = 300). For CH4 this occurred at φ = 4.76–6, whilst for C3H8 this was closer to φ = 8–12. This characteristic is consistent with hydrocarbons of varying molecular weights (not presented here), and this is strongly correlated to the stoichiometric air-to-fuel ratio (A/Fst).
For C3H8 the A/Fst is 2.5 times greater than CH4; this implies for an equivalent equivalence ratio, 2.5 times more air is required, seen in . This air is flowing through the annulus in the burner and if it is much greater than the fuel stream it will effectively “block” the fuel from contacting the pilot at high velocities. Therefore, to achieve similar A/F or VA/VJ, for C3H8, 2.5 times less air in the annulus is required and this equates to φ =12 if CH4 is operating at φ = 4.76. From the stability plots () matching the same VA/VJ achieved similar improvements (UImpr) with inhomogeneity ().
Table 1. Air to Fuel ratios and velocity ratios for CH4 and C3H8.
Furthermore, the mixing between the annulus is driven by the turbulent vortices and shear between the annulus and the fuel jet. The annulus has an area two times greater than the jet (), so to achieve the same velocity in the annulus a flow rate twice the jet is required. For CH4, at φ = 4.76 (A/F = 2) the velocity ratio (UJ/UA) between the jet and annulus is one (), similarly for C3H8 at φ = 12, UJ/UA = 1. If the mixtures are richer the velocity ratio is greater than one and the two streams, air and fuel, mix faster. This faster mixing is observed in the stability plots () for CH4 φ = 6 compared to φ = 4.76, the blow-off velocity is constant from Lr = 75–300 mm, since the mixture reaches homogeneity faster. It is noted that this comparison between CH4 and C3H8 isn’t including the differences in fuel densities and viscosity since the velocity ratio is identified to have a strong dependence.
The effect of N2 addition on peak stability
The addition of N2 has similar affects as equivalence ratio, an increase in N2 content decreases the number of stoichiometric samples. This decrease in stoichiometric samples near the pilot is suppressing the improvement due to inhomogeneity (). The suppression of the inhomogeneous peak is found for both CH4 and C3H8. However, the reduction, in the peak, is more sensitive for CH4 with N2 addition attributed to mixing; in addition, N2 has a larger effect on the reactivity (SL) of CH4 compared to C3H8.
Like higher equivalence ratios the addition of N2 increases the velocity of the fuel jet relative to the annulus, since the N2 is added to the central fuel jet. The increase in jet velocity increases the shear and mixing of the fuel jet into the air (annulus), this is reflected in the stability plots (), where homogeneity is achieved earlier with jet recession for more N2. Furthermore, for a small N2 addition of 10% to C3H8 there was an unexpected improvement in the inhomogeneous limit compared to pure C3H8. This again is attributed to the increase in jet velocity for the specific equivalence ratio case, φ = 8, with a jet to annulus velocity ratio of UJ/UA = 0.67. However, as with CH4 further N2 addition reduces the stoichiometric samples near the pilot and the peak stability decreases correspondingly.
Conclusion
This paper has presented results for two gaseous hydrocarbons, CH4 and C3H8, at a range of equivalence ratios and dilutions with N2. These two fuels have significantly different stoichiometric air-to-fuel ratios (A/F) and therefore provide different requirements to achieve optimal mixing in the Sydney inhomogeneous burner. The study looked at the difference in mixing fields at the exit plane of the burner using 10 Hz Rayleigh scattering with a reacting pilot. The imaging was done close enough to the nozzle, x/D = 0.7, such that the fuel was unreacted and the pilot influence was negligible at the region of interest.
The Rayleigh imaging was able to identify that at peak stability, a much larger portion of the fuel contacting the pilot is near stoichiometry. As the mixture got richer, specific to the fuel, less stoichiometric samples contacted the pilot at the optimal recess position. If the mixture is too rich, few samples are at stoichiometric conditions and no improvement with inhomogeneity is observed. Similarly, N2 was identified to decrease the number of stoichiometric samples near the pilot, also decreasing the improvement due to inhomogeneity.
The relationship between improvement with inhomogeneity for each fuel was closely correlated to A/F rather than the equivalence ratio. This was evident by CH4 having the greatest improvement due to inhomogeneity at φ = 4.76–6, whilst for C3H8, it occurred at φ = 8–12. The difference is due to the burner being run with the fuel in the central jet, FJ configuration, and hence the ratio of the fuel to air velocities is important for mixing. For the C3H8 (A/F = 23.8), the required air is 2.5 times greater than CH4 (A/F = 9.52) to achieve stoichiometry. Therefore, to achieve the same shear velocity and similar mixing profile between the annulus and jet, 2.5 times less air is required for C3H8, or an equivalence ratio 2.5 times higher.
Disclosure statement
No potential conflict of interest was reported by the author(s).
Additional information
Funding
References
- Barlow, R. S., S. Meares, G. Magnotti, H. Cutcher, and A. R. Masri. 2015. Local extinction and near-field structure in piloted turbulent CH4/air jet flames with inhomogeneous inlets. Combust. Flame 162 (10):3516–40. doi:10.1016/j.combustflame.2015.06.009.
- Cutcher, H. C., R. S. Barlow, G. Magnotti, and A. R. Masri. 2017. Turbulent flames with compositionally inhomogeneous inlets: Resolved measurements of scalar dissipation rates. Proc. Combust. Inst. 36:1737–45. doi:10.1016/j.proci.2016.07.093.
- Dec, J. E. 2009. Advanced compression-ignition engines—understanding the in-cylinder processes. Proc. Combust. Inst. 32:2727–42. doi:10.1016/j.proci.2008.08.008.
- Galindo, S., F. Salehi, M. J. Cleary, and A. R. Masri. 2017. MMC-LES simulations of turbulent piloted flames with varying levels of inlet inhomogeneity. Proc. Combust. Inst. 36:1759–66. doi:10.1016/j.proci.2016.07.055.
- Gicquel, L. Y. M., G. Staffelbach, and T. Poinsot. 2012. Large Eddy Simulations of gaseous flames in gas turbine combustion chambers. Prog. Energ. Combust. 38 (6):782–817. doi:10.1016/j.pecs.2012.04.004.
- Guiberti, T. F., M. Juddoo, D. A. Lacoste, M. J. Dunn, W. L. Roberts, and A. R. Masri. 2017. Fuel effects on the stability of turbulent flames with compositionally inhomogeneous inlets. Proc. Combust. Inst. 36:1777–84. doi:10.1016/j.proci.2016.08.051.
- Mansour, M. S., A. M. Elbaz, W. L. Roberts, M. S. Senosy, M. F. Zayed, M. Juddoo, and A. R. Masri. 2017. Effect of the mixing fields on the stability and structure of turbulent partially premixed flames in a concentric flow conical nozzle burner. Combust. Flame 175:180–200. doi:10.1016/j.combustflame.2016.08.032.
- Masri, A. R. 2015. Partial premixing and stratification in turbulent flames. Proc. Combust. Inst. 35:1115–36. doi:10.1016/j.proci.2014.08.032.
- Meares, S., and A. R. Masri. 2014. A modified piloted burner for stabilizing turbulent flames of inhomogeneous mixtures. Combust. Flame 161 (2):484–95. doi:10.1016/j.combustflame.2013.09.016.
- Meares, S., V. N. Prasad, G. Magnotti, R. S. Barlow, and A. R. Masri. 2015. Stabilization of piloted turbulent flames with inhomogeneous inlets. Proc. Combust. Inst. 35:1477–84. doi:10.1016/j.proci.2014.05.071.
- Stepowski, D., and G. Cabot. 1992. Single-shot temperature and mixture fraction profiles by Rayleigh scattering in the development zone of a turbulent diffusion flame. Combust. Flame 88 (3–4):296–308. doi:10.1016/0010-2180(92)90036-O.
- Wei, W., Z. Yu, T. Zhou, and T. Ye. 2018. A numerical study of laminar flame speed of stratified syngas/air flames. Int. J. Hydrog Energy 43 (18):9036–45. doi:10.1016/j.ijhydene.2018.03.167.