
ABSTRACT
To track changes in organic matter (OM) in peat soils, analytical techniques are needed that effectively characterize their chemical components. Pyrolysis-gas chromatography/mass spectrometry is a useful method for obtaining a chemical “fingerprint” of OM. To obtain representative fingerprints, the pyrolysis process should be highly reproducible and representative of the original sample; however, these key indicators for successful volatilization are underreported in the literature. We investigated the influence of instrumental parameters (temperatures, heating rates, sample mass), original organic C and nitrogen (N) content, and instrument type (“slow” vs “flash”), on volatilization of different peat samples by monitoring sample mass loss and changes in organic C and N content before and after pyrolysis. Average percent C by mass volatilized (“C pyrolysis efficiency”) across all pyrolysis experiments conducted (mass, instrument types, and settings) was 47.8 ± 1.8%. Sample mass was not a major driver; however, instrument temperatures, heating rate, and original N content had a significant influence on pyrolysis efficiency. N pyrolysis efficiency occurred at significantly higher rates (56.7–75.8%) than C pyrolysis efficiency (45.1–51.6%). N pyrolysis efficiency was also negatively influenced by decreasing concentrations of original sample N, suggesting that N-containing compounds may undergo preferential volatilization in high pyrolysis temperatures. Our data suggest that C pyrolysis efficiency is relatively insensitive to instrumental parameters; whereas when seeking to identify N-containing compounds, appropriate temperatures and heating rates must be chosen. These results provide an expected range for pyrolysis efficiency as a reference for peat samples analyzed with this technique.
Introduction
Soil organic matter (SOM) is a crucial store for terrestrial organic carbon (OC) and is considered to be an integral part of greenhouse gas emission mitigation (Paustian et al. Citation2016). Because of their huge OC store, peatlands play a special role in this context (Leifeld, Wüst-Galley, and Page Citation2019). Furthermore, peatlands are usually areas of great ecological and environmental value and have been used as a record of environmental changes. To this end, analysis methods are needed that can accurately identify and characterize organic matter (OM) composition, in order to track how these components change with decomposition and diagenesis processes. Differentiating changing conditions in peat using macroscopic methods presents a challenge, as the continuum of progressively decomposing OM can be difficult to distinguish visually. Characterizing the molecular components of an OM profile can distinguish periods with the prevalence of degradation (decomposition) and growth (accumulation), through the use of molecular biomarkers. This, in turn, offers an opportunity to improve flux estimates and to potentially assess restoration efforts using ratios of microbial matter to undecomposed plant material.
Numerous analysis techniques have been applied for the characterization of OM in peat, such as Fourier Transform Infrared spectroscopy (Artz et al. Citation2008; Chapman et al. Citation2001), isotope-ratio mass spectrometry (IR/MS) (Alewell et al. Citation2011; Krull and Retallack Citation2000), or solid-state 13 C nuclear magnetic resonance (NMR) spectroscopy (Baldock et al. Citation1997; Preston et al. Citation1994). Due to the molecular heterogeneity of OM and difficulty in obtaining a representative “snapshot” of such complex material, many studies combine multiple complementary analytical techniques (De la Rosa et al. Citation2011; Krüger et al. Citation2016; Lu, Hanna, and Johnson Citation2000).
Analytical pyrolysis has been identified as an especially effective tool for the molecular characterization of complex OM, eliminating the need for time-consuming wet chemistry pretreatment techniques (Derenne and Katell Citation2015; Parsi et al. Citation2007; Schellekens, Buurman, and Pontevedra-Pombal Citation2009). The volatile products released during the pyrolysis of peat often correspond to well-known components from plant and microbial origin (Boon, Dupont, and De Leeuw Citation1986). In particular, pyrolysis is an analytical tool especially responsive to the presence and composition of lignins (Martin, Saiz-Jimenez, and Gonzalez-Vila Citation1979), n-alkanes, and nitrogen (N)-containing compounds (De la Rosa et al. Citation2012). Much of SOM is composed of high molecular weight compounds (>600 Daltons) that are too large to be easily volatilized using standard gas chromatography-mass spectrometry techniques (White et al. Citation2004). To extract this material, chemical separation techniques are often required that can lead to both a modification of the original extracted compounds and a large component of remaining un-extractable OM material. Through thermal degradation of these large compounds into smaller molecular fragments (Saiz-Jimenez Citation1994), analytical pyrolysis permits the volatilization and identification of complex high molecular weight compounds that might not otherwise be detectable (White et al. Citation2004). Moreover, analytical pyrolysis coupled with gas chromatography-mass spectrometry (Py-GC/MS) provides enhanced structural detail, and when combined as part of a multi-proxy approach with other techniques, contributes high-resolution molecular data to OM component analysis.
While Py-GC/MS is a useful tool, some uncertainty exists regarding the representativeness of the pyrolyzed sample of the original OM. During the pyrolysis process, secondary reactions can occur from cleavage of larger macromolecules, resulting in the formation of novel compounds and inhibiting fragmentation of others (Saiz-Jimenez Citation1994). OM can also be modified via secondary reactions into compounds that are more thermally stable and resistant to pyrolysis than those originally present (Saiz-Jimenez Citation1994). Different instrument set-ups can create “cold spots,” or areas of slower flushing of pyrolyzates from the pyrolyzer to the detection system, potentially creating an environment for condensation of higher molecular weight compounds and preferential representation of smaller compounds in the analysis (Górecki and Poerschmann Citation2001; Parsi et al. Citation2007).
In addition, the pyrolysis process typically leaves behind a carbonaceous residue (char) of unknown quantity and composition (Uden Citation1993). OM content in a sample is not necessarily proportionate to the amount of material pyrolyzed and may be influenced by instrument parameters, sample mass, type, and origin of OM represented (Preston et al. Citation1994), or the presence of minerals or metal cations in the original sample (Schulten and Leinweber Citation1996). Adjustments in temperature or heating rates may be needed for compounds of varying molecular weight and polarity or to release OM bound to a mineral matrix.
As pyrolyzate-derived chromatograms reflect only the material that was readily volatilized and transferred onto the GC column, variations in Py-GC/MS total ion intensities (TII) have been observed across different analytical techniques (Huang et al. Citation1998). Moreover, “standard approaches” for analytical measurements using pyrolysis-based techniques are lacking. Due to the versatility of pyrolysis-driven methods when used to enhance volatilization of OM, researchers employ a variety of different temperatures, heating rates, instrumental configurations (offline pyrolysis, Curie-point pyrolysis, pyrolysis methods used in tandem with GC/MS or field ionization mass spectrometry (Py-FIMS), etc.), OM pre-treatment and/or extraction approaches. These differences are driven both by specific needs of labs and the type of OM studied. Each configuration and technique results in differences in OM volatilization and potential chemical selectivity. Therefore, it can be difficult to compare separation and detection studies using pyrolysis to one another, as no two method approaches are exactly the same. As a result of this variability in volatilization efficiency and other above-described challenges, direct quantitative Py-GC/MS analysis has not been considered feasible to date. For estimation purposes, chromatographic peak areas have been related to the quantity contained in the original sample to compare the effects of temperature and time on pyrolysis product formation (Lu et al. Citation2011) or by normalizing pyrogram peaks by measuring sample weight before and after pyrolysis (Biller and Ross Citation2014; Sorge et al. Citation1993). Measurements for pyrolysis efficiency as well as changes in carbon (C) and N content have been obtained for mineral soils and SOM extractions (Leinweber and Schulten Citation1995; Schulten, Leinweber, and Theng Citation1996; Sorge et al. Citation1993). However, studies specifically and systematically addressing pyrolysis efficiency have not yet been conducted for peat.
Pyrolysis-derived sample weight loss and OM volatilization (changes in C and N content before and after pyrolysis) are not typically reported currently in analytical Py-GC/MS research as a systematic practice, despite the need for improved knowledge regarding expected ranges of volatilization across different OM types and pyrolysis instrument set-ups. Moreover, as Py-GC/MS analysis is becoming a more frequently used tool to investigate the chemical composition of peat, a frame of reference of expected volatilization of OM is particularly needed for studying organic soils.
Aims of current study
To explore the physical and chemical mechanisms influencing the reliability of analytical pyrolysis techniques for peat soil samples, this study aimed to investigate the effect of instrumental parameters and original sample composition (OC and total N) on the amount of OM material successfully volatilized (hereby referred to as pyrolysis efficiency). To approach this aim, peat sample masses and OC and N content were monitored before and after pyrolysis to investigate pyrolysis-driven changes in OM content.
Materials and methods
Peat sample preparation
Ten peat samples were selected representing a range of different peatland types (fen, bog), climate (temperate, boreal), land uses, sampling depths, degradation status, and C and N content. The selected samples have also been previously analyzed via other instrumental techniques and are discussed further by Leifeld et al. (Citation2018). An overview of the selected sampling locations is provided in . All peat samples were collected in the field using peatland corers, stored at 2 °C until sample preparation, then oven-dried and homogenized with a mixer mill (Retsch MM 400) for 3 min at 25 Hz. No other pretreatment preparation of peat samples was applied prior to analysis. Due to insufficient sample quantity, sample S-7 was not measured in the Frontier pyrolysis efficiency analysis. All other peat samples used in the pyrolysis instrument comparison study were identical.
Table 1. Overview of sampling sites, including peatland type, current land use, sample depths, original OC and N content, soil pH, and degradation status.
Pyrolysis instruments and parameter settings
Instrumental parameters tested were temperature, heating rate, mass, and instrument set-up. Pyrolysis efficiency was monitored for changes by analyzing sample mass loss, as well as C and N content before and after pyrolysis.
C and N pyrolysis efficiency were calculated as percent volatilization:
PyE (%)= (Moriginal-Mfinal)/Moriginal*100
where Moriginal represents the elemental mass of the original pre-pyrolysis sample (mg C or N, calculated from percentage C or N obtained from elemental analysis), and Mfinal represents the elemental mass of the post-pyrolysis sample (mg C and N contained in char, calculated using percentage C or N obtained from post-pyrolysis elemental analysis).
“Slow” pyrolysis analysis was conducted using an “offline” Netzsch Simultaneous Thermal Analyzer STA 449 F3 equipped with a TG-DSC sample carrier (Type S) in inert Helium atmosphere. Samples were analyzed at 600 °C, 800 °C, and 990 °C, and at heating rates of 10 K/min., 20 K/min., and 50 K/min. At 50 K/min, the highest temperature measurement was reduced to 950 °C due to instrumental limitations. To investigate the effect of sample mass on pyrolysis efficiency, peat samples were measured in 20 mg, 10 mg, and 5 mg mass ranges. Reproducibility of C pyrolysis efficiency was conducted using one peat sample (S-6) measured five times under identical conditions and similar approximate mass (20 mg). The relationship between OC and N content and pyrolysis efficiency was investigated with a ten-part sample dilution study. For the dilution experiments, two pure samples (S2 and S6) were mixed with powdered aluminum oxide Al2O3 to achieve 75%, 66%, 50%, 33%, 25%, 10%, 5%, 2.5%, and 1% of the original sample OC concentration, then homogenized in a mixer mill for 2 min at 21 Hz. Peat samples used to investigate sample mass, original OC and total N (dilution measurements), and reproducibility were analyzed at 800 °C and a heating rate of 20 K/min. Mass loss was calculated via the integration of the thermogravimetric curve obtained for each sample.
“Flash” pyrolysis was conducted using a double-shot pyrolyzer (Frontier Laboratories, model 2020i) operating in single-shot mode. Approximately 20 mg of sample was introduced for 1 minute into a preheated (600 °C) micro-furnace with an inert He atmosphere. For “flash” pyrolysis measurements, sample mass loss was calculated through the mass difference of the sample capsules before and after pyrolysis.
Bulk OC and N analysis were conducted on all samples using a EuroEA3000 Elemental Analyzer by dry combustion.
Statistical analysis
Analytical pyrolysis instruments and parameter settings were statistically tested for differences in pyrolysis efficiency. Pyrolysis efficiency was correlated to sample C/N mass ratios and original C and N content via regression analyses. Differences in C and N pyrolysis efficiencies for the different instrument parameters including the different instruments were determined using a one-way analysis of variance (ANOVA), where factors (mass, heating rate, and temperature) were tested. In cases where significant differences were identified, factors were tested individually by paired T-test. Differences between overall C and N pyrolysis efficiency across all samples were determined by paired T-test. Statistical significance for all tests was set as p < .05. Results are given as mean ± standard deviation of the mean.
Results
C and N pyrolysis efficiency
Average C and N pyrolysis efficiency for the different instrumental parameters (temperatures, heating rate, and instrument) is provided in . Average C and N pyrolysis efficiency for different sample masses is provided in . While the “flash” pyrolysis instrument obtained a tendency toward higher efficiency measurements overall than those obtained from the “slow” pyrolysis instrument, they were not significantly different between the two instruments for C or N.
Table 2. Average ± standard deviation of C and N pyrolysis efficiency for instrumental parameters (in units of percent C or N by mass volatilized). “Flash” pyrolysis efficiency measurements were conducted using the Frontier pyrolysis instrument. All other parameters were measured on the Netzsch pyrolysis instrument.
Table 3. Average ± standard deviation of C and N pyrolysis efficiency using varied original sample mass (in units of percent C or N by mass volatilized) measured on Netzsch pyrolysis instrument at 800 °C and 20 K/min.
Mean C pyrolysis efficiency across all instrumental parameters (including different masses) was 47.8 ± 1.8% and ranged from 45.1% to 51.6%. Analytical error was 1.1% and was determined from the average C pyrolysis efficiency obtained in the reproducibility study (36.4 ± 0.4%). C pyrolysis efficiency was not significantly influenced by increases in temperature or mass. Significant increases in C pyrolysis efficiency were observed for samples pyrolyzed at 600 °C when the heating rate was increased from 10 K/min to 20 K/min (p < .01), and from 10 K/min to 50 K/min (p < .01), but no differences were observed when the heating rate was increased from 20 K/min to 50 K/min. Significant increases in C pyrolysis efficiency were also observed for samples pyrolyzed at the highest temperature (990 °C) when the heating rate was increased from 10 K/min to 50 K/min (p < .01) and from 20 K/min to 50 K/min (p < .01).
Mean N pyrolysis efficiency across all instrumental parameters was 67.3 ± 6.1% and ranged from 56.7% to 75.8%. N pyrolysis efficiency was significantly higher than C pyrolysis efficiency across all samples (p < .01). This suggests that N-containing compounds are preferentially volatilized during pyrolysis. Average reproducibility of N pyrolysis efficiency was determined using the same sample as measured for C reproducibility and was 80.1 ± 0.8%. N pyrolysis efficiency was not significantly different for different sample mass. High variability was observed for N pyrolysis efficiencies, possibly due to N concentrations of post-pyrolysis residues approaching the detection limit for the Elemental Analyzer.
N pyrolysis efficiency was significantly higher for temperatures of 800 °C and 900 °C than for 600 °C across all heating rates (p < .01). Significant differences in N pyrolysis efficiency were observed between 800 °C and 900 °C for heating rates at 20 K/min (p < .05) and 50 K/min (p < .05), but not for 10 K/min. All N pyrolysis efficiencies measured from all temperature comparisons were statistically significant when the rate was increased from 10 k/min to 50 K/min, indicating that the heating rate was an important factor for the volatilization of N-containing compounds (p < .05). A significant effect was also observed for the heating rate at 600 °C, where N pyrolysis efficiency increased when the heating rate was increased from 20 K/min to 50 K/min (p < .01).
Original OC and N content and pyrolysis efficiency – sample dilutions
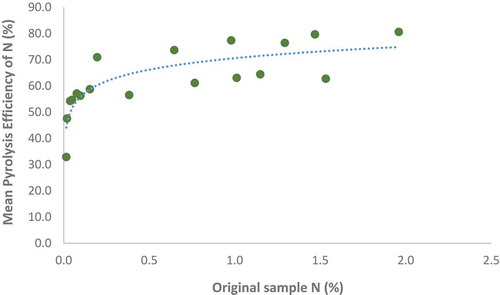
Dilution measurements showed only a weak correlation between C pyrolysis efficiency and original OC content (r = 0.25, p > .05), suggesting that initial concentrations of OC did not influence the successful pyrolysis of the material. However, a strong logarithmic relationship was observed between N pyrolysis efficiency and original N content (, r = 0.83, p < .01). At low initial N concentration, pyrolysis efficiency sharply decreased.
Figure 1. Average N pyrolysis efficiency and original sample N content (percent). The equation of the regression line is y = 6.3295ln(x) + 70.585.
Correlation to sample C/N
Original sample C/N ratios (pre-pyrolysis) were correlated to C pyrolysis efficiency. The C/N mass ratio had a strong positive linear correlation with pyrolysis efficiency on the “flash” Frontier instrument (r = 0.73, p < .05). However, a correlation was not observed with the “slow” Netzsch instrument, even across the highest temperatures and heating rates.
Discussion
The lack of significant difference in pyrolysis efficiency for C and N between the two instrument set-ups suggests that different pyrolysis instrument configurations can be expected to produce similar results, at least in terms of representativeness of the volatilized sample. Despite increasing trends with heating rate, the range for C pyrolysis efficiency (45.1–51.6%) was relatively narrow, suggesting that C-derived compounds may be somewhat less sensitive to adjustments to the pyrolysis method. The range for N pyrolysis efficiency, however, was larger (56.7–75.8%), suggesting a greater potential to adjust analytical instruments to improve N volatilization with increased temperature and heating rates. In addition, the significantly higher rates of N pyrolysis efficiency compared to C pyrolysis efficiency indicate that N-containing compounds may be preferentially volatilized during the pyrolysis process. The mechanism behind this stoichiometric preference is unclear and should be investigated in future pyrolytic kinetic studies.
N-containing compounds were more likely to be influenced by decreasing concentrations, particularly at very low original concentrations. Our data suggest that if peat samples contain original N content of at least 0.5%, an acceptable efficiency in pyrolyzed N-compounds (above 65%) is likely. As N-containing compounds serve an important role in nutrient-limited ombrotrophic peatlands (Larmola et al. Citation2013), it is important to consider this potential for stoichiometric selectivity in Py-GC/MS studies seeking to investigate the molecular composition of N-containing SOM. Care must be taken to use N-appropriate temperature and heating rate parameters (i.e., higher temperatures and heating rates than what might otherwise be appropriate for C compounds) in studies focused on N. This issue will also be of particular importance when characterizing N-containing compounds in OM, as amide and amine-derived compounds can be transformed into heterocyclic pyrroles and pyridines in pyrolysis conditions at lower temperatures (e.g. 350 °C), resulting in more stable compounds that subsequently require higher temperatures (greater than 600 °C) for further volatilization (De la Rosa et al. Citation2008). Further, it may be advisable to seek out the assistance of different instrument set-ups in other labs to improve results.
It is important to note that due to the versatility of the method, variety of approaches used, and lack of available pyrolysis efficiency data in the literature, it is difficult to compare different pyrolysis-based studies to one another. Nevertheless, a cautious comparison of findings is provided here. The ranges of C and N percent volatilization in this study (45.1–51.6 and 56.7–75.8, respectively) were slightly less than volatilization rates reported in previous studies on soil materials other than peat. While using pyrolysis-field ionization mass spectrometry (Py-FIMS) to investigate differences in clay-associated surfaces and interlayer OM volatility, Schulten, Leinweber, and Theng (Citation1996) reported that mineral soil samples volatilized 64% C and 76% N, and 86% C and 91% N for the same samples pre-treated with H2O2. It was also noted that before Py-GC/MS analysis, samples in that study were additionally pre-treated with tetramethylammonium hydroxide (TMAH). Further, Leinweber and Schulten (Citation1995) found an average volatilization of 57% C and 79% N from a wide range of OM samples when investigating soil-mineral associations in mineral soils of agricultural origin. While their findings were slightly higher than our values, we still consider them in agreement with the results of this study. Sorge et al. (Citation1993) used Py-FIMS to investigate method reproducibility and to explore the influence of sample organic C concentration on the percentages of volatilized matter. After determining the percentage of volatilized matter across a range of bulk soils, litter samples, and humic substances, they found that percent residue indicated that an average of only 24.6% of the initial sample was volatilized, with as little as 4.7% volatilization rate reported for whole soils. Volatilization of litter and humic substances in that study was 54.4%, similar to the findings of this research (Sorge et al. Citation1993). It was also noted that, in agreement with this study, these authors reported higher N pyrolysis volatilization relative to C volatilization.
Leinweber and Schulten (Citation1995) and Sorge et al. (Citation1993) also reported a positive correlation of the proportion of OM volatilized to the initial sample C concentration, in contrast to the findings of this study. However, in addition to the TMAH thermochemolysis used by Schulten, Leinweber, and Theng (Citation1996), each of these previous studies included results that relied on a combination of chemical pre-treatments and/or extractions as a part of their analyses, which may have the potential to introduce chemical changes to the original sample material (Leinweber and Schulten Citation1995; Sorge et al. Citation1993). Although chemical pre-treatments and OM extractions can be beneficial in assisting in demineralization of OM-poor samples (such as from clayey soils) and may improve pyrolytic volatilization of OM, reliable results for molecular compounds can also be obtained using untreated samples (Grandy et al. Citation2009). Moreover, there is also compelling evidence that some pre-treatment and extraction methods can result in the selective loss of some OM compounds, thus skewing the interpretation of results (Derenne and Katell Citation2015; Schmidt et al. Citation2011). Thus, it is beneficial to obtain measurements for pyrolysis efficiency for untreated samples.
Conclusions
Analytical pyrolysis is a highly reproducible technique for the volatilization and detection of organic constituents of peat samples. Sample heating rate was found to significantly influence both C and N pyrolysis efficiency; however, the effect was stronger for N. N pyrolysis efficiency was also significantly influenced by increasing maximum temperatures, whereas C pyrolysis efficiency was not driven by this factor. Sample mass was not a major driver of pyrolysis efficiency for either C or N.
Overall pyrolysis efficiency was found to be affected by original N content, suggesting that successful OM volatilization may be influenced by original sample OM chemistry. For analytical pyrolysis measurements, this also suggests that original OM sample chemistry is more influential for complete volatilization than instrumental parameters used (assuming minimal combustion). It remains generally unknown whether certain classes of compounds (i.e., polysaccharides, N-containing compounds) might be over or under-represented in peat Py-GC/MS studies when using different temperatures, heating rates, or instruments.
The results of this study are of interest in the development of quantitative applications of analytical pyrolysis in the near future. As most instrumental analysis methods present the potential for some degree of selectivity, combining Py-GC/MS techniques with complementary methods is recommended for robust analysis – particularly for the interpretation of complex OM. In addition, while analytical pyrolysis instruments are generally unable to achieve total sample volatilization, these data provide a reasonable prediction for molecular recovery for peat OM samples when using pyrolysis analytical techniques. These estimates may also serve as an important check on method quality control prior to subsequent chemical characterization analysis.
Acknowledgments
The authors would like to thank the anonymous reviewer for their constructive comments and suggestions. Robin Giger conducted the elemental analysis for all peat samples and maintenance on the Netzsch pyrolyzer instrument. Markus Jocher assisted with maintenance for the Frontier pyrolyzer instrument. Their assistance with this work was invaluable and greatly appreciated. This study was funded by the Swiss National Science Foundation, project number 200021_169556. J.M. De la Rosa thanks the Spanish Ministry of Economy and Competitiveness (MINECO) and AEI for funding his “Ramón y Cajal” post-doctoral contract (RYC2014-16338).
Additional information
Funding
References
- Alewell, C., R. Giesler, J. Klaminder, J. Leifeld, and M. Rollog. 2011. Stable carbon isotopes as indicators for environmental change in palsa peats. Biogeosciences 8 (7):1769–78. doi:10.5194/bg-8-1769-2011.
- Artz, R. R. E., S. J. Chapman, A. H. J. Robertson, J. M. Potts, F. Laggoun-Défarge, S. Gogo, L. Comont, J.-R. Disnar, and A.-J. Francez. 2008. FTIR spectroscopy can be used as a screening tool for organic matter quality in regenerating cutover peatlands. Soil Biology and Biochemistry 40 (2):515–27. doi:10.1016/j.soilbio.2007.09.019.
- Baldock, J. A., J. M. Oades, P. N. Nelson, T. M. Skene, A. Golchin, and P. Clarke. 1997. Assessing the extent of decomposition of natural organic materials using solid-state 13C NMR spectroscopy. Soil Research 35 (5):1061–84. doi:10.1071/S97004.
- Biller, P., and A. B. Ross. 2014. Pyrolysis GC–MS as a novel analysis technique to determine the biochemical composition of microalgae. Algal Research 6:91–97. doi:10.1016/j.algal.2014.09.009.
- Boon, J. J., L. Dupont, and J. W. De Leeuw. 1986. Characterization of a peat bog profile by Curie point pyrolysis-mass spectrometry combined with multivariant analysis and by pyrolysis gas chromatography-mass spectrometry. In Fuchsman, C.H., editor, Peat and Water, New York: Elsevier, 215–39.
- Chapman, S. J., C. D. Campbell, A. R. Fraser, and G. Puri. 2001. FTIR spectroscopy of peat in and bordering Scots pine woodland: Relationship with chemical and biological properties. Soil Biology and Biochemistry 33 (9):1193–200. doi:10.1016/S0038-0717(01)00023-2.
- De la Rosa, J. M., J. A. González-Pérez, R. González-Vázquez, H. Knicker, E. López-Capel, D. A. C. Manning, and F. J. González-Vila. 2008. Use of pyrolysis/GC–MS combined with thermal analysis to monitor C and N changes in soil organic matter from a Mediterranean fire affected forest. Catena 74 (3):296–303. doi:10.1016/j.catena.2008.03.004.
- De la Rosa, J. M., J. A. González-Pérez, F. J. González-Vila, H. Knicker, and M. F. Araújo. 2011. Molecular composition of sedimentary humic acids from South West Iberian Peninsula: A multi-proxy approach. Organic Geochemistry 42 (7):791–802. doi:10.1016/j.orggeochem.2011.05.004.
- De la Rosa, J. M., S. R. Faria, M. E. Varela, H. Knicker, F. J. González-Vila, J. A. González-Pérez, and J. Keizer. 2012. Characterization of wildfire effects on soil organic matter using analytical pyrolysis. Geoderma 191:24–30. doi:10.1016/j.geoderma.2012.01.032.
- Derenne, S., and Q. Katell. 2015. Analytical pyrolysis as a tool to probe soil organic matter. Journal of Analytical and Applied Pyrolysis 111:108–20. doi:10.1016/j.jaap.2014.12.001.
- Górecki, T., and J. Poerschmann. 2001. In-column pyrolysis: A new approach to an old problem. Analytical Chemistry 73 (9):2012–17. doi:10.1021/ac000913b.
- Grandy, A. S., M. S. Strickland, C. L. Lauber, M. A. Bradford, and N. Fierer. 2009. The influence of microbial communities, management, and soil texture on soil organic matter chemistry. Geoderma 150 (3–4):278–86. doi:10.1016/j.geoderma.2009.02.007.
- Huang, Y., G. Eglinton, E. R. E. Van der Hage, J. J. Boon, R. Bol, and P. Ineson. 1998. Dissolved organic matter and its parent organic matter in grass upland soil horizons studied by analytical pyrolysis techniques. European Journal of Soil Science 49 (1):1–15. doi:10.1046/j.1365-2389.1998.00141.x.
- Krüger, J. P., C. Alewell, K. Minkkinen, S. Szidat, and J. Leifeld. 2016. Calculating carbon changes in peat soils drained for forestry with four different profile-based methods. Forest Ecology and Management 381:29–36. doi:10.1016/j.foreco.2016.09.006.
- Krull, E. S., and G. J. Retallack. 2000. δ13C depth profiles from paleosols across the Permian-Triassic boundary: Evidence for methane release. Geological Society of America Bulletin 112 (9):1459–72. doi:10.1130/0016-7606(2000)112<1459:CDPFPA>2.0.CO;2.
- Larmola, T., J. L. Bubier, C. Kobyljanec, N. Basiliko, S. Juutinen, E. Humphreys, M. Preston, and T. R. Moore. 2013. Vegetation feedbacks of nutrient addition lead to a weaker carbon sink in an ombrotrophic bog. Global Change Biology 19 (12):3729–39. doi:10.1111/gcb.12328.
- Leifeld, J., C. Alewell, C. Bader, J. P. Krüger, C. W. Mueller, M. Sommer, M. Steffens, and S. Szidat. 2018. Pyrogenic carbon contributes substantially to carbon storage in intact and degraded northern peatlands. Land Degradation & Development 29 (7):2082–91. doi:10.1002/ldr.2812.
- Leifeld, J., C. Wüst-Galley, and S. Page. 2019. Intact and managed peatland soils as a source and sink of GHGs from 1850 to 2100. Nature Climate Change 9 (12):945-47.
- Leinweber, P., and H.-R. Schulten. 1995. Composition, stability and turnover of soil organic matter: Investigations by off-line pyrolysis and direct pyrolysis-mass spectrometry. Journal of Analytical and Applied Pyrolysis 32:91–110. doi:10.1016/0165-2370(94)00832-L.
- Lu, Q., X.-C. Yang, C.-Q. Dong, Z.-F. Zhang, X.-M. Zhang, and X.-F. Zhu. 2011. Influence of pyrolysis temperature and time on the cellulose fast pyrolysis products: Analytical Py-GC/MS study. Journal of Analytical and Applied Pyrolysis 92 (2):430–38. doi:10.1016/j.jaap.2011.08.006.
- Lu, X. Q., J. V. Hanna, and W. D. Johnson. 2000. Source indicators of humic substances: An elemental composition, solid state 13C CP/MAS NMR and Py-GC/MS study. Applied Geochemistry 15 (7):1019–33. doi:10.1016/S0883-2927(99)00103-1.
- Martin, F., C. Saiz-Jimenez, and F. J. Gonzalez-Vila. 1979. Pyrolysis-gas chromatography-mass spectrometry of lignins. Holzforschung 33 (6):210–12.
- Parsi, Z., N. Hartog, T. Górecki, and J. Poerschmann. 2007. Analytical pyrolysis as a tool for the characterization of natural organic matter—A comparison of different approaches. Journal of Analytical and Applied Pyrolysis 79 (1):9–15. doi:10.1016/j.jaap.2006.10.013.
- Paustian, K., J. Lehmann, S. Ogle, D. Reay, G. Philip Robertson, and P. Smith. 2016. Climate-smart soils. Nature 532 (7597):49. doi:10.1038/nature17174.
- Preston, C. M., R. Hempfling, H.-R. Schulten, M. Schnitzer, J. A. Trofymow, and D. E. Axelson. 1994. Characterization of organic matter in a forest soil of coastal British Columbia by NMR and pyrolysis-field ionization mass spectrometry. Plant and Soil 158 (1):69–82. doi:10.1007/BF00007919.
- Saiz-Jimenez, C. 1994. Analytical pyrolysis of humic substances: Pitfalls, limitations, and possible solutions. Environmental Science & Technology 28 (11):1773–80. doi:10.1021/es00060a005.
- Schellekens, J., P. Buurman, and X. Pontevedra-Pombal. 2009. Selecting parameters for the environmental interpretation of peat molecular chemistry–a pyrolysis-GC/MS study. Organic Geochemistry 40 (6):678–91. doi:10.1016/j.orggeochem.2009.03.006.
- Schmidt, M. W. I., M. S. Torn, S. Abiven, T. Dittmar, G. Guggenberger, I. A. Janssens, M. Kleber, I. Kögel-Knabner, J. Lehmann, and D. A. C. Manning. 2011. Persistence of soil organic matter as an ecosystem property. Nature 478 (7367):49. doi:10.1038/nature10386.
- Schulten, H.-R., and P. Leinweber. 1996. Characterization of humic and soil particles by analytical pyrolysis and computer modeling. Journal of Analytical and Applied Pyrolysis 38 (1–2):1–53. doi:10.1016/S0165-2370(96)00954-0.
- Schulten, H.-R., P. Leinweber, and B. K. G. Theng. 1996. Characterization of organic matter in an interlayer clay-organic complex from soil by pyrolysis methylation-mass spectrometry. Geoderma 69 (1–2):105–18. doi:10.1016/0016-7061(95)00054-2.
- Sorge, C., R. Müller, P. Leinweber, and H.-R. Schulten. 1993. Pyrolysis-mass spectrometry of whole soils, soil particle-size fractions, litter materials and humic substances: Statistical evaluation of sample weight, residue, volatilized matter and total ion intensity. Fresenius’ Journal of Analytical Chemistry 346 (6):697–703. doi:10.1007/BF00321275.
- Uden, P. C. 1993. Nomenclature and terminology for analytical pyrolysis (IUPAC Recommendations 1993). Pure and Applied Chemistry 65 (11):2405–09. doi:10.1351/pac199365112405.
- White, D. M., D. Sarah Garland, L. Beyer, and K. Yoshikawa. 2004. Pyrolysis-GC/MS fingerprinting of environmental samples. Journal of Analytical and Applied Pyrolysis 71 (1):107–18. doi:10.1016/S0165-2370(03)00101-3.