
 ?Mathematical formulae have been encoded as MathML and are displayed in this HTML version using MathJax in order to improve their display. Uncheck the box to turn MathJax off. This feature requires Javascript. Click on a formula to zoom.
ABSTRACT
There is an increasing need for accessible methods to monitor soil health. Our primary objective was to evaluate an accessible, do-it-yourself method for measuring the maximum water holding capacity – we call this the funnel, filter paper, and drainage (MWHCFFPD) method. First, we compared MWHCFFPD to the water desorption method via pressure cells (WHCPC), routinely used for generating soil water retention curves, using 10 soils from a wide range of textures (4–55% clay). Second, we tested the sensitivity of the MWHCFFPD to methodological variations likely encountered by citizen scientists. The two methods were quite comparable in precision, with mean coefficient of variances of 3.5% and 4.4% for the FFPD and water desorption method, respectively. The MWHCFFPD and WHCPC methods were comparable, with MWHCFFPD best correlating to WHCPC at −2.45 kPa (R2 = 0.98). The MWHCFFPD method is somewhat sensitive to some methodological modifications, most notably variation in water source, but with standardized protocols could be scientifically robust. Overall, MWHCFFPD can be used as a simple and affordable test of sieved soil structure and organic matter, and thus has potential to expand soil health monitoring.
Introduction
One critical soil ecosystem service that supports life on earth is a soil’s ability to store water (Lal Citation2015). Soil water storage is essential from global to field scales – contributing to the hydrologic cycle, flood mitigation, and supplying plants with this growth-limiting resource. Soil water holding capacity (WHC) is one measure of a soil’s ability to store water and is the mass of water a given soil can store or hold per unit of mass (Lane and D’Amico Citation2010; Wong et al. Citation2015).
A given soil’s WHC is regulated by many factors. Arguably, the most important factor is soil texture – and this is considered an inherent soil property and relatively immutable (or insensitive to management practices). Soil WHC is well known to increase with clay content (Lal Citation1978; Salter and Williams Citation1965; Unger Citation1975). Other soil properties regulating WHC are more readily influenced by management practices (Bagnall et al. Citation2022; Panagea et al. Citation2021) and include: soil organic matter (Hudson Citation1994), bulk density and related pore space (Verheijen et al. Citation2019), pH and bridge cations (Hernando, Lobo, and Polo Citation1989), and biological activity that produce organic, polymeric “glues” that bind soil particles together (Chenu Citation1995; Rillig Citation2004). One of the main goals of conservation management is to improve these dynamic soil properties, either by altering soil structure or increasing soil organic matter for improved WHC.
As WHC is a critical soil function and sensitive to management practices, its increased monitoring, as a component of soil health, is a laudable goal (Doran Citation2002; Doran, Sarrantonio, and Liebig Citation1996). Doran, Sarrantonio, and Liebig (Citation1996) define soil health as: “the continued capacity of soil to function as a vital living system, within ecosystem and land-use boundaries, to sustain biological productivity, maintain the quality of air and water environments, and promote plant, animal, and human health.” Increasing professional scientists’ and nonprofessional scientists’ (i.e., citizen scientists’) ability to monitor WHC with a robust, consistent method can bolster the soil health movement (Karlen et al. Citation2021) and expand monitoring soil change for voluntary carbon (C) and ecosystem service markets (Ribaudo et al. Citation2010). However, monitoring changes in soil structure and WHC are expensive and time-consuming.
There are a handful of methods scientists use to measure a soil’s WHC (Klute Citation2018). Probably the most common method is using a pressure plate – where soil samples are placed onto a porous ceramic plate in a pressurized container and WHC can be determined across a range of water potentials (Dane and Hopmans Citation2002). A similar method uses pressurized containers called pressure cells, and instead of a ceramic plate, a nylon filter is used where pressure is applied to determine WHC at specific water potentials (Ankeny, Brown, and Cruse Citation1992; Kool et al. Citation2019). Additionally, a more recent instrument uses the Wind/Schindler evaporation method for more negative water potentials (Schindler et al. Citation2010). All these methods require expensive equipment (> $2,000 USD), vacuum or compressed air, and patience (especially when creating a water-potential curve which can take several days to weeks).
Given the expense and effort required to measure WHC, with both traditional and newer measurement methods, we need more accessible methods that are also accurate and precise (or scientifically robust). The soil science community values accuracy and precision, but enhancing accessibility – by reducing cost, time, and the level of expertise needed – will also expand the scope of soil WHC measurements. To our knowledge, however, only one recent paper has compared standard lab methods (water desorption via pressure plate or pressure cell) with more accessible methods of measuring WHC (Govindasamy et al. Citation2022). While this study was a good start and compared two soils of different textures (clay loam and sandy clay loam), the soil science and broader citizen scientist communities require more research to provide confidence in these more simple, affordable WHC measurements. More specifically, an expanded comparison is especially needed across a wider spectrum of soil textures, since it is such an important component of WHC. Additionally, some sensitivity tests are needed to determine how slight methodological variations might affect a measured outcome.
One simple and affordable soil WHC method tested in Govindasamy et al. (Citation2022) is the maximum WHC measured using funnel and filter paper after several hours of drainage (MWHCFFPD). This method has sometimes been called “gravity-drained” or “container capacity” (White and Mastalerz Citation1966). A similar version of this has existed in the soil biology, ecology, and fertility sub-disciplines for decades. The MWHCFFPD method allows one to measure the mass of water a sieved soil (<2 mm) can hold after drainage in a funnel with filter paper. The method is frequently used to determine the amount of water to add for maximum microbial activity in a soil incubation, typically 50% or 60% of MWHCFFPD (Robertson et al. Citation1999).
Besides being an ‘ancillary’ measurement for soil incubations, the MWHCFFPD method could be used for measuring changes in soil structure <2 mm since soils are often sieved before carrying out the procedure. Therefore, the measurement could be especially useful to compare soils from the same location that may differ in factors that regulate WHC, like soil organic matter content or <2 mm soil structural differences. For example, one study showed preliminary evidence of the perennial biomass crop, Miscanthus × giganteus Greef et Deu., to increase MWHCFFPD compared to annual crops (Studt Citation2019).
Despite MWHCFFPD being commonly used by soil biologists and ecologists, the method is usually not well described, if present at all, in Materials & Methods sections. The measurement is also likely greater than field capacity (> −10 kPa) since macrostructure and macroaggregates have been destroyed by sieving for measurement consistency and ease, but we do not know for sure. Furthermore, and perhaps most importantly, it has yet to be tested against standard lab methods for WHC across a range of soil textures.
Our objectives for this study were two-fold. First, we wanted to test the accuracy and precision of measuring of the MWHCFFPD by comparing it to the well-established water desorption method measured with pressure cells (WHCPC) over a wide range of soil textures. For this objective, we have three hypotheses: H1, MWHCFFPD will correlate with WHCPC method; H2, the water potential at which both methods are most similar will be greater than field capacity (~ −10 kPa) since macropores are removed via sieving <2 mm; and H3, the precision estimated by coefficient of variation will be similar between both methods. Our second objective was to test the sensitivity of MWHCFFPD at two soil textures (~4% and 43% clay) to determine how much variation may occur due to slight methodological changes, including: drainage time, using a covering to prevent evaporation, filter paper types, and water source (i.e., ionic strength). If the accuracy and precision constraints defined in H1 and H3 are supported by our analysis, then these MWHCFFPD sensitivity tests could help determine if MWHC monitoring can be made more accessible to citizen scientists yet remain accurate and precise. Alternatively, if the method varies with these slight methodological changes, then we need to make a recommendation for consistency of MWHCFFPD measurements.
Materials and Methods
Soil source, preparation, and ancillary properties
For our range of soil textures, we used ten soil samples (approximate depth 0–15 cm) collected across Iowa, USA, under various land uses (). All soils were sieved to <2 mm. Four soils were freshly sieved (at field moisture), while the other six were dried to stable moisture and ground-sieved to <2 mm (Vitamix 5200 machine, Vitamix Corp., Cleveland, OH, USA). We measured soil texture with laser diffractometry according to Miller and Schaetzl (Citation2012) and using a Malvern Mastersizer 2000E laser particle size analyzer (Malvern Instruments Ltd., Worcestershire, UK) with a Hydro 2000MU pump accessory. We also measured soil organic matter using loss on ignition by weighing 10 g of soil into crucibles and combusting them at 550°C for 4 h (Koszinski et al. Citation2015). Clay contents ranged from 4% to 55%, and soil organic matter content ranged from 1.0% to 8.5% ().
Table 1. Soil identification, series name, textural class, and mean (standard deviationδ) of several chemical and physical characteristics including: soil texture; soil organic matter (SOM); pH; electrical conductivity (EC); and gravimetric water content (θg) at − 9.81 kPa, −2.45 kPa, and at maximum water holding capacity (MWHC) with funnel, filter-paper and drainage method.
Maximum water holding capacity via funnel, filter paper, and drainage (MWHCFFPD) method
This MWHCFFPD approach estimates MWHC, as the maximum gravimetric water content following gravity drainage from a saturated soil sample sieved to <2 mm. We followed the Robertson et al. (Citation1999) method with some modifications aimed at increasing the accessibility and practicality of the approach. Instead of allowing drainage for 24 h, we measured the final gravimetric water content (θg) after 6 h of drainage. Also, for added convenience, and practicality, we conducted our method in a lab at a relative humidity of 15% and covered the samples so they experience closer to 100% humidity as suggested by Robertson et al. (Citation1999).
For each of our 10 soils, we also used six pseudo replicates from the composite samples for the MWHCFFPD method (see diagram in Supplementary Materials). This replication was used to determine the precision of the method. To begin, a Whatman #1 filter paper was folded into quadrants to make a cone shape that we fitted into the 100 ml conical funnel. Next, we used deionized (DI) water to pre-saturate the filter paper in the funnel by dispensing it around the edges and letting the excess pass through. Then 10 g of air-dried soil was placed into the wet filter paper funnel. We saturated the soil by wetting the outer rim of the exposed filter paper so as not to disrupt the soil nor cause crusting. This allowed the soil to wet upward via capillary action. After the soil was glistening and even a small amount of water was showing at the surface of the soil, we stopped wetting. For the MWHCFFPD and MWHCPC method comparisons, we covered the funnels loosely with a plastic cap to minimize evaporation. After 6 h, the funnel, wet filter-paper, and drained soil were weighed. Then the soil and filter paper were oven dried to get the dry weight.
To calculate the MWHCFFPD, we used:
Where SF6 represents mass in g of saturated and drained soil plus filter paper after 6 h drainage. BF0 and BF6 are the weight of the dry filter and “blank” filter with no soil but saturated after 6 h to account for any water lost via evaporation. SFdry is the mass of oven-dry soil in g. The MWHCFFPD is then expressed as a fraction or g H2O per g dry soil. However, MWHCFFPD can also be expressed as a percentage, and often has been expressed this way.
The determination of soil water content is crucial for accurately assessing MWHCFFPD, with several drying methods available for use: air drying, oven drying, and microwave drying. Air drying, the simplest method, involves spreading the soil sample and allowing it to dry naturally in ambient conditions. This method is accessible for citizen scientists due to its convenience and lack of special equipment. However, it is influenced by environmental factors like temperature and humidity, and it can leave some water adsorbed to soil particles, leading to potential inaccuracies. Oven drying, often considered the standard method, involves drying the soil in an oven at approximately 105°C for about 24 h (Gardner Citation1986). While this method is more accurate, it is time-consuming and requires an oven, making it less accessible for citizen scientists. Although we did not test this method, microwave drying, a quicker method, heats the soil in a microwave to evaporate the water (Gardner Citation1986; Gee and Dodson Citation1981). This method is faster than oven drying, but it requires a microwave and careful monitoring to prevent overheating. It also may not be as accurate as oven drying due to potential non-uniform heating. While air drying is more accessible for citizen scientists, it might not provide the highest accuracy for measuring MWHCFFPD. Still, for many purposes, the slight potential decrease in accuracy may be acceptable given its convenience and accessibility.
Water retention curves using pressure cells (PC)
We used the water desorption method via PCs as our standard laboratory method for water holding capacity, as gravimetric water content, at several pressure potentials (Dane and Hopmans Citation2002; Kool et al. Citation2019). We used the PC apparatus described in Ankeny, Brown, and Cruse (Citation1992). For each of our 10 soils, we measured WHC (in gravimetric water content) at pressure potential values of 0, −0.15, −2.45, −9.81, −32.36, and −49.03 kPa for six pseudo replicates. We used this range for two reasons. First, we wanted to get well-characterized water retention curves for each of our soils, but second, we also do not know which water potential the WHCPC will best correlate with MWHCFFPD. According to our H1b, we expect it will be greater than −9.81 kPa, the wetter end of what is considered field capacity.
To begin each soil water retention curve measurement, a 5 cm diameter and 3 cm tall copper ring was filled with <2 mm sieved composite soil to a bulk density of ~1.3 g/cm3. After the soil cores were assembled, they were placed in a vacuum chamber with DI water filled to 1 cm below the ring's rim to saturate the samples. Saturating samples in a vacuum chamber decreases the potential entrapment of air due to the DI water moving upward into the sample. After soil cores were fully saturated and drained for 24 h, θg measurements were taken at previously mentioned pressure potentials for 5 d (sensu Kool et al. Citation2019).
Sensitivity of the MWHCFFPD method to drainage time, cover types, filter paper types, and water source
We selected two soils (A and G) from the original 10 soil samples for four sensitivity tests (). Soil A is classified as sand with a sand content of 87.4% (). Soil G is classified as clay loam with a 33% clay content (). First, the MWHCFFPD method was tested at three different drainage times to ascertain if there was a significant difference in MWHCFFPD with different soil drainage times. The three times tested were 3 h, 6 h, and 24 h. Except for drainage time, all other aspects of our experimental procedure were consistent with the standard method (see Supplemental Materials).
Table 2. Details and rationale on four sensitivity tests on factors controlling gravimetric water content at maximum water holding capacity (θg-MWHC) measurement.
We then compared the sensitivity of the MWHCFFPD method to different covering materials used to slow evaporation. A standard plastic cap that loosely sits on top of the funnel to minimize evaporation was compared with a generic plastic wrap, which can be purchased from local stores. The third treatment was a control with no covering on the funnel. Gravimetric water content was then measured as described previously.
Next, we determined the sensitivity of the MWHCFFPD method to different filter paper types (some more accessible to citizen scientists than others). We tested a standard lab filter paper (Whatman #1), which is not a readily available filter type, compared to two store-bought brands of bleached coffee filters (Melitta and Great Value), which are widely available. MWHC was then measured using the standard MWHCFFPD method with the filter paper being the only variable (see Supplemental Materials).
Some citizen scientists whom use the MWHCFFPD method may not have access to deionized (DI) water. Therefore, other readily available sources of water (tap water and spring water) were tested. In addition, 0.01 M CaCl2 solution was used to represent a source of water with dissolved minerals like well water. We then measured MWHC values using the standard MWHCFFPD method with the type of water used to saturate the filters and soils being the only variable (see Supplemental Materials).
Statistical analysis
To determine the accuracy of the MWHCFFPD method, we correlated it with the WHCPC method using a linear regression model (y = a + bx) where y is the mean θg at WHC of the 10 soils measured using the MWHCFFPD method, x is the θg of the 10 soils using WHCPC at multiple water potentials (−9.8 to 0 kPa), a and b are the parameters of the regression equation (intercept and slope, respectively). We visualized the best-fitting relationship between MWHCFFPD and WHCPC methods in terms of largest coefficient of determination (R2) and smallest difference between θg at the two closest WHCs. To compare the variability, i.e., precision, of the MWHCFFPD and WHCPC methods, we calculated the coefficient of variation (CV) across the 10 soils and compared CVs using a two-sample t-test at the best fitting water potential for MWHCFFPD and WHCPC methods. All statistical tests and visualizations were done using R version 4.2.1 (R Core Team, R Citation2013).
For the sensitivity analysis of the MWHCFFPD method, we used a two-way analysis of variance (ANOVA) model with interactive effects between sensitivity treatments (two to four levels) and soil (two levels) as main effects on MWHCFFPD (Faraway Citation2002). Prior to running the two-way ANOVA, assumptions of linear regression were checked. The Shapiro-Wilks test complemented with a normality plot of the residuals was used to determine if the data were from a normal distribution. The Levene test complemented with residuals vs. fitted values plot was used to check for the assumption of equal variance in data.
While determining the main effect of soil on MWHCFFPD was not a goal, soil type was added to the model as an independent variable since the main effect of sensitivity test may be dependent on soil type. If there was a statistically significant main effect of sensitivity treatments on MWHCFFPD, then means differences were taken across both soils using Tukey HSD (Tukey Honest Significant Difference, R function: TukeyHSD). If there was a significant sensitivity-treatment × soil interaction on MWHCFFPD then sensitivity test means differences were conducted within Soil A and Soil G. An alpha value of 0.05 was used for all statistical comparisons.
Results
Soil water retention curves using PC and range in WHCPC values
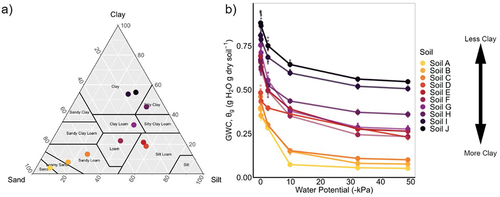
Our wide range of soil textures (and organic matter content) translated into a similarly wide range in water retention dynamics (, ). Across the soils, MWHCPC (or PC at 0 kPa) ranged in gravimetric water content (θg) from 0.36 to 0.95 g H2O g dry soil−1. Generally, as expected, soils with greater clay content held more water across all measured water potentials (−49 to 0 kPa). With every 1% increase in clay content, soils held 0.01 g H2O more water according to linear regression between clay content and θg at −2.45 kPa (slope = 0.009, y-intercept = 0.248, and R2 = 0.91).
Figure 1. a) soil textures used in this study within the texture triangle, and b) water retention curves measured via pressure cell and showing gravimetric water content (GWC, θg) between saturation (0 kPa) and − 49 kPa. Means are shown with large circles and individual, replicate measurements in smaller circles (n = 6). See for more on soil properties.
Comparing MWHCFFPD and WHCPC methods
The MWHCFFPD and WHCPC methods are quite closely related at water potentials greater than what is considered field capacity (or ~ −10 kPa), with R2 ranging from 0.92 to 0.98 across 0 to −9.98 kPa (). The MWHCFFPD best correlated with WHCPC at −2.45 kPa (, ). Comparing the mean difference in WHC between methods at this water potential, the MWHCFFPD ranged from a 2.7% to 27.4% overestimation compared to WHCPC, and an overall mean ± standard deviation of 12.0 ± 7.4% ().
Figure 2. Comparison between maximum water holding capacity via funnel, filter-paper, and 6 h drainage (MHWCFFPD) and water desorption method via pressure cells (WHCPC). Both measurements are expressed in gravimetric water content (θg). a) linear regression between MHWCFFPD and WHCPC at − 2.45 kPa. b) coefficients of variation (CV) for both WHCPC at − 2.45 kPa and MHWCFFPD methods. For means, standard deviation, and CV there are n = 6 replicates.
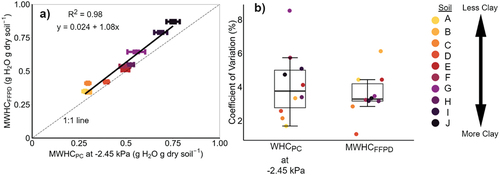
Table 3. % differences in θg between FFPD method and PC’s from 0 to − 9.81 kPa.
Method precision or repeatability is often measured as variance. Therefore, we used CV as a metric to compare precision between the MWHCFFPD and WHCPC at the best-correlated water potential (−2.45 kPa). Across all 10 soils, the CVs of the two methods are quite comparable with ranges of MWHCFFPD and WHCPC between 1.2–6.1% and 1.7–8.5%, respectively. The mean ± standard deviation of CVs for both methods are 3.5 ± 1.3% and 4.1 ± 2.0% for MWHCFFPD and WHCPC at −2.45 kPa, and not statistically different (p = .44).
Sensitivity of the MWHCFFPD method to various modifications
The drainage time only had a significant main effect (p < .001; ). Conducting the measurement for only 3 h resulted in the greatest mean MWHCFFPD (), 0.34 and 0.67 g H2O g dry soil−1 for Soil A and Soil G, respectively. Allowing drainage for 6 h reduced MWHCFFPD for Soil A and Soil G by 5.9% and 4.5%, respectively, and allowing drainage for 24 h reduced MWHCFFPD by 14.7 and 7.5%, respectively, compared to 3 h of drainage on average across the soils. There was no significant difference between drainage values after 6 h and 24 h.
Figure 3. Method sensitivity tests for funnel, filter-paper, and drainage method for gravimetric water content at maximum water holding capacity (MHWCFFPD). Sensitivity tests include: a) drainage time at 3-, 6-, and 24-hours; b) funnel covering types including no-cover, plastic cap, and plastic wrap; c) the filter paper type including: laboratory Whatman #1 filter paper and two coffee filter brands; d) source of saturating water: deionized (DI), tap water, bottled spring water, and 0.01 M CaCl water. Means with standard deviation deviations shown (n = 4). See for more details.
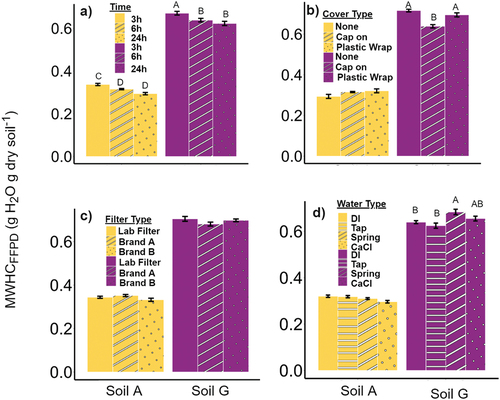
Unlike drainage time, with coverings, there was a significant Soil × Treatment interaction on MWHCFFPD (p < .001; ). Only in Soil G, the clay loam, did coverings have a significant effect, and contrary to what we expected. Using a hard plastic cap covering, but surprisingly not plastic wrap, decreased MWHCFFPD by 12.2% compared to no covering.
The filter paper types had only a weak interactive effect (p = .044; , ). However, when using the Tukey HSD tests, we found no significant difference among filter papers on MWHCFFPD in Soil A nor Soil G. Regardless, the largest relative difference within a soil (Soil G) was only 1% between Whatman filters (laboratory standard) and the Great ValueTM, mostly within measurement error.
Table 4. ANOVA for sensitivity tests on the funnel, filter-paper, and drainage method (FFPD) – accompanies .
Changing the water source only affected the MWHCFFPD in Soil G, or a significant Soil × Treatment interaction (p < .001; ). In Soil G, MWHCFFPD using bottled spring water was significantly greater than DI and tap water by 9.5% and 6.9%, respectively. There was no effect of water source on Soil A.
Discussion
The MWHCFFPD method relates well to standard laboratory methods (i.e., pressure cell) and is not any more variable
Confirming H1, the MWHCFFPD and WHCPC methods are very closely related (, ). We also confirmed H2 that the MWHCFFPD would correlate best with water potentials greater than field capacity (). In our case, the method best correlated with WHCPC at −2.45 kPa (, ).
In a recent study, Govindasamy et al. (Citation2022) compared several WHC methods, some of which were more accessible methods, to water desorption via ceramic pressure plate (WHCPP) at −33 kPa with two <2 mm-sieved soils (clay loam and sandy clay loam). The WHC methods the authors compared were: the funnel method, most similar to MWHCFFPD (Bernard Citation1963; Govindasamy et al. Citation2022), the Keen Raczkowski box method (Keen and Raczkowski Citation1921), a do-it-yourself (DIY) column method similar to Bernard (Citation1963), and the FAO-endorsed, in situ method (Motsara and Roy Citation2008). Based on their results, the FAO-endorsed, in-situ method was most similar to WHCPP, and also the lowest θg, across both soils, 0.24 and 0.15 g H2O g dry soil−1 for the clay loam and sandy clay loam, respectively (Govindasamy et al. Citation2022). Regardless of how comparable WHC is between the FAO and pressure plate methods, the FAO method is quite laborious (Motsara and Roy Citation2008). It involves selecting and preparing a uniform 5 × 5 m plot, removing all weeds and pebbles, creating bunds around the plot, and completely saturating the soil with water. The plot is then covered with a polyethylene sheet to prevent evaporation and soil samples are taken daily from the center of the plot until the moisture content stabilizes. This procedure requires numerous steps, constant monitoring, and a significant amount of manual work.
It is important to note that any laboratory measure of WHC – whether via MWHCFFPD, WHCPC, or other methods – is operationally defined and subject to experimental artifacts. In our case, the MWHCFFPD method is primarily isolating differences in soil texture, soil organic matter, and other meso-to-micro structural differences at <2 mm. Therefore, any laboratory-based “containerized” tests should be considered in this context. When measuring WHC in the lab with sieved and repacked soil cores, what we may be measuring is closer to what is known as “container capacity” (Cassel and Nielsen Citation1986; White and Mastalerz Citation1966). Due to this experimental artifact, we would expect greater θg values measured in the laboratory compared to field-based methods – whether using MWHCFFPD or WHCPC – because these laboratory-based, repacked cores remove macropores and macro-structure that allow for rapid water drainage (Dane and Hopmans Citation2002). Furthermore, standard WHC measurements in the field are also influenced by shallow water tables that can influence the water retained at more surface soils.
Method precision is important for both professional and citizen scientists alike. Confirming H3, we found no difference in precision between the MWHCFFPD and WHCPC at −2.45 kPa methods (, p = .44). A general, universally agreed upon range for laboratory methods is 1% to 5% and both methods fell within this range (MWHCFFPD = 3.5% and WHCPC at −2.45 kPa = 4.1%). Govindasamy et al. (Citation2022) found similar precision with their funnel method on the clay loam (CV = 6.4%), but much larger variation when measuring the sandy clay (CV = 19.1%). There is no agreed-upon, acceptable value for CV, as it is context-dependent, but a lower CV is more precise. A large regional study in North America with over 100 soils showed a range from 3% to 20% for repacked soil cores measuring WHC at −10 kPa using porous ceramic pressure plates in pressure chambers (Bagnall et al. Citation2022) – a method most similar to our WHCPC measurement ().
The MWHCFFPD method was mostly insensitive to methodological variations
To be more broadly adopted, a DIY method like MWHCFFPD should allow some flexibility in slight measurement variations and be consistent enough to synthesize data across many diverse soils. We chose to test the sensitivity of MWHCFFPD to methodological variations in sand (Soil A) and clay loam (Soil G) soils. Overall, the sandy soil was less sensitive to variations in methods; however, the clay loam was slightly more sensitive and in unexpected ways (, ).
The water held by a soil will be dependent on the time it is allowed to drain and thus very important to MWHCFFPD measurement. To make the measurement more accessible, however, the MWHCFFPD method drainage time needs to be considered from both a convenience aspect and a physical process. We expected that increasing drainage time would result in more drainage, resulting in lower θg at MWHCFFPD; and this effect would be consistent across both soils (i.e., only a main effect and no interaction with soil). Therefore, we recommend citizen scientists use 6 h for the MWHCFFPD method because it is short enough to measure within 24 h but has sufficient drainage, so the measurement is no different from leaving overnight ().
We were cognizant of evaporation being an issue due to humidity. The MWHCFFPD method may be carried out in a variety of locations including: laboratory, air-conditioned office, farm shed, or outdoors. Therefore, we wanted to test if using a covering to prevent evaporation would change MWHCFFPD. We presumed keeping the cap on helps keep the humidity inside the funnel close to 100% to be consistent with the most similarly described method in Robertson et al. (Citation1999). The method of covering the wet soil, filter paper, and funnel did not have any effect on sand but did slightly affect clay loam MWHCFFPD. For some reason, a loosely placed hard plastic cap covering the soil decreased MWHCFFPD by 12.2% (), but the plastic wrap had no effect. Although we do not have a good explanation for this we recommend not using any covering at all but especially avoid a hard plastic cap.
We were concerned that citizen scientists may not have access to, nor resources for, more specialized and expensive filters like Whatman #1 used by the professional soil science community. Therefore, we wanted to test widely available, affordable alternatives to laboratory filter paper; that is two brands of coffee filters available at local retail stores. Filter type had no effect on MWHCFFPD (). Therefore, we recommend using any filter that is available to citizen scientists – which will most likely be a coffee filter since it is nearly 40× less expensive than Whatman #1 filters (). We have added instructions for making the coffee filters more easily fit into funnels (Fig. S1).
The source of water used for soil saturation will impact dispersion and flocculation of soil particles – mostly due to ions dissolved in that water source. In commercial labs, DI water is the standard for the MWHCFFPD method. This, however, is not a readily available water source for most citizen scientists. Knowing the water source will vary depending on citizen scientists’ access, we chose some of the most common sources of water to the public. We used 0.01 M CaCl2 dissolved in DI water to represent well water sources that may have dissolved minerals present, common tap water, and bottled water available at retail outlets (). The best alternative water sources to DI water, or those with the least difference for Soil G, were CaCl2 and tap water, with differences from Whatman #1 of 2.5 and −2.4% respectively). This is appealing for citizen scientists, as they could use tap water or well water that might have the same ionic strength as 0.01 M CaCl2, both more inexpensive than the spring bottled water, with reliable results that are similar to DI water. Even though the water source did affect MWHCFFPD results in the clay loam soil, the magnitude is still small and illustrates the importance of being consistent if done by citizen scientists comparing across management practices in clayey soils.
Further considerations and recommendations for the DIY MWHCFFPD method
We have two recommended methods in the Supplemental Materials – one for professional (Appendix 2) and one for citizen scientists (Appendix 3) – that according to our sensitivity tests should be comparable. The largest recurring cost and hardest to find material for the professional laboratory MWHCFFPD method was the Whatman #1 filter papers and DI water. At $0.23 USD per filter and $1.28 USD worth of DI water per sample, this could add up quickly considering replicates and number of samples. The cost for the funnels, funnel holder stand, balance, and oven or microwave oven are also fixed, one-time investments, but most citizen scientists might have at least some of these materials. The setup cost for the citizen scientists in 2023 USDs is $174 and for a professional lab is $8,144. In terms of time and ease of setup, the MWHCFFPD can be set up, completed, and analyzed in one and a half days in comparison with WHCPC at −2.45 kPa method, which required three days. The cost and space for WHCPC is also significantly more with equipment costs exceeding $20,000 and several dozens of m2 of space. Additionally, the MWHCFFPD method is safe and can be run by anyone with basic training.
The simplicity and affordability of the MWHCFFPD method make it conducive for expanding and enhanced monitoring of changes in SOM and/or in meso- and micro-structure due to management practices similar to other nation-wide citizen science projects (Brooks et al. Citation2019; Duddigan et al. Citation2020; Pino et al. Citation2022). Soil management practices like restoring grasslands (De et al. Citation2020), converting to no-tillage (Jemai et al. Citation2013), adding animal manure (Schjꬾnning, Christensen, and Carstensen Citation1994), and using cover crops (Basche et al. Citation2016) are all known to increase WHC. For example, De et al. (Citation2020), using the same MWHCFFPD method outlined in this study, showed that native grassland soils held 19.9% more water than cropland (0.70 vs. 0.58 g H2O g dry soil−1). The MWHCFFPD method may also be sensitive enough to monitor changes in soil structure and/or SOM after converting to perennial crops like Giant miscanthus (Miscanthus × giganteus Greef et Deu.; Studt et al. Citation2021) or intermediate wheatgrass (kernza; Culman et al. Citation2013).
Any increases in MWHCFFPD are likely from management-induced change in soil micro-structure or increases in soil organic matter. While macroaggregates (>0.25 mm) can protect a small fraction of soil organic C from mineralization, occlusion of C is likely to be more significant within microaggregates (<0.25 mm) (Pulleman and Marinissen Citation2004). With soils sieved to <2 mm, larger macroaggregates will be destroyed, although micro- and meso-aggregates are left intact and reflect the structure measured with MWHCFFPD method. The MWHCFFPD method, and other DIY soil health tests, not only expand measurement of a critical soil ecosystem service but also can function as an educational tool and have positive feedbacks to land manager adoption (Cooper et al. Citation2007; Dickinson et al. Citation2012).
Conclusions
Accessible measurements for water holding capacity are needed to expand soil health monitoring in response to rising interest in implementing and verifying agricultural practices that conserve soil health. We compared one accessible, do-it-yourself method for measuring the water holding capacity (WHC) of soil – simply using a funnel and filter paper (and a few other readily available materials) – to a soil science standard (water desorption method via the pressure cell). We found the MWHCFFPD method compared very well to the WHC at −2.45 kPa measured with pressure cells (, R2 = 0.98, H1 and H2). The MWHCFFPD method precision is also comparable to the water desorption method using PCs and within acceptable CV ranges (H3).
The MWHCFFPD method is sensitive to some method modifications (), and we provide recommendations for standard methods for researchers, commercial laboratories, and citizen scientists. These recommendations will allow greater comparability across soils and practitioners. Like many scientific endeavors ‒ consistency is key. Even if researchers, commercial laboratories, or citizen scientists do not all follow our exact recommendations, consistency in their soils’ measurements is most important. The MWHCFFPD method meets scientific rigor, but ease and inexpensiveness make it a prime way to expand monitoring one measure of soil health (e.g., the ability of soil to store water), which is a function of management-sensitive properties like meso- to micro-changes in soil structure and/or organic matter content.
Abbreviations
| CV | = | coefficient of variation |
| DI | = | deionized |
| DIY | = | do it yourself |
| E.C. | = | electrical conductivity |
| FFPD | = | funnel filter paper drainage |
| MWHC | = | maximum water holding capacity |
| PC | = | pressure cell |
| SWRC | = | soil water retention curve |
| WHC | = | water holding capacity |
Author contributions
Jessica Nelson: Conceptualization; investigation; methodology; formal analysis; writing – original draft; writing – review and editing. Toby Adjuik: Conceptualization; methodology; visualization; statistical analysis; writing – original draft; writing – review and editing. E. Britt Moore: Conceptualization; methodology; writing – review and editing. Andy VanLoocke: Conceptualization; funding acquisition; investigation; methodology; project; administration; resources; supervision; writing – original draft; writing – review and editing. Alam Ramirez Reyes: Methodology; writing – original draft; writing – review and editing. Marshall McDaniel: Conceptualization; funding acquisition; investigation; methodology; project; administration; resources; supervision; writing – original draft; writing – review and editing.
Supplemental Material
Download MS Word (587.6 KB)Acknowledgements
This work was funded by the DOE Center for Advanced Bioenergy and Bioproducts Innovation (U.S. Department of Energy, Office of Science, Office of Biological and Environmental Research under Award Number DE-SC0018420); which supported 2022 J. T. Nelson laboratory work. This work is supported by the USDA National Institute of Food and Agriculture, Hatch Multistate project 7000755. Any opinions, findings, and conclusions or recommendations expressed in this publication are those of the author(s) and do not necessarily reflect the views of the U.S. Department of Energy. We thank Stephen Potter for help with laboratory work and Dr. Robert Horton for concept and editing early drafts of the manuscript. We thank Amber Anderson and Stephen Potter for supplying soil samples for this study. In addition, we thank Cole Dutter, Stephen Potter, and Bryan Petersen for their contributions to data visualizations.
Disclosure statement
No potential conflict of interest was reported by the author(s).
Data availability statement
Published data will be made available at Iowa State University’s Digital Repository using best-management practices for making the data clearly and easily available at https://open.lib.iastate.edu/open-access/digital-repository (under the DOI: 10.25380/iastate.24898005) .
Supplemental material
Supplemental data for this article can be accessed online at https://doi.org/10.1080/00103624.2023.2296988
Correction Statement
This article has been republished with minor changes. These changes do not impact the academic content of the article.
Additional information
Funding
References
- Ankeny, M. D., H. J. Brown, and R. M. Cruse 1992. Means and method of soil water desorption (Patent No. 5,161,407).
- Bagnall, D. K., C. L. S. Morgan, G. M. Bean, D. Liptzin, S. B. Cappellazzi, M. Cope, K. L. H. Greub, E. L. Rieke, C. E. Norris, P. W. Tracy, et al. 2022. Selecting soil hydraulic properties as indicators of soil health: Measurement response to management and site characteristics. Soil Science Society of America Journal 86 (5):1206–26. doi:10.1002/SAJ2.20428.
- Basche, A. D., T. C. Kaspar, S. V. Archontoulis, D. B. Jaynes, T. J. Sauer, T. B. Parkin, and F. E. Miguez. 2016. Soil water improvements with the long-term use of a winter rye cover crop. Agricultural Water Management 172:40–50. doi:10.1016/J.AGWAT.2016.04.006.
- Bernard, J. M. 1963. Forest floor moisture capacity of the New Jersey Pine Barrens. Ecology 44 (3):574–76. doi:10.2307/1932538.
- Brooks, S. J., B. Fitch, J. Davy-Bowker, and S. A. Codesal. 2019. Anglers’ riverfly monitoring initiative (ARMI): A UK-wide citizen science project for water quality assessment. Freshwater Science 38 (2):270–280. doi:10.1086/703397.
- Cassel, D. K., and D. R. Nielsen. 1986. Field capacity and available water capacity. Methods of Soil Analysis, Part 1: Physical and Mineralogical Methods 901–26. doi:10.2136/SSSABOOKSER5.1.2ED.C36.
- Chenu, C. January 1995. (PDF) extracellular polysaccharides: An interface between microorganisms and soil constituents. Environmental Impact of Soil Component Interactions. https://www.researchgate.net/publication/225284503_Extracellular_Polysaccharides_An_interface_Between_Microorganisms_and_Soil_Constituents.
- Cooper, C. B., J. Dickinson, T. Phillips, and R. Bonney. 2007. Citizen science as a tool for conservation in residential ecosystems. Ecology and Society 12:2. doi: 10.5751/ES-02197-120211
- Culman, S. W., S. S. Snapp, M. Ollenburger, B. Basso, and L. R. DeHaan. 2013. Soil and water quality rapidly responds to the perennial grain kernza wheatgrass. Agronomy Journal 105 (3):735–44. doi:10.2134/AGRONJ2012.0273.
- Dane, J. H., and J. W. Hopmans. 2002. Chapter 3: The Soil Solution Phase – 3.3. Water Retention and Storage. In Methods of Soil Analysis: Part 4 Physical Methods, ed. J. H. Dane and G. C. Topp, 671–795. Madison, Wisconsin, USA: Soil Science Society of America, Inc.
- De, M., J. A. Riopel, L. J. Cihacek, M. Lawrinenko, R. Baldwin-Kordick, S. J. Hall, and M. D. McDaniel. 2020. Soil health recovery after grassland reestablishment on cropland: The effects of time and topographic position. Soil Science Society of America Journal 84 (2):568–86. doi:10.1002/SAJ2.20007.
- Dickinson, J. L., J. Shirk, D. Bonter, R. Bonney, R. L. Crain, J. Martin, T. Phillips, and K. Purcell. 2012. The current state of citizen science as a tool for ecological research and public engagement. Frontiers in Ecology and the Environment 10 (6):291–97. doi:10.1890/110236.
- Doran, J. W. 2002. Soil health and global sustainability: Translating science into practice. Agriculture, Ecosystems & Environment 88 (2):119–27. doi:10.1016/S0167-8809(01)00246-8.
- Doran, J. W., M. Sarrantonio, and M. A. Liebig. 1996. Soil health and sustainability. Advances in Agronomy 56 (C):1–54. doi:10.1016/S0065-2113(08)60178-9.
- Duddigan, S., P. D. Alexander, L. J. Shaw, T. Sandén, and C. D. Collins. 2020. The Tea Bag Index—UK: Using citizen/community science to investigate organic matter decomposition rates in domestic gardens. Sustainability 12 (17):6895. doi:10.3390/su12176895.
- Faraway, J. J. 2002. Practical Regression and Anova Using R. www.r-project.org.
- Gardner, W. H. 1986. Water content. In Methods of soil analysis: Part 1 physical and mineralogical Methods: Vol. 5.1, Second. ed. A. Klute, 493–544. Madison, WI, USA: Soil Science Society of America, Inc.
- Gee, G. W., and M. E. Dodson. 1981. Soil water content by microwave drying: A routing procedure. Soil Science Society of America Journal 45 (6):1234–37. doi:10.2136/SSSAJ1981.03615995004500060045X.
- Govindasamy, P., S. K. Mahawer, J. Mowrer, M. Bagavathiannan, M. Prasad, S. Ramakrishnan, H. M. Halli, S. Kumar, and A. Chandra. 2022. Comparison of low-cost methods for soil water holding capacity. Communications in Soil Science and Plant Analysis 54 (2):287–96. doi:10.1080/00103624.2022.2112216.
- Hernando, S., M. C. Lobo, and A. Polo. 1989. Effect of the application of a municipal refuse compost on the physical and chemical properties of a soil. Science of the Total Environment 81–82 (C):589–96. doi:10.1016/0048-9697(89)90167-8.
- Hudson, B. D. 1994. Soil organic matter and available water capacity. Journal of Soil and Water Conservation 49 (2):189–95. https://go.gale.com/ps/i.do?p=AONE&sw=w&issn=00224561&v=2.1&it=r&id=GALE%7CA15406381&sid=googleScholar&linkaccess=fulltext.
- Jemai, I., N. Ben Aissa, S. Ben Guirat, M. Ben-Hammouda, and T. Gallali. 2013. Impact of three and seven years of no-tillage on the soil water storage, in the plant root zone, under a dry subhumid Tunisian climate. Soil and Tillage Research 126:26–33. doi:10.1016/J.STILL.2012.07.008.
- Karlen, D. L., M. De, M. D. McDaniel, and D. E. Stott. 2021. Evolution of the soil health movement. Approaches to Soil Health Analysis 1:21–48. doi:10.1002/9780891189817.CH2.
- Keen, B. A., and H. Raczkowski. 1921. The relation between the clay content and certain physical properties of a soil. The Journal of Agricultural Science 11 (4):441–49. doi:10.1017/S0021859600004469.
- Klute, A. 2018. Water retention: Laboratory methods. Methods of Soil Analysis, Part 1: Physical and Mineralogical Methods 635–62. doi:10.2136/SSSABOOKSER5.1.2ED.C26.
- Kool, D., B. Tong, Z. Tian, J. L. Heitman, T. J. Sauer, and R. Horton. 2019. Soil water retention and hydraulic conductivity dynamics following tillage. Soil and Tillage Research 193:95–100. doi:10.1016/J.STILL.2019.05.020.
- Koszinski, S., B. A. Miller, W. Hierold, H. Haelbich, and M. Sommer. 2015. Spatial modeling of organic carbon in degraded peatland soils of Northeast Germany. Soil Science Society of America Journal 79 (5):1496–508. doi:10.2136/SSSAJ2015.01.0019.
- Lal, R. 1978. Physical properties and moisture retention characteristics of some nigerian soils. Geoderma 21 (3):209–23. doi:10.1016/0016-7061(78)90028-9.
- Lal, R. 2015. World water resources and achieving water security. Agronomy Journal 107 (4):1526–32. doi:10.2134/AGRONJ15.0045.
- Lane, C. R., and E. D’Amico. 2010. Calculating the ecosystem service of water storage in isolated wetlands using LiDAR in North Central Florida, USA. Wetlands 30 (5):967–977. doi:10.1007/s13157-010-0085-z.
- Miller, B. A., and R. J. Schaetzl. 2012. Precision of soil particle size analysis using laser diffractometry. Soil Science Society of America Journal 76 (5):1719–27. doi:10.2136/SSSAJ2011.0303.
- Motsara, M. R., and R. N. Roy 2008. Guide to Laboratory Establishment for Plant Nutrient Analysis. http://www.fao.org
- Panagea, I. S., A. Berti, P. Čermak, J. Diels, A. Elsen, H. Kusá, I. Piccoli, J. Poesen, C. Stoate, M. Tits, et al. 2021. Soil water retention as affected by management induced changes of soil organic carbon: Analysis of long-term experiments in europe. Land 10 (12):1362. doi:10.3390/land10121362.
- Pino, V., A. McBratney, E. O’Brien, K. Singh, and L. Pozza. 2022. Citizen science & soil connectivity: Where are we? Soil Security 9:100073. doi:10.1016/J.SOISEC.2022.100073.
- Pulleman, M., and J. Marinissen. 2004. Physical protection of mineralizable C in aggregates from long-term pasture and arable soil. Geoderma 120 (3–4):273–282. doi:10.1016/j.geoderma.2003.09.009.
- R Core Team, R. 2013. R: A language and environment for statistical computing.
- Ribaudo, M., C. Greene, L. R. Hansen, and D. Hellerstein. 2010. Ecosystem services from agriculture: Steps for expanding markets. Ecological Economics 69 (11):2085–92. doi:10.1016/J.ECOLECON.2010.02.004.
- Rillig, M. C. 2004. Arbuscular mycorrhizae, glomalin, and soil aggregation. Canadian Journal of Soil Science 84 (4):355–63. doi:10.4141/S04-003.
- Robertson, G. P., D. C. Coleman, C. S. Bledsoe, and P. Sollins. 1999. Standard soil methods for long term ecological research. New York, NY: Oxford University Press.
- Salter, P. J., and J. B. Williams. 1965. The influence of texture on the moisture characteristics of soils. Journal of Soil Science 16 (2):310–17. doi:10.1111/J.1365-2389.1965.TB01442.X.
- Schindler, U., W. Durner, G. von Unold, L. Mueller, and R. Wieland. 2010. The evaporation method: Extending the measurement range of soil hydraulic properties using the air-entry pressure of the ceramic cup. Journal of Plant Nutrition and Soil Science 173 (4):563–72. doi:10.1002/JPLN.200900201.
- Schindler, U., W. Durner, G. von Unold, and L. Müller. 2010. Evaporation method for measuring unsaturated hydraulic properties of soils: Extending the measurement range. Soil Science Society of America Journal 74 (4):1071–83. doi:10.2136/SSSAJ2008.0358.
- Schjønning, P., B. T. Christensen, and B. Carstensen. 1994. Physical and chemical properties of a sandy loam receiving animal manure, mineral fertilizer or no fertilizer for 90 years. European Journal of Soil Science 45 (3):257–68. doi:10.1111/J.1365-2389.1994.TB00508.X.
- Studt, J. E., 2019. Contrasting soil nitrogen dynamics under Zea Mays and miscanthus × Giganteus: A story of complex interactions among site, establishment year, and nitrogen fertilization. Order No. 22583655 ed. United States – Iowa: Iowa State University Dissertations & Theses @ Iowa State University. ISBN 9781088341964.
- Studt, J. E., M. D. McDaniel, M. D. Tejera, A. VanLoocke, A. Howe, and E. A. Heaton. 2021. Soil net nitrogen mineralization and leaching under miscanthus × giganteus and Zea mays. GCB Bioenergy 13 (9):1545–60. doi:10.1111/GCBB.12875.
- Unger, P. W. 1975. Water retention by Core and sieved soil samples. Soil Science Society of America Journal 39 (6):1197–200. doi:10.2136/SSSAJ1975.03615995003900060043X.
- Verheijen, F., A. Zhuravel, F. Silva, A. Amaro, M. Ben-Hur, and J. Keizer. 2019. The influence of biochar particle size and concentration on bulk density and maximum water holding capacity of sandy vs sandy loam soil in a column experiment. Geoderma 347:194–202. doi:10.1016/J.GEODERMA.2019.03.044.
- White, J. W., and J. W. Mastalerz 1966. Soil moisture as related to container capacity. Proceedings of the American Society for Horticultural Science, Alexandria, VA, USA, 758–65.
- Wong, C. P., B. Jiang, A. P. Kinzig, K. N. Lee, Z. Ouyang, and J. Knops. 2015. Linking ecosystem characteristics to final ecosystem services for public policy. Ecology Letters 18 (1):108–118. doi:10.1111/ele.12389.