
ABSTRACT
Selenium (Se) is an essential microelement in living organisms, and has a beneficial effect on plant growth and stress tolerance at low concentrations. Se biofortification is commonly practiced in agriculture and is considered the best method for increasing human Se uptake. This study aimed to investigate the effects of Se fertilizer application on Se accumulation and microbial communities in the rhizospheric soil of tomato plants. A pot experiment with five treatments, i.e. (a) non-Se fertilizer as control (Ck) and Se fertilizer in the form of (b) sodium selenite (1 mg kg−1), (c) sodium selenite (5 mg kg−1), (d) sodium selenate (1 mg kg−1), and (e) sodium selenate (5 mg kg−1) was set up. The results showed that Se content in the tomato plants’ parts gradually increased with an increasing concentration of sodium selenate or selenite. Sodium selenate significantly increased tomato yield and improved Se accumulation in tomato plants. Se-treated treatments decreased the abundance of soil microbial community, and had no effect on the Chao1 and Shannon indices of them. Furthermore, Se application increased the relative abundance of Acidobacteriota and Actinobacteriota involved in the decomposition of organic matter, reducing Bacteriodota and Ascomyta, and significantly affected the bacterial community structure. Thus, Se fertilizer application increased the crop yield, improved Se accumulation, and the structure and diversity of rhizospheric soil microbial community in the tomato plants. In line with our experiment, 5 mg kg−1 concentration selenate is a reasonable way to harvest Se-enriched tomatoes.
Introduction
Selenium (Se) is an essential microelement for the human body (Brown and Arthur Citation2001). Se deficiency results in low immunity, cardiovascular, and cerebrovascular diseases, and its accumulation increases the risks of various cancers (Kieliszek and Błażejak Citation2013; Rahman et al. Citation2018). According to a study, approximately 500–1,100 million people worldwide have Se deficiency (Wang et al. Citation2017), and more than 50% of China’s population suffers from Se deficiency (Dinh et al. Citation2018). Daily food consumption is the primary route for human Se intake while for many people worldwide, plants are the main source of Se intake, and soil is the primary source of Se absorbed by plants. Se in the soil exists as selenate, selenite, or organic Se compounds, such as selenomethionine and selenocysteine (Bitterli, Bañuelos, and Schulin Citation2010; Renkema et al. Citation2011). Studies have shown that the transport mechanism of different valence Se is different in plants. Selenate is mainly absorbed by plants through active transportion. It is first converted into selenite, then into organic Se, and then transported to other plant organs. However, most selenite is converted to Se(Ⅵ), SeCys, SeMet and other forms of Se compounds in the plant roots, and then selenate and a small portion of selenides are transported to the plant leaves, where selenate is converted to selenite, then into organic Se, and finally transported to different organs of plant (Cui et al. Citation2018; Jiang et al. Citation2016; Wang, Huang, and Pang Citation2021). Compared with inorganic selenium, organic Se is easier to be absorbed by the human body, and can be quickly used, effectively improving the Se metabolism of the human body. However, inorganic selenium such as selenate is absorbed by the human body by passive transportation, with limited absorption rate, and is easy to be combined with various factors in the human body, with low bioavailability. Therefore, it is an important way to improve the absorption of Se in the human body through the transformation of Se in plant, that is Se biofortification (Sarwar et al. Citation2020).
Se biofortification is commonly practiced in agriculture to improve the Se content of crops that are cultivated in the soil with low Se content or with low bioavailability of Se, which is common in China and worldwide (Ros et al. Citation2016; White and Broadley Citation2009; Wu et al. Citation2015). The application of Se fertilizer (selenate or selenite) in the soil is the primary measure to add exogenous Se via Se biofortification. An appropriate amount of Se in the soil promotes plant growth and enhances antioxidant and stress resistance in plants, while a high Se concentration inhibits plant growth (Lin et al. Citation2012; Pilon-Smits et al. Citation2009; Qing et al. Citation2015). Se amendment to the soil significantly increases the Se content of crops, crop yield, enzymatic activity of the soil, and the contents of soil nutrients, including available N, available K and organic matter (Lara et al. Citation2019; Li et al. Citation2021).
Soil microbiota is a vital component of soil ecology and plays an important role in soil nutrient cycling, decomposition of organic matter, and plant growth (Lange et al. Citation2015; Leff et al. Citation2015). Previous studies have shown that the rhizospheric microbes in the plants significantly affect the bioavailability of mineral elements in the soil-plant system, including the bioavailability of Se in the soil and the uptake of Se by plants creating a healthy rhizospheric environment for plant growth (Dungan, Yates, and Jr Citation2003; Mendes et al. Citation2011; Nacke et al. Citation2011). The structure, diversity, and function of the microbial community are interrelated. Factors that affect the structure and diversity of rhizospheric soil microbial community also affect the community function and plant growth (Bakker et al. Citation2015; Shen et al. Citation2010). Previous studies on Se and micro-ecology showed that the soil microbial communities are closely related to Se content and low Se concentration stimulates, while high Se concentration inhibits the growth of soil microorganisms (Fan et al. Citation2015; Liu et al. Citation2019). An appropriate level of Se in the soil directly or indirectly inhibits the growth of pathogenic microorganisms, such as Phanerochaete chrysosporium and Penicillium expansum (Wu et al. Citation2014). In addition, Se can significantly alter the community structure and diversity of soil microbes. Besides, microbial community responds differently to different valences of Se (Lei et al. Citation2011).
As shown in a previous study, sodium Se significantly affected the bacterial community structure of the rhizospheric rape soil, but it did not affect the fungal community (Cheng et al. Citation2020). However, the previous studies were mostly focused on the uptake and utilization of selenate or selenite by plants and their transformation in plants. Till now, only a few studies have explored the effects of selenate or selenite application on the structure and diversity of rhizospheric microbial communities. Tomato (Solanum lycopersicum L.) is considered to be the second most important cultivated horticultural crop worldwide (Akhtar et al. Citation2016). Besides, tomato is highly nutritious with high medicinal value. Thus, Se-enriched tomato cultivation is of high significance.
This study aimed (a) evaluate the effects of plant height, biomass, yield of tomato plant, and Se accumulation to different Se fertilizer application and (b) investigate the responses of Se fertilizer application on the structure and diversity of rhizospheric soil bacteria and fungi in tomato plants. This study’s findings will help better understand the relationship between Se application and soil microbial community. Besides, this study’s data will help establish an effective Se biofortification mode.
Materials and methods
Material and pot experiments
The tomato seedling (Solanum lycopersicum L.) of “Samsusng 908” used in this study is a local variety. The soil used in the pot experiment was collected from a depth of 0–20 cm from the agricultural fields of Enshi Academy of Agricultural Sciences, Hubei province, China. The soil samples were dried naturally and then passed through 2 mm sieve. The pH of collected soil samples was found to be neutral (pH = 6.91). These soil samples contained 0.29 mg kg−1 of total Se concentration, 16.91 g kg−1 organic carbon, 4.94 g kg−1 total nitrogen, 44.1 mg kg−1 alkali-hydrolyzable nitrogen, 49.56 mg kg−1 available phosphorus, and 207.0 mg kg−1 available potassium. Sodium selenite (Na2SeO3) (pure analysis, purity >98%) and sodium selenate (Na2SeO4) (pure analysis, purity >98%) were used as the Se fertilizer.
The pot experiment was conducted in the greenhouse of Enshi Academy of Agricultural Sciences from April 30 to September 9, 2021. Five treatment groups set-up were a) control (Ck), b) sodium selenite (Se1) at 1 mg kg−1, c) sodium selenite at 5 mg kg−1 (Se2), d) sodium selenate at 1 mg kg−1 (Se3), and e) sodium selenate at 5 mg kg−1 (Se4). Each treatment was prepared in three replicates. Chemical fertilizers, including 180 mg kg−1 nitrogen, 150 mg kg−1 phosphorus pentoxide, and 100 mg kg−1 potassium oxide, were mixed thoroughly with 10 kg (d. w.) soil, and then packed into plastic pots (31 cm inner diameter × 22 cm height, repeated for each pot). Phosphorus and potassium were applied once as basal fertilizer in the form of ammonium dihydrogen phosphate and potassium chloride, and nitrogen was applied three times in the form of ammonium dihydrogen phosphate and urea. A total of 40% of the fertilizer was applied as basal fertilizer, and 30% of the fertilizer was applied during the seedling and early flowering stages. Before transplanting tomato seedlings, sodium selenite and sodium selenate solution were applied to the soil, along with basal fertilizer. After balancing for 2 weeks, tomato seedlings that grew in advance were transplanted to resin pots. Each pot contained two plants. During the experiment, the tomato plants grew under natural light conditions, and the soil moisture was maintained at 60% of field capacity. Other management practices were as per the conventional systems.
Sample collection and processing
Soil and plant samples were collected 1 day before tomato fruit, i.e., September 9, 2021. Each plant was collected as root, stem, leaf, and fruit. For total Se content analysis, plant samples were cleaned with deionized water to remove soil or substrate particles, dried to constant weight, crushed with stainless steel high-speed grinder, and passed through a 0.25 mm sieve for total Se content analysis. Plant roots were carefully removed from the soil and transported to the laboratory at a low temperature. The roots were shaken vigorously to remove the loose soil; the remaining soil attached to the roots (rhizospheric soil) was collected using sterile brushes and immediately stored at −80°C for soil microbial analyses.
Sample analysis and calculations
Plant height, biomass, and yield were determined according to conventional methods (Li et al. Citation2021). The pH of the soil solution at a 1:2.5 (w/w) (soil: water) ratio was measured using a pH meter (Lu et al. Citation2012). The organic matter was determined using the wet digestion method and H2SO4-K2CrO7 (Bremner and Jenkinson Citation1960). The total nitrogen in the soil was quantified through the semi-micro-Kjeldahl digestion method using Se, CuSO4, and K2SO4 as catalysts (Bremner Citation1960). The available phosphorus and available potassium were determined using 0.5 mol·L−1 sodium bicarbonate and flame photometry method based on ammonium acetate extraction, respectively (Bao Citation2000). Plant samples were digested with HNO3: HClO4 (v/v) at a ratio of 3:2 in the digester reaction system. Then, the Se levels in the digestion solution were determined using atomic fluorescence spectroscopy (AFS) (Li et al. Citation2015).
Bioaccumulation factor (BCF) and translocation (TF) were used as reference indexes for evaluating the effect of Se fertilizaton on the absorption and translocation ability of Se in tomato plant (Chen et al. Citation2020).
The bioaccumulation factor of Se was calculated as follows:
BCF = Ci/C0 (1)
where BCF is the bioaccumulation factor of Se, Ci stands for Se content in organs of the tomato plant, and C0 stands for Se content of the soil.
The translocation factor of Se was calculated as follows:
TF = Ai/B0 (2)
where TF is the translocation factor of Se, Ai stands for Se content in stem/leaf/fruit of tomato plant, and B0 stands for Se content of root.
Soil DNA extraction and real-time PCR analysis
Soil DNA was extracted using the FastDNA® Spin Kit for the soil (MP, Biomedicals, USA). Around 0.5 g of fresh soil was sampled from each site according to the manufacturer’s instructions. The concentration and purity of DNA were determined using a NanoDrop 2000 spectrophotometer (Thermo, USA), and the extracted DNA was stored at −20°C. The 16S rRNA V4 region and ITS1 region of the extracted genomic DNA were amplified using the specific primers 338F (5’−ACTCCTACGGGAGGCAGCAG)/907 R (3’−GGACTACHVGGGTWTCTAAT) and ITS1F (5’−CTTGGTCATTTAGAGGAAGTAA)/ITS2R (3’−TGCGTTCTTCATCGATGC). Quantitative real-time PCR was carried out using a FAD-96A Real-Time System (Bioer, China) and SYBR green dye in a 20 μl reaction mixture containing 1 μl of template DNA (1–10 ng), 10 μl of 2×T5 FAST qPCR Mix, 0.8 μl of each primer (20 μmol μl−1), and 7.4 μl sterilized ultrapure water. The real-time polymerase-chain reaction conditions were set to 95°C for 1 min and then 40 cycles of 95°C for 15 s, 60°C for 15 s, 72°C for 30 s followed by a final extension at 72°C for 10 min. The melting curve analysis was performed to confirm the specificity of PCR products using fluorescence measurement continuously as the temperature increased from 50°C to 95°C by 0.5°C. The standard DNA templates for qPCR were generated using the plasmids containing 16s rRNA and ITS genes. The gene copy number was calculated based on the plasmid concentration and Avogadro’s constant. Besides, the standard curves were prepared using 10X gradient dilution for each template with the concentration range of 1.45 × 10⁵-1.45 × 10⁹ copies μl−1 to 9.97 × 10³-9.97 × 10⁷copies μl−1. Each sample contained three replicates, and the amplification efficiency of 16s rRNA and ITS genes was 89.3% (R2 = 0.999) and 106.3% (R2 = 0.998), respectively. No template sample was set as the negative control in each reaction round.
Sequencing analysis of soil DNA
Illumina Miseq PE250 was used for high-throughput sequencing analysis of the V3-V4 region of the 16S rRNA gene and ITS1 region of the ITS gene. The primers used for amplification were 338F/806 R and ITS1F/ITS2R, respectively. The database construction and sequencing work was entrusted to Allwegene Technology Co., Ltd. Fastq data adopt Trimmomatic (v0.36) was used for quality control. The pair-end clean reads were obtained after quality control. FLASH (v1.20) was used to splice pair-end data generated using MiSeq sequencing. The minimum overlap was set to 10 bp, the mismatch rate was 0.1, and the effective splicing fragment Clean Tags was obtained after filtering. QIIME platform (v1.8.0, http://qiime.org/) was used to cluster all Clean Tags, and the sequence was usually clustered into OTU at a similar level of 97%.
The alpha diversity indices of bacterial and fungal communities were performed using the QIIME platform (v1.8.0, http://qiime.org/). To compare the composition of microbial communities in different treatments, the relative abundance of bacterial and fungal communities at the phylum level and their Venn diagram were analyzed. The beta diversity analysis was carried out using the principal coordinate analysis to compare the differences between bacterial and fungal community structures among different treatments. All statistical analyses were conducted using SPSS software (version 18.0). Significant differences in the agronomic characters, Se concentration, bioaccumulation factors and translocation factors, and the copy numbers of each gene between treatments were determined by one-way analysis of variance (ANOVA) followed by Ducan’s test at the level p < 0.05.
Results
Changes in agronomic characters of tomato plants
The lowest plant height (135.00 ± 2.12 g plant−1), yield (107.71 ± 27.56 g plant−1) and biomass of tomato plants (31.42 ± 6.08 g plant−1) were observed in the control treatment among all treatment groups (). However, no difference was observed in the plant height between the control (Ck) and Se-fertilizer treatment groups. Compared with the control, the tomato yield was 29.4% and 38.3% significantly higher in the Se3 and Se4 treatment groups, respectively than in Ck, whereas it did not increase significantly in the treatment groups Se1 and Se2. The aboveground and underground biomass of tomato plants increased in the Se1, Se2, Se3, and Se4 treatment groups compared to the control; however, there was no difference. Besides, in the Se-fertilizer treatments, the aboveground biomass of plants in the Se3 and Se4 treatment groups was higher than in the Se1 and Se2 treatment groups. Thus, Se fertilizer application had no effect on the biomass and plant height of tomato plants, but tomato yield was significantly increased in plants treated with sodium selenate.
Figure 1. Effects of Se fertilizer application on the agronomic characters of tomato plants. Error bars refer to standard deviation values (n=3). The letters above the column indicate differences among treatments (p<0.05). Ck, control. Se1 and Se2 are sodium selenite at 1 mg kg−1 and 5 mg kg−1, respectively. Se3 and Se4 are sodium selenate at 1 mg kg−1 and 5 mg kg−1, respectively.
Changes in Se accumulation and transport in the tomato plants
In all the treatment groups, the order of Se content in different organs of tomato plants was in the following order: leaf > root > stem > fruit (). The control treatment showed the lowest Se content in all organs of plants among all treatments. Compared with the control, the Se content in all other organs of tomato plants increased in varying degrees after applying Se fertilizer, while that significantly increased by 80.6% to 95.5% in the Se4 treatment group. Besides, the Se content in the plants in Se4 treatment group was significant higher than in other Se-fertilizer treatment groups.
Figure 2. Effects of Se fertilizer application on the Se concentration of tomato plants. Error bars refer to standard deviation values (n=3). The letters above the column indicate differences among treatments (p<0.05). Ck, control. Se1 and Se2 are sodium selenite at 1 mg kg−1 and 5 mg kg−1, respectively. Se3 and Se4 are sodium selenate at 1 mg kg−1 and 5 mg kg−1, respectively.
Bioaccumulation factor (BCF) could represent tomato plants’ ability to absorb and accumulate Se from the soil, while translocation factor (TF) could be used to reflect the ability of tomato plants to transfer Se from root to aboveground. As shown in , the bioaccumulation factor of root, stem, leaf and fruit in the control treatment was 0.03 ~ 0.98, which is lower than that in the Se application treatments, and there was difference between Ck and Se1, Se3, Se4 treatments. The control treatment showed the highest translocation factor in all treatments. Compared with the control, the TFstem in Se-treated groups was significant higher, while there was no difference between all treatments in TFleaf and TFfruit. The order of Se bioaccumulation factor in the plants was found to be in the following order: leaf > root > stem > fruit for all the treatment groups except for the Se2 treatment group. In the Se2 treatment group, the Se bioaccumulation was in the following order: root > leaf > stem > fruit. Under the same valence of exogenous Se treatments, high Se concentration was accompanied by low Se bioaccumulation. At the same Se concentration, the Se bioaccumulation factor in all plant parts treated with sodium selenate was significantly higher than those treated with sodium selenite, indicating that sodium selenate significantly improved the Se accumulation in root, stem, leaf, and fruit of tomato plants. As for the translocation factor, the TFleaf was highest in all organs of the plants. And the value of TFleaf was greater than one except in the Se2 treatment group, which indicated that Se was easier to transferred from root to leaf after abosorbing in other treatments.
Table 1. Bioaccumulation factors (BCF) and translocation factors (TF) of tomato plants under different Se fertilizer application.
Influence of Se on the microbial structure and diversity of rhizospheric soil
The copy numbers of bacterial 16S rRNA genes and fungal ITS genes reflect the abundance of soil bacterial and fungal communities in the soil (). The copy numbers of 16S rRNA genes and ITS genes in the control treatment was the highest in all treatments. Compared with the control, the bacterial and fungal community abundances in the Se fertilizer treatment groups decreased by 5.2%~92.8% and 10.1%~90.8%, respectively. The microbial abundances between Ck and Se2, Se3, Se4 treatment groups significantly varied (p < 0.05). One-way ANOVA showed no differences in Chao1 and Shannon indices of the soil bacterial and fungal communities (, p < 0.05).
Figure 3. Abundances of bacterial 16S rRNA and fungal ITS genes in the rhizospheric soil of tomato plants. Error bars refer to standard deviation values (n=3). The letters above the column indicate differences among treatments (p<0.05). Ck, control. Se1 and Se2 are sodium selenite at 1 mg kg−1 and 5 mg kg−1, respectively. Se3 and Se4 are sodium selenate at 1 mg kg−1 and 5 mg kg−1, respectively.
Table 2. Diversity and richness of bacteria/fungi in the rhizospheric soil of tomato plants treated with different Se fertilizer.
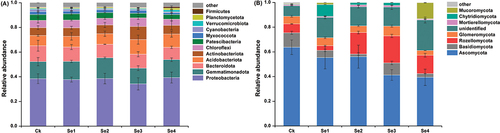
We identified a total of 41 bacterial phyla and 14 fungal phyla in Ck and Se1–4 treatment groups, of which 12 bacterial and fungal phyla showed >1% relative abundance (). Five dominant bacterial communities, including Protebacteria, Gemmatimonadota, Bacteroidota, Acidobacteriota, and Actinobacteriota, which accounted for 79.8% of the total bacterial community, were observed in the control treatment. And these dominant bacterial communities accounted for more than 79.7% in Se1–4 treatment groups. Ascomycota was the most abundant fungal phylum in all treatments, and its percentage was highest in the control treatment, accounting for 63.8% of the total sequences. The relative abundance of Ascomycota accounted for 39.4%~55.4% of the total sequences in Se-treated treatments. Moreover, Protebacteria showed the highest relative abundance, followed by Gemmatimonadota, which accounted for 34.3%~39.4% and 12.7%~16.8% of the total bacterial community in each treatment group, respectively. Compared with the control, the relative abundance of Acidobacteriota and Actinobacteriota increased in Se-treated soil, whereas the relative abundance of Bacteroidota decreased. And Se fertilizer treatments decreased the relative abundance of Ascomycota compared to the control. Just as the Acidobacteriota abundance increased in Se3, which should be mentioned to the application of selenate. This suggested that exogenous Se fetilizer application influenced the relative abundance of bacteria and fungi.
Figure 4. The relative abundances of bacterial (a) and fungal (b) phyla in the rhizospheric soil of tomato plants under different Se treatments. Error bars refer to standard deviation values (n=3). The letters above the column indicate differences among treatments (p<<0.05). Ck, control. Se1 and Se2 are sodium selenite at 1 mg kg−1 and 5 mg kg−1, respectively. Se3 and Se4 are sodium selenate at 1 mg kg−1 and 5 mg kg−1, respectively.
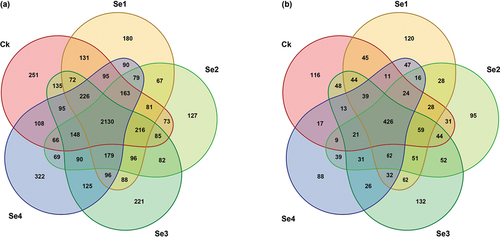
Venn diagrams display common and unique operational taxonomic unit (OTU) among different soil samples, reflecting the differences in species composition of samples at the OTU level (). A total of 2,130 common bacterial 16S rRNA genes and 426 common fungal ITS gene OTU species were observed in all the treatment groups. The unique OTUs of the soil bacterial and fungal community in the control treatment was 251 and 116, respectively. In contrast, the unique OTUs of the soil bacterial community in the Se1, Se2, Se3, and Se4 treatment groups were 180, 127, 221, and 322, respectively, and the number of unique OTUs of the soil fungal community were 120, 95, 132, and 88, respectively. Compared with the control, Se1 and Se3 treatment groups showed an increased specificity for soil fungal community structure, while Se4 treatment group showed a decreased specificity. Moreover, the bacterial community structure of rhizospheric soil in Se4 treatment group was the most complex compared to the other four groups, and which had the highest specificity.
Figure 5. The venn diagram of bacterial (a) and fungal (b) OTUs in the rhizospheric soil of tomato plants under different Se treatments. Ck, control. Se1 and Se2 are sodium selenite at 1 mg kg−1 and 5 mg kg−1, respectively. Se3 and Se4 are sodium selenate at 1 mg kg−1 and 5 mg kg−1, respectively.
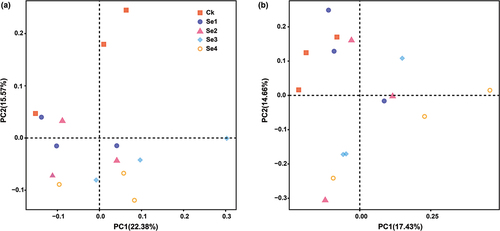
Principal coordinates analysis (PCoA) of microbial community beta diversity was used to characterize the effects of exogenous Se in the rhizospheric soil of tomato plants (). The three replicates of each treatment were not clustered in the same quadrant, indicating remarkable differences within the group. As we can see from , in the first and second principal coordinates, samples were divided into two categories: Ck treatment clustered into a cluster, while the other Se treatments clustered into another cluster, indicating that Se treatment groups had high similarity in community structure except for Ck. Based on Bray-Curits PERMANOVA analysis, the results indicated that exogenous Se had a significant effect on soil bacterial community structure (PERMANOVA,Bray-Curtis, F = 1.453,P = 0.006) but a non-significant effect on the soil fungal community structure (PERMANOVA,Bray-Curtis,F = 1.1175,P = 0.198). It suggested that Se fertilizer application significantly affected the bacterial community structure in the rhizospheric soil of tomato plants.
Figure 6. Principal coordinates analysis (PCoA) of bacterial (a) and fungal (b) communities in the rhizospheric soil of tomato plants under different Se treatments. Ck, control. Se1 and Se2 are sodium selenite at 1 mg kg−1 and 5 mg kg−1, respectively. Se3 and Se4 are sodium selenate at 1 mg kg−1 and 5 mg kg−1, respectively.
Discussion
In the current study, Se fertilizer application improved the yield of tomatoes, and the effect of sodium selenate was better than that of sodium selenite (). The reason for this situation is due to the difference in selenium accumulation levels between selenate and selenite. Selenate, is weakly adsorbed by soil constituents because it mostly forms outer-sphere surface complexes, therefore, is more exchangeable in the soil environment and available for plant uptake (Tsioubri, Gasparatos, and Economou-Eliopoulos Citation2020). While selenite is strongly adsorbed in soil forming inner-sphere complexes with Fe-AL oxides, and it becomes less mobile in the soil environment and tends to accumulate in plant roots (Zafeiriou et al. Citation2022). These outcomes also align with previous studies by Irmark (Citation2017) and Tang et al. (Citation2021) who reported that applying Se fertilizer to the soil enhances plants’ growth and development and improves crop yield and quality. The increase in the crop yield might be attributed to improved photosynthesis and antioxidant activity; however, none of these parameters were analyzed in the current study. Previous studies have shown that Se fertilizer influence the absorption of mineral elements and activities of superoxide dismutase and peroxidase to promote the growth of plants and increase crop yield (Jiang et al. Citation2016; Weronika and Barbara Citation2019). Se fertilizer also influences the chlorophyll synthesis of plants, promoting photosynthesis and increasing crop yield (Zhang et al. Citation2014).
The Se content in different parts of tomato plants gradually increased with the elevated Se fertilizer levels (either as selenate or selenite), and the highest Se level was observed in the leaves and the lowest in the fruits (). This is similar to the findings by Fan et al. (Citation2015) that Se(Ⅳ) and Se(Ⅵ) can effectively increase the Se content in different parts of tobacco plants, and the leaves of tobacco plants showed the highest Se content. It was found that Se content in different parts of the tomato plants treated with sodium selenate increased by 0.3–6.1 times compared to sodium selenite, which was significantly higher in 5 mg kg−1 sodium selenate (). Previous studies have indicated that the Se content was higher in the selenate-treated tomato plants than in selenite-treated tomato plants (Fan et al. Citation2015). This might be due to the quick absorption of Se(Ⅳ) by soil, bound by carbonate and iron and manganese oxides, reducing Se bioavailability (Xue et al. Citation2011). It is found that selenite in the soil is not immediately transported to the plant parts above the ground rather, it is easily transformed into other forms, including selenomethionine and its oxides, selenomethylcysteine; resulting in the accumulation of most Se in the plant roots (Jiang et al. Citation2015; Li, McGrath, and Zhao Citation2008). However, studies have reported that selenate rarely transforms after being absorbed by plants, and it is immediately transported to the aboveground, which is more likely to accumulate in the plant leaves (Pilon-Smits et al. Citation1999). According to the standard of Se-enriched agricultural products in China (GH/T 1135–2017), the total Se content in Se-enriched vegetables should be 0.1 ~ 1.0 mg kg−1. In our study, the Se concentration of fruits under the four treatments of exogenous Se application was 0.18–0.79 mg kg−1, which reached that standard. In addition, according to the Dietary Guidelines for Chinese Residents (2022), the daily consumption of vegetables should not exceed 500 g. In this study, the average daily Se intake in tomato fruit meets the safe range of 40 ~ 400 μg d−1 that specified in Chinese Dietary Reference Intakes (WST577.3–2017).
The application of sodium selenate significantly improved Se accumulation in root, stem, leaf, and fruit of tomato plants, and the leaves of tomato plants had the highest Se enrichment capacity (). This is similar to previous studies on winter wheat that Se content in different wheat organs increased with the increasing exogenous Se, and the enrichment coefficient of Se in all plant organs treated with sodium selenate was higher than those treated with sodium selenite (Fu et al. Citation2011). At the same time, the enrichment capacity of wheat leaves and roots was highest in the selenate and selenite treatment groups, respectively (Fu et al. Citation2011). However, in our study, we have observed the result that root had the strongest Se bioaccumulation in Se2 treatment (), while this trend was not observed in Se1 treatment. In addition, the current study showed us Se application increased the transport capacity of Se from roots to stems, the leaves of tomato plants had the highest ability to transport Se in all treatment groups, while the value of TFleaf was lower than one in Se2 (). This may be due to the fact that under the condition of insufficient selenite supply in the soil, Se has little effect on Se transporter activity, resulting in more Se being transported to the aboveground parts of plants, when selenite supply is sufficient, Se changes the activity of Se transporter, resulting in the inhibition of Se transfer and accumulation to reproductive organs (Zhou, Shi, and Yang Citation2007). Previous studies have also shown that the ability of plant parts to absorb and enrich Se is different, which is related to the plant species and its growth environment (Zhu et al. Citation2009).
It was found that different concentrations of Se fertilizer application decreased the copy numbers of bacterial 16S rRNA genes and fungal ITS genes in the rhizospheric soil of tomato plants (), irrespective of Se valence state. However, no difference was observed in bacterial or fungal community alpha diversity and richness (). A similar result was also reported by Cheng et al. (Citation2020) who found that Se application reduced the abundance of the soil bacterial community, and did not significantly alter soil microbial diversity in the rhizospheric soil of oilseed rape. However, some studies have reported different results. It is found that Se in the soil affects the soil microbial diversity by altering cell metabolism and microbial function (Wang et al. Citation2018), increasing the diversity of Se, and reducing or oxidizing bacteria (Nancharaiah and Lens Citation2015). Previous studies have indicated that optimum application of Se to the soil could increase the bacterial and fungal abundance in the soil, whereas a higher concentration of Se inhibits it (Dai and Tu Citation2018; Fan and Li Citation2008). This might be due to the effects of Se on soil microbiota, which is correlated to the Se application concentration, microbial species, physical and chemical properties of soil, soil enzyme activity, plant species, and growth environment (Dong et al. Citation2014; Tang et al. Citation2021).
The application of exogenous Se altered the bacterial and fungal community composition of the rhizospheric soil of tomato plants, which increased the relative abundance of Acidobacteriota and Actinobacteriota in Se-treated soil involved in the decomposition of organic matter (). It was consistent with the study by Li et al. (Citation2021) who indicated that the relative abundances of Actinobacteriota were significantly increased post-Se application in the oat plants. It was reported that Acidobacteriota could degrade complex lignin and cellulose, providing nutrients for the soil (Bonanomi et al. Citation2010). Chitin and cellulose, which Actinobacteriota readily degrades, are difficult for other bacteria to degrade (Gavrilov et al. Citation2019). This indicated that exogenous Se could promote the degradation of lignin and cellulose by increasing their abundance and, in turn, enhancing the absorption of soil nutrients by tomato plants. In addition, it has been reported that soil Se application could specifically enrich certain beneficial microbes contributing to the plant growth, reducing the incidence of sclerotinia stem rot disease of oilseed rape (Liu et al. Citation2019). Moreover, it was found that the increased relative abundance of Acidobacteriota in the soil altered the interaction and balance of the microbial population, promoting crop growth and inhibiting soil-borne diseases (Hartmann et al. Citation2015; Jia et al. Citation2015). However, these results was different to findings by Cheng et al. (Citation2020) who reported that compared with Se-unfertilized soil, selenite amended soil increased the relative abundance of Acidobacteriota, Gemmatimonadota, and Ascomycota, while decreasing the relative abundance of Actinobacteriota in the rhizospheric soil of oilseed rape. This may be due to the the fact that although Se can alter the structure and diversity of soil microbial community, the characteristics and diversity of soil microbial community varied with the concentration and valence of Se fertilizer, which was closely related to many factors, such as plant species, root exudates, soil physical and chemical properties, and nutrient content (Gao et al. Citation2021; Liu, Li, and Yao Citation2021; Paterson et al. Citation2007; Zhang et al. Citation2018). In our study, Protebacteria, Gemmatimonadota, Bacteroidota, Acidobacteriota, and Actinobacteriota were the five dominant bacterial communities, and Ascomycota was proved to be the highest relative abundance in fungal community (). Previous studies have shown that Proteobacteria have higher adaptability to the rhizospheric environment of Arabidopsis, lyceum berries, and other plants (Marschner, Kandeler, and Marschnerc Citation2003). Bacteroidota, Chloroflexi, and Gemmatimonadota are closely related to soil nutrient content, and their relative abundance can reflect soil nutrient level (Li et al. Citation2021). In general, these results indicated that Se application had a positive effect on the composition of the soil microbial community.
The application of Se fertilizer had a greater effect on soil bacterial community structure (), which was the most complex and had the highest specificity in 5 mg kg−1 sodium selenate (). Consistent with the findings by (Rosenfeld et al. Citation2018), Actinomycetes and Blastomonas were enriched in the soil with high Se content, while Ascomycete was the dominant genus regardless of the Se concentration in the soil. The possible reason for this is that the sensitivity of different microbes to exogenous Se were varied. The results of the beta-diversity analysis in the current study indicated that the effect of Se fertilizer application on the bacterial community structure was more significant compared to the effect of Se on the soil fungi. Thus, exogenous Se application had a greater effect on the bacterial community in the rhizospheric soil of tomato plants than the fungal community structure.
Conclusion
The results of present studies indicated that Se fertilizer application improved the yield of tomato plants, and altered the bacterial and fungal community composition of the rhizospheric soil of tomato plants, decreasing the copy numbers of bacterial 16S rRNA genes and fungal ITS genes, increasing the relative abundance of Acidobacteriota and Actinobacteriota. Therefore, considering factors such as yield, Se content and accumulation ability, food safety, diversity, composition and structure of soil microbial community, 5 mg kg−1 sodium selenate application proved conducive for achieving higher yield and Se content in tomato plants, improving Se accumulation, meeting the daily Se intake requirements of humans, and had a positive effect on the composition and structure of rhizosphere bacterial community in tomato plants. In general, this work revealed the effects of Se fertilizer application on agronomic characteristics of tomato plants, Se accumulation, and bacterial and fungal communities in the rhizospheric soil, providing a reference for the rational cultivation for high-quality tomato to meet human health needs in agriculture.
Acknowledgements
The authors acknowledge Enshi Tujia & Miao Autonomous Prefecture Academy of Agricultural Sciences for financial and technical support, as well as other participants in this work.
Disclosure statement
No potential conflict of interest was reported by the author(s).
Additional information
Funding
References
- Akhtar, K. P., M. Y. Saleem, Q. Iqbal, M. Asghar, A. Hameed, and N. Sarwar. 2016. Evaluation of tomato genotypes for late blight resistance using low tunnel assay. Journal of Plant Pathology 98 (3):421–28.
- Bakker, M. G., J. M. Chaparro, D. K. Manter, and J. M. Vivanco. 2015. Impacts of bulk soil microbial community structure on rhizosphere microbiomes of Zea mays. Plant and Soil 392 (1–2):115–126. doi:10.1007/s11104-015-2446-0.
- Bao, S. D. 2000. Soil agrochemical analysis. 3rd ed. Beijing: China Agriculture Press.
- Bitterli, C., G. S. Bañuelos, and R. Schulin. 2010. Use of transfer factors to characterize uptake of selenium by plants. Journal of Geochemical Exploration 107 (2):206–216. doi:10.1016/j.gexplo.2010.09.009.
- Bonanomi, G., V. Antignani, M. Capodilupo, and F. Scala. 2010. Identifying the characteristics of organic soil amendments that suppress soilborne plant diseases. Soil Biology and Biochemistry 42 (2):136–144. doi:10.1016/j.soilbio.2009.10.012.
- Bremner, J. M. 1960. Determination of nitrogen in soil by the kjeldahl method. The Journal of Agricultural Science 55 (1):11–33. doi:10.1017/S0021859600021572.
- Bremner, J. M., and D. S. Jenkinson. 1960. Determination of organic carbon in soil. Journal of Soil Science 11 (2):394–402. doi:10.1111/j.1365-2389.1960.tb01093.x.
- Brown, K. M., and J. R. Arthur. 2001. Selenium, selenoproteins and human health: A review. Public Health Nutrition 4 (2b):593–599. doi:10.1079/PHN2001143.
- Cheng, Q., C. X. Hu, J. J. Ming, M. M. Cai, K. Liu, Y. N. Tang, and X. H. Zhao. 2020. Effects of selenium on microorganisms in the rhizophere soil of oilseed rape. Journal of Agricultural Resources and Environment 38 (1):104–10.
- Chen, X., Z. Y. Zhang, M. H. Gu, H. Li, M. J. I. Shohag, F. K. Shen, X. L. Wang, and Y. Wei. 2020. Combined use of arbuscular mycorrhizal fungus and selenium fertilizer shapes microbial community structure and enhances organic selenium accumulation in rice grain. Science of the Total Environment 748:141166. doi:10.1016/j.scitotenv.2020.141166.
- Cui, L., J. Zhao, J. Chen, W. Zhang, Y. Gao, B. Li, and Y.-F. Li. 2018. Translocation and transformation of selenium in hyperaccumulator plant cardamine enshiensis from Enshi, Hubei, China. Plant and Soil 425 (1–2):577–588. doi:10.1007/s11104-018-3587-8.
- Dai, Z. H., and S. X. Tu. 2018. Effects of exogenous selenium on rice soil microbial diversity and soil selenium morphological transformation. In Proceedings of the 20th meeting of Soil Environment Committee of Chinese Soil Society and workshop on Farmland Soil pollution and Remediation, Anhui, China.
- Dinh, Q. T., Z. Cui, J. Huang, T. A. T. Tran, D. Wang, W. Yang, F. Zhou, M. Wang, D. Yu, and D. Liang. 2018. Selenium distribution in the Chinese environment and its relationship with human health: A review. Environment International 112:294–309. doi:10.1016/j.envint.2017.12.035.
- Dong, W. Y., X. Y. Zhang, X. Q. Dai, X. L. Fu, F. T. Yang, X. Y. Liu, X. M. Sun, X. F. Wen, and S. Schaeffer. 2014. Changes in soil microbial community composition in response to fertilization of paddy soils in subtropical China. Applied Soil Ecology 84:140–147. doi:10.1016/j.apsoil.2014.06.007.
- Dungan, R. S., S. R. Yates, and W. T. F. Jr. 2003. Transformations of selenate and selenite by Stenotrophomonas maltophilia isolated from a seleniferous agricultural drainage pond sediment. Environmental Microbiology 5 (4):287–95. doi:10.1046/j.1462-2920.2003.00410.x.
- Fan, W. H., and L. Li. 2008. Effects of selenium-cobalt combined application on tomato seedling growth and soil microorganisms. In Proceedings of the 11th National Congress of Chinese Soil Society and the 7th Cross-strait Seminar on Soil and fertilizer academic Exchange, Beijing, China.
- Fan, J., R. Wang, H. Q. Hu, X. J. Ye, P. L. Xia, and J. Q. Deng. 2015. Effects of exogenous selenium with different balences on Se forms, enzyme activities and microbial quantity of soil. Journal of Soil and Water Conservation 29 (5):137–41,171.
- Fu, D. D., S. S. Wang, D. L. Liang, S. Y. Liao, M. L. Duan, and B. Hu. 2011. Effects of exogenetic selenite and selenate on the growth and physiological metabolism of winter wheat. Journal of Agro-Environment Science 30 (8):1500–07.
- Gao, H. F., J. Y. Xu, T. Meng, J. S. Chen, J. Z. Qiu, Z. Y. Zhang, and L. Y. Zhang. 2021. Microbial diversity in rhizopshere soil of Pseudostellaria heterophylla and its conrrelation with main soil physicochemical factor. Fujian Journal of Agricultural Sciences 36 (3):345–57.
- Gavrilov, S. N., A. A. Korzhenkov, I. V. Kublanov, R. Bargiela, L. V. Zamana, A. A. Popova, S. V. Toshchakov, P. N. Golyshin, and O. V. Golyshina. 2019. Microbial Communities of Polymetallic Deposits’ Acidic Ecosystems of Continental climatic zone with high temperature contrasts. Frontier in Microbiology 10:1573. doi:10.3389/fmicb.2019.01573.
- Hartmann, M., B. Frey, J. Mayer, P. Mader, and F. Widmer. 2015. Distinct soil microbial diversity under long-term organic and conventional farming. The ISME Journal 9 (5):1177–94. doi:10.1038/ismej.2014.210.
- Irmark, S. 2017. Effects of Selenium Application on plant growth and some quality parameters in peanut (arachis hypogaea). Pakistan Journal of Biological Sciences 20 (2):92–99. doi:10.3923/pjbs.2017.92.99.
- Jiang, Y., Z. H. Zeng, Y. Bu, C. Z. Ren, J. Z. Li, J. J. Han, C. Tao, K. Zhang, X. X. Wang, G. X. Lu, et al. 2015. Effects of selenium fertilizer on grain yield, Se uptake and distribution in common buckwheat (fagopyrum esculentum Moench). Soil and Environment 61 (8):371–377. doi:10.17221/284/2015-PSE.
- Jiang, Y., Z. H. Zeng, Q. S. Yang, J. Zhao, Y. D. Yang, and Y. G. Hu. 2016. Selenium uptake and transformation mechanisms and physiological function in plant: A review. Chinese Journal of Applied Ecology 27 (12):4067–76. doi:10.13287/j.1001-9332.201612.037.
- Jia, F., T. Zhu, X. H. Zhao, Y. P. Sheng, J. J. Ming, W. Jia, and Y. K. Liu. 2015. Inhibition of selenium on rape sclerotinia sclerotiorum. Chinese Agricultural Science Bulletin 31 (25):176–81.
- Kieliszek, M., and S. Błażejak. 2013. Selenium: Significance, and outlook for supplementation. Nutrition 29 (5):713–718. doi:10.1016/j.nut.2012.11.012.
- Lange, M., N. Eisenhauer, C. A. Sierra, H. Bessler, C. Engels, R. I. Griffiths, P. G. Mellado-Vázquez, A. A. Malik, J. Roy, S. Scheu, et al. 2015. Plant diversity increases soil microbial activity and soil carbon storage. Nature Communications 6 (1):1–8. doi:10.1038/ncomms7707.
- Lara, T. S., J. H. D. L. Lessa, K. R. D. de Souza, A. P. B. Corguinha, F. A. D. Martins, G. Lopes, and L. R. G. Guilherme. 2019. Selenium biofortification of wheat grain via foliar application and its effect on plant metabolism. Journal of Food Composition and Analysis 81:10–18. doi:10.1016/j.jfca.2019.05.002.
- Leff, J. W., S. E. Jones, S. M. Prober, A. Barberan, E. T. Borer, J. L. Firn, W. S. Harpole, S. E. Hobbie, K. S. Hofmockel, M. H. Johannes, et al. 2015. Consistent responses of soil microbial communities to elevated nutrient inputs in grasslands across the globe. Proceedings of the National Academy of Sciences 112 (35):10967–72. doi:10.1073/pnas.1508382112.
- Lei, L., J. M. Zhu, F. P. Wang, X. Xiao, H. B. Qin, and X. B. Feng. 2011. A preliminary study on microbial diversity in selenium-enriched carbonaceous mudstone in Yutangba, Enshi, Hubei. Earth and Environment 39 (4):517–22.
- Li, J., D. Liang, S. Qin, P. Feng, and X. Wu. 2015. Effects of selenite and selenate application on growth and shoot selenium accumulation of pak choi (Brassica chinensis L.) during successive planting conditions. Environmental Science and Pollution Research International 22 (14):11076–86. doi:10.1007/s11356-015-4344-7.
- Li, H. F., S. P. McGrath, and F. J. Zhao. 2008. Selenium uptake, translocation and speciation in wheat supplied with selenate or selenite. New Phytologist 178 (1):92–102. doi:10.1111/j.1469-8137.2007.02343.x.
- Lin, L., W. Zhou, H. Dai, F. Cao, G. Zhang, and F. Wu. 2012. Selenium reduces cadmium uptake and mitigates cadmium toxicity in rice. Journal of Hazardous Materials 235-236 (235):343–51. doi:10.1016/j.jhazmat.2012.08.012.
- Liu, K., M. Cai, C. Hu, X. Sun, Q. Cheng, W. Jia, T. Yang, M. Nie, and X. Zhao. 2019. Selenium (se) reduces sclerotinia stem rot disease incidence of oilseed rape by increasing plant Se concentration and shifting soil microbial community and functional profiles. Environmental Pollution 254 (PT.2):.113051.1–10. doi:10.1016/j.envpol.2019.113051.
- Liu, J. W., Z. X. Li, and M. J. Yao. 2021. Advances in plant rhizosphere microbial community construction. Acta Microbiologica Sinica 61 (2):231–48.
- Li, J., W. Yang, A. Guo, S. Yang, J. Chen, Y. Qiao, S. Anwar, K. Wang, Z. Yang, Z. Gao, et al. 2021. Combined foliar and soil selenium fertilizer improves selenium transport and the diversity of rhizosphere bacterial community in oats. Environmental Science and Pollution Research 28 (45):64407–64418. doi:10.1007/s11356-021-15439-4.
- Lu, L., W. Han, J. Zhang, Y. Wu, B. Wang, X. Lin, J. Zhu, Z. Cai, and Z. Jia. 2012. Nitrification of archaeal ammonia oxidizers in acid soils is supported by hydrolysis of urea. The ISME Journal 6 (10):1978–84. doi:10.1038/ismej.2012.45.
- Marschner, P., E. Kandeler, and B. Marschnerc. 2003. Structure and function of the soil microbial community in a long-term fertilizer experiment. Soil Biology and Biochemistry 35 (3):453–61. doi:10.1016/S0038-0717(02)00297-3.
- Mendes, R., M. Kruijt, I. D. Bruijn, E. Dekkers, M. V. D. Voort, J. H. M. Schneider, Y. M. Piceno, T. Z. Desantis, G. L. Andersen, and P. A. H. M. Bakker. 2011. Deciphering the rhizosphere microbiome for disease-suppressive bacteria. Science 332 (6033):1097–100. doi:10.1126/science.1203980.
- Nacke, H., A. Thurmer, A. Wollherr, C. Will, L. Hodac, N. Herold, I. Schoning, M. Schrumpf, R. Daniel, and J. Gilbert. 2011. Pyrosequencing-based assessment of bacterial community structure along different management types in German forest and grassland soils. Public Library of Science ONE 6 (2):e17000. doi:10.1371/journal.pone.0017000.
- Nancharaiah, Y. V., and P. N. Lens. 2015. Ecology and biotechnology of selenium-respiring bacteria. Microbiology and Molecular Biology Reviews: MMBR 79 (1):61–80. doi:10.1128/MMBR.00037-14.
- Paterson, E., T. Gebbing, C. Abel, A. Sim, and G. Telfer. 2007. Rhizodeposition shapes rhizosphere microbial community structure in organic soil. New Phytologist 173 (3):600–610. doi:10.1111/j.1469-8137.2006.01931.x.
- Pilon-Smits, E. A. H., S. Hwang, C. M. Lytle, Y. Zhu, J. C. Tai, R. C. Bravo, Y. Chen, T. Leustek, and N. Terry. 1999. Overexpression of ATP sulfurylase in Indian mustard leads to increased selenate uptake, reduction, and tolerance. Plant Physiology 119 (1):123–32. doi:10.1104/pp.119.1.123.
- Pilon-Smits, E. A., C. F. Quinn, W. Tapken, M. Malagoli, and M. Schiavon. 2009. Physiological functions of beneficial elements. Current Opinion in Plant Biology 12 (3):267–74. doi:10.1016/j.pbi.2009.04.009.
- Qing, X., X. Zhao, C. Hu, P. Wang, Y. Zhang, X. Zhang, P. Wang, H. Shi, F. Jia, and C. Qu. 2015. Selenium alleviates chromium toxicity by preventing oxidative stress in cabbage (brassica campestris L. ssp. Pekinensis) leaves. Ecotoxicology and Environmental Safety 114:179–89. doi:10.1016/j.ecoenv.2015.01.026.
- Rahman, M. M., K. F. B. Hossain, S. Banik, M. T. Sikder, M. Akter, S. E. C. Bondad, M. S. Rahaman, T. Hosokawa, T. Saito, and M. Kurasaki. 2018. Selenium and zinc protections against metal-(loids)-induced toxicity and disease manifestations: A review. Ecotoxicology & Environmental Safety 30 (168):146–63. doi:10.1016/j.ecoenv.2018.10.054.
- Renkema, H., A. Koopmans, L. Kersbergen, J. Kikkert, B. Hale, and E. Berkelaar. 2011. The effect of transpiration on selenium uptake and mobility in durum wheat and spring canola. Plant and Soil 354 (1–2):239–50. doi:10.1007/s11104-011-1069-3.
- Rosenfeld, C. E., B. R. James, C. M. Santelli, and F. E. Löffler. 2018. Persistent bacterial and fungal community shifts exhibited in selenium-contaminated reclaimed mine soils. Applied and Environmental Microbiology 84 (16):1–18. doi:10.1128/AEM.01394-18.
- Ros, G. H., A. M. D. Van Rotterdam, D. W. Bussink, and P. S. Bindraban. 2016. Selenium fertilization strategies for bio-fortification of food: An agro-ecosystem approach. Plant and Soil 404 (1–2):99–112. doi:10.1007/s11104-016-2830-4.
- Sarwar, N., M. Akhtar, M. A. Kamran, M. Imran, M. A. Riaz, K. Kamran, and S. Hussain. 2020. Selenium biofortification in food crops: Key mechanisms and future perspectives. Journal of Food Composition and Analysis 93:103615. doi:10.1016/j.jfca.2020.103615.
- Shen, W., X. Lin, W. Shi, J. Min, N. Gao, H. Zhang, R. Yin, and X. He. 2010. Higher rates of nitrogen fertilization decrease soil enzyme activities, microbial functional diversity and nitrification capacity in a Chinese polytunnel greenhouse vegetable land. Plant and Soil 337 (1–2):137–150. doi:10.1007/s11104-010-0511-2.
- Tang, J. J., K. C. Xiao, P. P. Duan, D. J. Li, and Y. X. Liu. 2021. Effects of selenium fertilization on selenium uptake of pakchoi and soil bilogical activities. Research of Agricultural Modernization 42 (4):755–63.
- Tsioubri, M., D. Gasparatos, and M. Economou-Eliopoulos. 2020. Selenium uptake by lettuce (lactuca sativa L.) and Berseem (trifolium alexandrinum L.) as affected by the application of sodium selenate, soil acidity and organic matter content. Plants (Basel) 9 (5):605. doi:10.3390/plants9050605.
- Wang, D., Q. T. Dinh, T. T. Anh Thu, F. Zhou, W. Yang, M. Wang, W. Song, and D. Liang. 2018. Effect of selenium-enriched organic material amendment on selenium fraction transformation and bioavailability in soil. Chemosphere 199:417–426. doi:10.1016/j.chemosphere.2018.02.007.
- Wang, D., Z. Fei, W. Yang, Q. Peng, N. Man, and D. Liang. 2017. Selenate redistribution during aging in different Chinese soils and the dominant influential factors. Chemosphere 182:284–92. doi:10.1016/j.chemosphere.2017.05.014.
- Wang, Z., W. Huang, and F. Pang. 2021. Selenium in Soil-Plant-Microbe: A review. Bulletin of Environmental Contamination and Toxicology 108 (2):167–81. doi:10.1007/s00128-021-03386-2.
- Weronika, J., and P. Barbara. 2019. Effect of selenium on alleviating oxidative stress caused by a water deficit in cucumber roots. Plants (Basel) 8 (7):217. doi:10.3390/plants8070217.
- White, P. J., and M. R. Broadley. 2009. Biofortification of crops with seven mineral elements often lacking in human diets–iron, zinc, copper, calcium, magnesium, selenium and iodine. New Phytologist 182 (1):49–84. doi:10.1111/j.1469-8137.2008.02738.x.
- Wu, Z., G. S. Banuelos, Z. Q. Lin, Y. Liu, L. Yuan, X. Yin, and M. Li. 2015. Biofortification and phytoremediation of selenium in China. Frontiers in Plant Science 6 (6):136–144. doi:10.3389/fpls.2015.00136.
- Wu, Z. L., X. B. Yin, Z. Q. Lin, G. S. Banuelos, L. X. Yuan, Y. Liu, and M. Li. 2014. Inhibitory effect of selenium against Penicillium expansum and its possible mechanisms of action. Current Microbiology 69 (2):192–201. doi:10.1007/s00284-014-0573-0.
- Xue, R. L., D. L. Liang, S. S. Wang, D. D. Fu, M. L. Duan, and M. Xu. 2011. Valence State Changes and bioavailability of selenium in soil treated with selenite and selenate. Environmental Science 32 (6):1726–33.
- Zafeiriou, I., D. Gasparatos, D. Ioannou, D. Kalderis, and I. Massas. 2022. Selenium biofortification of lettuce plants (lactuca sativa L.) as affected by Se species, Se rate, and a Biochar Co-Application in a Calcareous Soil. Agronomy 12 (1):131. doi:10.3390/agronomy12010131.
- Zhang, L. H., B. Hu, W. Li, R. Che, K. Deng, H. Li, F. Yu, H. Ling, Y. Li, and C. Chu. 2014. OsPT2, a phosphate transporter, is involved in the active uptake of selenite in rice. The New Phytologist 201 (4):1183–1191. doi:10.1111/nph.12596.
- Zhang, E. P., Y. Y. Tian, M. Li, M. Shi, Y. H. Jiang, R. B. Ren, and S. H. Zhang. 2018. Effects of various long-term fertilization regimes on soil microbial functional diversity in tomato rhizosphere soil. Acta Ecologica Sinica 38 (14):5027–36.
- Zhou, X. B., W. M. Shi, and L. Z. Yang. 2007. Differences and mechanism of selenium uptake and distribution between Se-enriched and non-Se-enriched rice varieties. Soils 39 (5):731–36.
- Zhu, Y. G., E. A. Pilon-Smits, F. J. Zhao, P. N. Williams, and A. A. Meharg. 2009. Selenium in higher plants: Understanding mechanisms for biofortification and phytoremediation. Trends in Plant Science 14 (8):436–42. doi:10.1016/j.tplants.2009.06.006.