?Mathematical formulae have been encoded as MathML and are displayed in this HTML version using MathJax in order to improve their display. Uncheck the box to turn MathJax off. This feature requires Javascript. Click on a formula to zoom.
ABSTRACT
This paper aims to find the relationship between key determinants such as income, education, life expectancy, employment and life insurance demand in the countries of the Visegrad Group (V4). This article makes use of OECD data and applies linear and panel data regressions. We find that with increasing income and higher educational attainment, people demonstrate more demand for investment in pension funds but less for life insurance. Furthermore, unemployment appears to have a strongly negative effect in all presented models, and with higher life expectancy, people demand more life insurance products and less pension fund assets.
Introduction
In most OECD countries, the cost of health care and social security is increasing in proportion to the aging population and improving quality of life. While traditional capitalist economies such as the United States, the United Kingdom, the Netherlands, and Switzerland deal with population aging by creating financial reserves in the form of pension funds, life insurance, or private savings, post-communist countries usually operate on a Pay-As-You-Go principle (PAYG), referring to a system in which people pay for a service before they use it, without the ability to use more than they have paid for (Cambridge Dictionary Citation2021). For the sake of completeness, we state that World Bank (Citation1994) defined three forms of the pension system, specifically, an ongoing (pay-as-you-go) pension system, a combination of mandatory and voluntary pension system, and a private (fully capitalized) pension system. In the Pay-As-You-Go system, pensioners receive a pension from the state, and the state receives money to finance the pension from working citizens who pay pension insurance from their wages or profits. All working citizens thus participate in the payment of pensions to current pensioners. This principle works well in countries with high birth rates, very low unemployment, and a generous social system (Fanti and Gori Citation2012). In such an environment, people do not worry about their future; they believe that governments take care of them and do not postpone establishing their own family until they are financially secure. V4 countries, similarly as almost all countries in Europe, except from Northern Europe, suffers from population aging (European Science Foundation Citation2010). Based on the study by Vogel, Ludwig, and Börsch-Supan (Citation2017) the three demographically oldest European nations were considered France, Germany and Italy. In all V4 countries the communist party dominated for 40 years, providing people with secure jobs and enforcing a classless system and centrally planned economy. Since 1991, these countries have transformed themselves into a free market economy.
An aging population and a growing burden on the government in the area of pension financing are problems that most developed economies nowadays have to face. In countries with a long tradition of a market economy, governments were forced to address population aging and pension reform a long time ago, but for the V4 countries that have transformed from socialist to market economies in recent years, now is the time to deal with it. In developed economies with higher living standards and life expectancy, social security and health care costs are generally higher than state payments to pensioners, and working people are forced to save money for retirement on their own (Bloom et al. Citation2015). The establishment of a private pension system (also known as a second pillar) – where people can redirect a certain percentage of mandatory wage contributions to their own savings with pension companies – and collective investment funds relieves the heavily stressed social and health insurance system. It is assumed that public budgets will partly pay to finance the post-active life of the population, while the remaining part will be financed by these private funds. However, post-communist countries, including the Visegrad Group countries, are now facing outdated principles, under which citizens still rely on government aid even though the rules of the game have changed from those of the Communist era (Naczyk and Domonkos Citation2016).
A recent study focusing on life insurance demand in V4 countries comes from a workshop of Slovak authors, with a data sample ranging from 1995 to 2010 (Brokešová Citation2014). They found that some results measured in the V4 countries were opposite from the developed Western economies. For instance, opposite results were found for determinants including age dependency ratio (negative influence in V4) and degree of urbanization (positive influence in V4). Another contemporary paper came from Poland (Sliwinski Citation2013). The authors applied Principal Component Analysis (PCA) and tested the influence of these components on the demand for life insurance in Poland. As a result, the economic component – including GDP, inflation rate, dependency ratio, and birth rate – had the highest impact on life insurance demand out of the four main components they analyzed, concluding that these findings are consistent with developments in Western economies (Kjosevski Citation2012).
The main contribution of this article is to extend existing research in transition economies and to identify the main determinants behind the creation of financial reserves of the population, using data from 1993 to 2017. Rather than examining the creation of demand for life insurance, we focused on creating savings in society. However, this article is not only about savings creation in V4 countries. Everything happens at a time when several important factors related to the creation of savings meet – major demographic changes and a greater perception of the risk of loss of living standards in the retirement phase of life and furthermore the absence of a vision for how to change the state pillar of retirement pensions. Thus, from our point of view, it is a unique historical period for these V4 countries. The aim of life insurance is to create additional financial reserves after retirement and to secure the individual’s post-active age. Likewise, the demand for pension funds gives us information about people’s savings as well. Taking this into account, we examine the influence of variables on the demand for life insurance and pension funds. We look at the research question from a broader perspective and explore the demand for life insurance and pension funds together. It is possible that due to the cultural and historical similarities of these countries, the overloaded social system, and the efforts of these countries to undertake pension reforms, the citizens of these countries will be jointly motivated to accumulate financial reserves, thus creating demand for these financial assets.
We used a panel regression model based on data obtained from the OECD public database. Based on a large number of regression models for the individual countries, we select three models as the final output – one benchmark model with the dependent variable “life insurance penetration” and two alternative models (with dependent variables “life insurance density” and “pension fund assets”) that best reflect the behavior of the economic subjects. We conclude the econometric part using a sensitivity analysis to individually test determinants that are not included in the benchmark model.
In contradiction with the findings of the US studies, We found that the income determinant, which is considered to be the main positive factor affecting the demand for life insurance in most studies, turned out to be negative within the V4 countries. This means that people prefer other investments over life insurance as their income increases. However, in the alternative model of demand for investment in pension funds, income is classified as a positive factor in correspondence with historical studies (Li et al. Citation2007). Education was also a clearly positive determinant in previous studies, but we find it to be negative in the V4 countries. In these countries, more education is correlated with less interest in life insurance. It is also remarkable how the longevity factor manifests itself here. While longevity in the life insurance demand models figures as a positive factor, it has a negative impact on the pension fund demand model.
The remainder of the paper is organized as follows (…)
Systematic Changes in the Last Century
In this section of the article, we describe the causes and consequences of population aging, which are over time reflected in various sectors of advanced economies. As a result of population aging, there is also a change in the demand for health and social care and insurance protection.
As a result of the improving level of healthcare and technological progress, it’s expected that almost every country will experience significant population aging (Lutz, Sanderson, and Scherbov Citation2008). It is expected that the number of people worldwide aged over 60 will rise to 22% of the total population, which means a jump from 800 million people to 2 billion people. In contrast, in the last sixty years, the share of this population group rose only from 8% to 10% of the total population. It is expected that the population entering older age in 2020 is healthier and in better physical condition than the previous generation. Increasing longevity is considered one of the crucial successes in human history, but together with decreased fertility rates, it can generate serious problems for national social security systems (McKee et al. Citation2009). As a result of population aging, there is a higher burden on the social security system, which currently operates on the ongoing principle of “Pay-As-You-Go” (Fanti and Gori Citation2012). Furthermore, older people have greater health care needs than younger people which leads to higher public health care expenditures. Older people suffer more often from serious diseases that do not allow them to work for a long time, which could impose a high economic burden on their families and society (Ferlay et al. Citation2018). Because of population aging, the burden of social and health care system funding falls on a smaller and smaller part of the population. Considering the fact that like everyone else, older people need the same level of social and economic security, the decreasing number of actively working people could cause a serious systematic failure. Even today, pension systems are under great pressure and many countries are considering new retirement policies.
Last but not least, older people have slightly different health care needs than the younger population, and most health systems are not adapted to those kinds of patients and their requirements. Health systems must therefore react a different way to this new demographic reality. On the other hand, the increasing rate of longevity poses another behavioral change in society – higher saving rates and educational attainment in expectation of longer lives (Bloom et al. Citation2015). People tend to create their own financial reserves and not rely solely on the social and health system.
Due to systemic factors and the global financial crisis in Citation2008, many people have become more risk averse and have felt the fear of losing their jobs. At the same time, these fluctuations in the business cycle are expected to become more frequent. Hand in hand with the increased pace of work, as indicated by higher consumer demand, these variables may negatively impact the health of the population (Baumbach and Gulis Citation2014). In addition to the risk of death and disability, insurance companies nowadays have to respond to other phenomena, such as longevity, increased health care costs, and economic uncertainty. Today, with the help of life insurance, an individual can secure his family in case of death or disability and can also create a financial fund for when he reaches a predetermined age. Increasing living standards and more expensive lifestyles compared to the past now impose new demands on life insurance, mostly at the level of minimum financial security.
Theoretical Background and Literature Review
This section contains key empirical studies of life insurance demand and their conclusions. There are also the main determinants affecting the demand for life insurance and also the prevailing directions of their influence.
Some of the first scientific papers about life insurance demand were written by Yaari (Citation1965), Hakansson (Citation1969), Fisher (Citation1973), Pissarides (Citation1980), Campbell (Citation1980), Karni and Zilcha (Citation1986), Lewis (Citation1989), and Bernheim (Citation1991). These studies established the initial theoretical framework for interpreting the life insurance demand mechanism. Webb and Beck (Beck and Webb, Citation2003)published an analysis of demographic, economic, and institutional determinants of life insurance demand in 68 different countries around the world between 1961 and 2000. The research they carried out used panel data analysis. The investigated determinants were classified into three main groups: demographic, economic and institutional. They found that individual income, the level of banking sector development, the inflation rate and religion play a crucial role in the formation of life insurance demand.
Other publications dealing with life insurance determinants are the article entitled The Demand for Life Insurance in OECD Countries from 2007 by Li et al. (Citation2007). Authors dealt with the determinant analysis in OECD countries. Like the vast majority of the authors mentioned above, they classified the income of an individual as a positive variable influencing demand for life insurance. Other determinants with a positive impact are the number of dependent people in the family and the highest level of education attained. On the other hand, the determinant of age has proved to be a factor with a negative impact, as have the level of social security and government financial transfers to the population. When we move from the demographic and economic variables to the institutional determinants, the authors point out that the level of development of the financial services infrastructure plays a positive role. Chui and Kwok Chui and Kwok,(Citation2008examined the different influence of individualist and collectivist countries on insurance demand, and concluded that people from countries that prefer an individualistic approach have a greater tendency to own life insurance policy than people in collectivist countries. It also emerged that women are more risk-averse than men, and they also more often enter into insurance contracts. Kjosevski (Citation2012) attempted to identify the key determinants of life insurance demand in the Central and Southeast European countries in 1998–2010. As dependant variables the author used the indicator of insurance penetration and insurance density. The author found that GDP per capita, the highest education attained and the ratio of health expenditure to GDP have been identified as determinants with a significant positive impact. On the other hand, the inflation rate and the ratio of young dependency appeared to be negative factors in this study. Sliwinski, Michalski, and Roszkiewicz (Citation2013) tried to identify the key determinants of the insurance market development in Poland. In their research, they used a Principal Component analysis (PCA), connecting determinants of the same type to one variable. Their results, in many respects, coincide with those in Western-type economies, where economic factors have a significant impact on the development of life insurance demand. Outreville (Citation2015) brought a very interesting insight into the issue of education in relation to the demand for life insurance. So far, there have been two possible causal relationships where risk aversion decreases with a higher level of education, or where less risk-averse individuals choose a higher level of education. The author concludes that aversion to risk is negatively correlated with higher levels of education and human development. Study by Ertl (Citation2017) employed a dynamic panel data model for testing data set of eight countries of Central and Eastern Europe (1994–2014), investigating the relationship between insurance coverage and economic growth. He found that prior to the financial crisis in 2008/2009 economic growth had a statistically significant positive effect on growth of life insurance premiums. In the post crisis period remained GDP growth still as a significant driver of life insurance premium growth, but the magnitude of the effect decreased. Recent analysis from Montenegro by Novovic Buric et al. (Citation2017)focused on the identification of life insurance determinants and explanation of less developed insurance market compared to developed economies. Authors came with the conclusion that both level of education as well as employment positively influence demand for life insurance in Montenegro. On the other hand, there were no evidence found that life insurance demand is affected by gender, region, or different level of trust in insurance system.
Today, the risk of unemployment, indebtedness, and increased pace of work may lead to health problems, which can often result in serious illnesses or suicides Fountoulakis et al. (Citation2014). Kivimäki et al. (Citation2015) found that employees who work long hours suffer from a higher risk of stroke than those who work standard hours. They composed the findings from 25 cohort studies in Europe, the US, and Australia which included a total of 603,838 men and women. They suggested paying more attention to the management of vascular risk factors in individuals who work long hours. Ferlay et al. (Citation2018) stated that Europe has 9% of the world population, but the global cancer burden in Europe is 25%. Hazra, Rudisill, and Gulliford (Citation2018) dealt with the determinants influencing the cost of health care, posting that comorbidities (suffering from more diseases at the same time), impairments, and proximity to death are the main variables raising health care costs among older people. At the same time, the costs of comorbidity among survivors are not generally linked to age, and the additional costs in the last years of a person’s life decline with age.
To sum up, the creation of additional financial funds, either in the form of savings or life insurance, is currently justified. People create a financial pillow to secure their family in case of death or for their own life needs in retirement age. For better orientation on the influence of the discussed determinants on the demand for life insurance, summarizes the conclusions of the authors who have examined this research in recent years. It is apparent that while some results are largely similar, such as the positive impact of income, educational attainment or longevity, or the negative effects of unemployment, there are several determinants whose effects are fundamentally different across the research.
Table 1. Determinants and their historical influence on life insurance demand
shows the expected direction of action of selected determinants and their surrogate variables in relation to the demand for life insurance. Here we find variables where most studies agree on their positive impact on life insurance demand (NNI, UNI, WAP, PFA, HLT, FRT), determinants perceived as negative (UR), and those for which the conclusions are contradictory or have not yet been studied (LEX, PNS, DBT, SUI, CAN).
V4 Country Specifics
This part of the article deals with the cultural and historical similarities of the V4 countries, which in the last few decades have been gradually transformed from communist centrally planned economies into a free market economy. It can be expected that due to their similar development they will differ from the developed western economies. There is attempt of European Union to create a single financial services market for all 25 EU countries by adopting the Financial Services Action Plan (FSAP). However, this plan is still far from reality, mainly because of many regulations impeding the productive implementation of the single market (Müller-Reichart Citation2005).
Insurance markets are a sign of every advanced economy, but its role differs in transition economies which were transformed from centrally planned to free market. Given the geographical and historical similarities, V4 countries share common attributes up to the present time. Based on macroeconomic and insurance indicators, these countries could be used as a benchmark for transition economies in Central and Eastern Europe to analyze the determinants of the life insurance industry.
V4 countries were under the strong influence of the Soviet Union until the 1990s when the insurance sector was ruled by the government (Brokešová, Pastoráková, and Ondruška Citation2014). With the limitations in private ownership, the range of life insurance was strongly restricted by the government, and there was only one state-owned institution offering insurance products for companies and people in each country. These insurance companies were solely monopolistic with a negative impact on the whole insurance market (Tipurić, Pejić Bach, and Pavić Citation2008). The price of insurance offered by the insurance monopoly in socialist economies was calculated with no link to real costs, and therefore life insurance penetration remained at a very low level. Hence the insurance markets in transition countries were generally smaller in terms of volume of allocated funds, and determinants affecting their development may differ from those in advanced Western European and US countries. As a substitute for life insurance products, the state provided a social security system where “the state takes care of the citizens.” People in the communist countries were used to receiving the same level of healthcare and social care for the same price (mostly free). The government penalized anyone who refused to work, and hence the unemployment level was almost zero. This system allowed the government to redistribute social security benefits among people who did not require any life insurance protection.
However, this approach of redistribution of income (PAYG) from workers to retired people could function reliably only with compulsory participation in the system and a certain birth rate. As the birth rate has been declining recently in the V4 countries, there have been efforts to relieve the burden on this original social security system and make people save more independently. Since 1998, the privatization of pension systems has gradually started in Hungary and then in Poland in 1999, and later in the Czech Republic. The second pillar aimed to divert social security contributions from the Treasury to pension funds. In most V4 countries, however, this attempt to privatize pension savings ended in a major failure, and this has resulted in a large loss of population confidence in both pension fund institutions and the government. In Hungary, the second pillar initially enjoyed great popularity after its introduction in 1998, but the negative effects of the economic crisis in 2008 and the pressure to meet the Maastricht criteria in the area of public debt led to a return to the original Pay-As-You-Go pension system. Hungarian pension funds at that time invested about 50% of the funds in Hungarian government bonds. In an effort to reduce public debt (which amounted to 80% of GDP), the Hungarian State nationalized almost all pension fund assets, thus reducing part of its public debt. This step led to a complete loss of Hungarian confidence in the capital market in 2011 and the second pillar of pension savings. The situation in Poland was not as dramatic as in Hungary but followed a similarly negative track. Contrary to the Orbán government’s decision in Hungary to nationalize almost all second pillar assets, the Tusk government in Poland refrained from seizing shares held by Polish funds and proceeded to seize only domestic government bonds. In the Czech Republic, the second pension pillar operated from 2013 to 2015 and was then abolished due to lack of interest from savers (Musílek Citation2010). The funds were paid back to the depositors. In Slovakia, people started to save in the second pension pillar in 2005, with mandatory contributions reduced from 8% of the gross wage to 4% in 2012. However, people still have a choice here and their confidence, despite considerable political instability, has not been undermined as much as in Poland or Hungary (Naczyk and Domonkos Citation2016).
The level of education in communist economies was historically lower, with a preference for manual workers, because they were perceived as the key working group of the communist regime. Only several universities were offering higher education which was available mainly for communist party members. For instance, in 1998, 10.46% of people had tertiary education in the Czech Republic, compared to 23.79% in the OECD. Recent numbers show that in 2018, 33.33% of people had tertiary education in the Czech Republic compared to 44.48% in the OECD on average.
After the fall of the Iron Curtain, some significant systematic changes occurred in V4 countries. The level of competition increased with the easing of the political situation. However, not all changes were solely positive and the transformation process also brought new phenomena such as unemployment and the reduction of social system benefits. Furthermore, people lost their certainties which led to an increase in criminality (“European Sourcebook of Crime and Criminal Justice Statistics,” Citationn.d.). Employment opportunities were available mostly in larger towns which caused resettlement of the population. Before the transformation process, there were almost equal living conditions in the regions, but now there is a large disparity between urban and rural areas.
The transition process, without a doubt, also affected the insurance industry. New insurance companies (mainly subsidiaries of foreign parent insurance companies) started to offer insurance products, which increased competition between them. Alongside these changes, V4 countries began to integrate into international organizations like the OECD, NATO, and the European Union. Legislative harmonization had a major impact on the changes that occurred in the insurance industry. Integrated financial services supervision was instituted, which also included insurance market regulation.
shows the main macroeconomic and insurance indicators in V4 countries compared to the OECD average. We can observe that the average GDP per capita in the OECD is slightly higher than in V4 countries, but the role of insurance is much greater – $1,725 in the OECD, compared to $230 in the Czech Republic (expressed as insurance penetration and insurance density).
Table 2. Macroeconomic & insurance indicators in V4 countries in 2017
Nowadays, the development of the economies is standardized, and the level of insurance indicators is closer to the OECD countries. V4 countries, like most European countries, are currently solving the problem of population aging and falling birth rates, resulting in a higher burden on the social security system, which currently operates on the ongoing principle of “Pay-As-You-Go” (Fanti and Gori Citation2012).
It is important to emphasize these common features of the V4 countries, as we believe that these country specificities can cause determinants to have a different impact on the demand for life insurance and pension savings than the countries of Western Europe and the United States.
Empirical Analysis & Methods
This part of the article contains an empirical research. Here you can find a description of the data and the methodological procedure, as well as the final model outputs with the discussion of the results.
The empirical part is organized as follows. The data description section contains all the variables and their acronyms used in the following parts, along with a description of the empirical research methods. The benchmark model section describes the three benchmark models that we selected from a total of approximately 100 estimated models. For each explained variable, we chose just one benchmark model. The empirical section concludes with a sensitivity analysis, capturing the statistical significance of variables in one of the benchmark models.
The V4 countries generally have insufficiently long time series and therefore a more reasonable alternative to using time series analysis is to use panel regression methods which, due to the presence of another dimension, can work with shorter time series (around 17 observations). The result of the empirical part is based on one main benchmark model and two alternative ones that most closely reflect the economic reality (Wooldridge Citation2016).
Data Description
The selected variables were extracted from the OECD database (Citation2019) in the form of annual time series from the period between 1993 and 2017. The focus of this paper is to explain whether longevity, rising economic uncertainty, and stressed social and healthcare systems lead to the creation of personal financial reserves in case of death or financing post-active age.
Henceforth, life insurance density, life insurance penetration, and pension fund assets are dependent variables, representing the level of creation of financial reserves. As independent variables, we assessed unemployment rate, household debt, people with tertiary education, suicide rate, disposable income, Gini coefficient, deaths by cancer, fertility rate, pension spending, and health expenditure. An overview of all the variables, including the units in which they are measured, is provided in the list below:
PEN – life insurance penetration (% of GDP)
DEN – life insurance density (USD per capita)
PFA – Pension fund assets (% of GDP)
GI – Gini index (%)
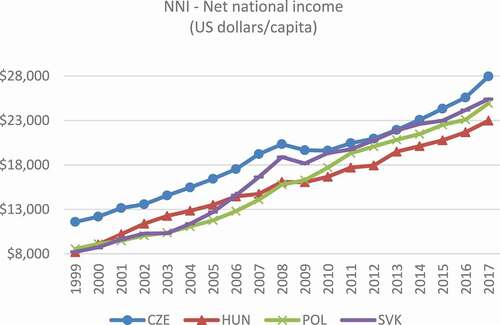
NNI – Net national income (USD per capita)
UR – Unemployment rate (%)
LEX – Life expectancy at birth (both sexes, in years)
UNI – Number of persons with tertiary education (per 1000 persons)
SUI – Suicide rate (both sexes, per 100,000 persons)
HLT – Health spending (USD per capita)
FRT – Fertility rate – (Children per woman)
PNS – Pension spending (% of GDP)
WAP – Working age population (% of population)
CAN – Death from cancer (both sexes, per 100,000 persons)
DBT – Household debt (% of net disposable income)
For a better and more detailed description of the variables, we have included tables containing basic descriptive data, as well as figures showing the progress of individual time series. in the appendix show descriptive statistics of variables by country. These tables also show that some time series are incomplete with several missing observations. Tables A5–A8 in the appendix display the the correlation matrix of variables by country to test potential multicollinearity. The in the appendix reveal the time series of a particular variable compared to the other countries. The unemployment rate (UR) points to economic instability associated with the slump in the business cycle. After 2008, the unemployment rate rose sharply in all V4 countries. The largest proportion of people without work is currently in Slovakia, where the unemployment rate has recently been above 10%.
If we look into the Appendix section at “Death by cancer” (CAR) and Suicide rate (SUI), we can see the generally decreasing trend over time. On the other hand, life expectancy is increasing, as shown by the of the variable (LE). Of the V4 countries, the highest life expectancy is measured among the people in the Czech Republic, living on average 79 years, and the lowest life expectancy is in Hungary – 75 years in 2017. Longevity (LE) results in rising health care spending in all V4 countries (HLT). However, expenditure on old-age pensions (PNS) is growing very slowly and ranges between 7% and 12% in all countries under review.
The fertility rate ( in appendix) has been steadily increasing since 2012, which could help maintain the ongoing PAYG pension funding system in the future. However, it will depend heavily on whether the increase in FRT will offset the negative impact of rising healthcare costs and the decline in the working population (WAP). We can see that the figure of the working population shows hill-shaped progress, peaking around 2008. From this point, the percentage of the working population has gradually decreased in all V4 countries. Another possible explanation of the hill-shaped progress of WAP is also the character of the indicator itself. The working age population (WAP) is the proportion of the working age population aged 15–64 who are employed. As the cost of living generally increases and many people work at a later age, they may not be included in WAP.
Although net national income (NNI) is steadily rising in practically all countries, household debt (DBT) has been at a similar level since 2008. The only country where DBT is still growing is Slovakia (41% of net disposable income in 2008 and 79% in 2017).It is evident that most funds (PFA) are accumulated in pension funds by the Poles by far. As mentioned in the previous section, both Poland and Hungary have tried to reform their pension system from PAYG to a fund-based variant, but reforms in both countries have resulted in a significant failure, as evidenced by a steep decline in 2014 (Poland) and 2010 (Hungary). It is more than clear that people in the V4 countries do not have much confidence in investment funds, as they have lost their money many times in recent history due to the unstable political situation. This is evidenced by poor pension reforms in Hungary and Poland, where depositors lost part of their money due to ineffective government intervention (Naczyk and Domonkos Citation2016).
Methodology
We created the panel of data by merging the individual time series. For this article, we used a fixed effects model, employing dummy variables for particular countries in the data set. In general, a parameter estimate of the dummy variable is part of the intercept in a fixed effects model. The function form of the one-way fixed effects model is:
where is a fixed effect specific to an individual (group) that is included in the regression, and errors are independently and identically distributed,
A fixed group effect model examines individual differences in intercepts, assuming the same slopes and constant variance across countries. Since an individual specific effect is time-invariant and considered part of the intercept, is allowed to be correlated with other regressors. That is, assumption 2 is not violated. This fixed effects model is estimated by least squares dummy variable (LSDV) regression (OLS with a set of dummies).
Benchmark & Alternative Model
Models for the three dependent variables, PEN, DEN, and PFA, are estimated using dummy variables to capture the effect of each country. we chose the Czech Republic as the default country, and the dummy variables that represent the influence of each country are D1HU – Hungary, D2PL – Poland, D3SK – Slovakia.
The benchmark model was estimated by gradual adding of variables to the model one by one, according to their economic relevance in historical studies. The exact order of the variables is shown in – Sensitivity analysis. As a benchmark model, we chose the model that most closely matches the economic reality of the V4 countries, rather than the model with the highest F-statistic value. At the same time, this model achieves a high value of the F-test, but the result of F-test was not a decisive (only additional) criterion.
Table 3. Benchmark model for life insurance penetration (PEN) in V4 countries
Table 4. Alternative model for insurance density (DEN)
Table 5. Alternative model for pension fund assets (PFA)
Table 6. Sensitivity analysis for PEN model (benchmark) in V4 countries
The relationships of the individual explanatory variables to life insurance penetration are presented in. It is noteworthy that the NNI variable, representing the wealth of economic entities, has a negative relationship with life insurance penetration. This is due to the non-aggressive pension reforms in the V4 countries, especially in Hungary and Poland, where people with increasing levels of wealth prefer to allocate their funds to other assets.
Since we used a reduced form econometric model, the causality of the interaction of variables cannot be precisely determined, as would be possible with structural models. Based on the results of the benchmark model (PEN), we believe that the conclusions correspond to the following economic logic.
From this model’s point of view, the most important factors shaping the demand for life insurance are the unemployment rate (UR), which has a negative relationship, and government spending on old-age pensions (PNS), having a positive impact. As in other countries, the conclusions seem to be similar. The security of permanent employment may be an important condition of investing in life insurance (PEN) and therefore the impact of the unemployment rate emerges as negative. However, life insurance investments are positively supported by government spending on retirement pensions (PNS), which may, on the one hand, signal an increase in pensioners’ wealth and an increased appetite for investment, but on the other hand also an expected uncertainty among older people who have doubts about the ongoing PAYG pensions and in the future expect a reduction in the amount of old-age pensions and therefore try to secure themselves differently.
The influence of the remaining statistically significant determinants mostly follows the historical findings. WAP symbolizes working age population, and increasing the age of workers may be an incentive to increase the demand for insurance coverage (PEN) according to the model. It is important to highlight the dummy variables for each country. According to findings from the previous part of the work, dealing with the specifics of the countries, it is known that inappropriate government intervention in the last decade damaged the capital markets of Poland and Hungary. Although in our model, a statistically significant variable came out only for Poland (negative influence), the same direction could be observed in Hungary. On the other hand, Slovakia (D3SK) behaves similarly to the Czech Republic, which was chosen as the benchmark.
Models with the dependent variables life insurance density (DEN) - , and pension fund assets (PFA) -, are considered as an alternative for the benchmark model PEN. The DEN model is closely similar to the PEN benchmark. Both PEN and DEN dependent variables are life insurance indicators. Alternatively, the PFA model examines the effect of determinants on the number of assets in pension funds. We can therefore conclude that this model will look at investing from a different perspective, compared to models examining the demand for life insurance.
Again, from the limited explanatory power of this reduced model, we believe that the conclusions of alternative models DEN and PFA follow the prevailing economic logic as follows. The NNI variable is significant and is consistent with the theory in the positive direction with the volume of pension fund assets. It is noteworthy that tertiary education attained (UNI) is significant in both alternative models, but it has a negative effect in the DEN model and a positive effect in the PFA model. One of the explanations could be that educated people prefer to invest through pension funds, avoiding investing in life insurance (DEN). A similar paradox is observed in the variable of life expectancy (LEX), where with increasing life expectancy, people probably demand more life insurance and invest less in pension funds. In addition, in the DEN model, there is a statistically significant pension spending variable (PNS), with a positive effect on the demand for life insurance (DEN). This could mean that the pensions paid out to residents increase their income and result in increased demand for life insurance (DEN).
Sensitivity Analysis
This section contains the sensitivity analysis capturing the overall estimation process, from which just one benchmark model was selected. The first model (Est. 1) was estimated with only one variable (NNI) and the benchmark model contains 7 variables (Est. 7). In addition, the sensitivity analysis also shows the direction of influence of individual determinants in all estimated PEN models.
The sensitivity analysis presented in shows the form of models whose dependent variable is the PEN (benchmark model). The gray highlighted model is the benchmark model described in the previous section. The model was estimated by adding independent variables according to their historical significance (according to the results of previous scientific studies). This analysis shows that investment in life insurance is largely dependent on the security of stable employment (the UR parameter is always significant and always negative). Another major change is the WAP, with the demand for life insurance rising with the share of older people in the working population. It is noteworthy that neither the NNI nor UNI variables are significant in most estimates, which is a fundamental departure from the results of the Western economies. After estimating the benchmark model (gray row), other variables HLT, FRT, DBT SUI, and CAN were gradually added to the model. However, none of them are statistically significant in the model.
Discussion & Conclusion
The V4 countries have been slowly approaching the economies of Western Europe over the past thirty years in terms of economic development and socioeconomic changes in terms of problems such as population aging, the pension system crisis, and rising health care costs. It is no longer true that their development is isolated, but it should be noted that it goes in a similar direction as most OECD countries, and the systemic problems of developed capitalist countries can also be seen here. The major problem facing the V4 countries today is the aging of the population and increased pressure on government spending. An unstable labor market situation and frequent economic fluctuations may be linked to increased work commitment and fear of financial insecurity in retirement. To ensure that citizens do not rely solely on the welfare system of the state, there are alternatives today in the form of pension funds and insurance products, which somewhat substitute the function of the state and allow people to create a financial reserve for periods of scarcity. The aim of this article was to verify which determinants may be correlated with the creation of financial reserves and whether they differ from those that are important in the developed Western economies. below shows the resulting confirmation and refutation of the tested hypotheses.
Table 7. Results of hypotheses evaluation
We believe that due to the specifics of the V4 countries, where attempts have been made to privatize the second pillar of the pension system in the past, as well as the established principles of the communist era of the last century, the results obtained are slightly different from those expected. The variables that correspond to the expected results in the main benchmark model are employment (UR) and longevity (WAP). It is assumed here that the security of stable incomes and the aging of the working population generally lead people to build up financial reserves because, thanks to stable employment, they have the resources to invest. Both variable income (NNI) and achieved tertiary education (UNI) give a very contradictory impression, thanks to the aforementioned country specifics. Using a reduced form model, we are unable to explain the correct direction of the relationship. The NNI variable is statistically significant in the benchmark model but in the opposite direction of influence compared to most of the historical findings. In an alternative model PFA, examining the demand for investment in pension funds shows NNI as statistically significant with a positive influence on PFA. Education (UNI) is not significant in the benchmark model but is significant in both alternative models and, in the same way as NNI, operates in both alternative models in different directions. Following the specifics of the V4 countries, we can assume that the educated people in V4 countries prefer to invest in pension funds instead of life insurance products. Determinants of health expenditure (HLT), indicators of youth dependency (FRT), indebtedness (DBT), and social security (SUI, CAN) were statistically insignificant.
Finally, we would like to state some limitations of this paper and point at prospective future research topics. As mentioned in the empirical section, we used data from the period of 1993 to 2017, so the most recent years are not captured here. Global data available from the OECD database were used as explanatory variables, while the analysis of questionnaire surveys and subsequent analysis using logistic regression would be the most accurate solution for the analysis of demand for life insurance and pension funds by citizens (individuals). However, in order to perform questionnaire surveys, it would be very difficult to address the right sample of respondents and also to formulate research questions correctly so that they are not misleading and instructive. Despite the above limitations of our research, we believe that it provides a clear explanation of the behavior of economic agents in relation to the demand for financial security.
Disclosure Statement
No potential conflict of interest was reported by the author(s).
Additional information
Funding
Notes on contributors
Tomas Kabrt
Tomas Kabrt is a Ph.D. Finance student at the Tilburg University in Netherlands. He graduated from the University of Economics in Prague and in 2017 he finished Ph.D. in Finance within the same institution. He also graduated from the London School of Economics and Political Science, focusing on statistical methods in social research. His research interest span quantitative analysis of insurance market, international monetary economics and demographics. Besides his university activities he is a member of the Chamber of Tax Advisers of the Czech Republic and CFE Tax Advisers Europe which is a Brussels-based association of European tax advisers.
References
- Baumbach, A., and G. Gulis. 2014. “Impact of Financial Crisis on Selected Health Outcomes in Europe.” European Journal of Public Health 24:399–403. doi:https://doi.org/10.1093/eurpub/cku042.
- Beck, T., and I. Webb. 2003. “Economic, Demographic, and Institutional Determinants of Life Insurance Consumption across Countries.” World Bank Economic Review, 17(1): 51–88. https://doi.org/https://doi.org/10.1093/wber/lhg011
- Bernheim, B. D. 1991. “How Strong are Bequest Motives? Evidence Based on Estimates of the Demand for Life Insurance and Annuities.” Journal of Political Economy 99:899–927. doi:https://doi.org/10.1086/261783.
- Bloom, D. E., S. Chatterji, P. Kowal, P. Lloyd-Sherlock, M. McKee, B. Rechel, L. Rosenberg, and J. P. Smith. 2015. “Macroeconomic Implications of Population Ageing and Selected Policy Responses.” The Lancet 385:649–57. doi:https://doi.org/10.1016/S0140-6736(14)61464-1.
- Brokešová, Z., E. Pastoráková, and T. Ondruška. 2014. “Determinants of Insurance Industry Development in Transition Economies: Empirical Analysis of Visegrad Group Data.” Geneva Papers on Risk and Insurance - Issues and Practice 39:471–92. doi:https://doi.org/10.1057/gpp.2014.1.
- Campbell, R. A. 1980. “The Demand for Life Insurance: An Application of the Economics of Uncertainty.” Journal of Finance 35:1155–72. doi:https://doi.org/10.1111/j.1540-6261.1980.tb02201.x.
- Chui, Andy C W, and Chuck C Y Kwok. 2008. ‘National Culture and Life Insurance Consumption’. Journal of International Business Studies 39(1): 88–101. https://doi.org/https://doi.org/10.1057/palgrave.jibs.8400316.
- Ertl, M. 2017. “Insurance Convergence and Post-crisis Dynamics in Central and Eastern Europe.” Geneva Papers on Risk and Insurance - Issues and Practice 42:323–47. doi:https://doi.org/10.1057/s41288-017-0043-6.
- European Science Foundation. 2010. Ageing, Health and Pensions in Europe: An Economic Perspective. http://archives.esf.org/fileadmin/Public_documents/Publications/AgeingHealthPensions.pdf
- Fanti, L., and L. Gori. 2012. “Fertility and PAYG Pensions in the Overlapping Generations Model.” Journal of Population Economics 25:955–61. doi:https://doi.org/10.1007/s00148-011-0359-7.
- Ferlay, J., M. Colombet, I. Soerjomataram, T. Dyba, G. Randi, M. Bettio, A. Gavin, O. Visser, and F. Bray. 2018. “Cancer Incidence and Mortality Patterns in Europe: Estimates for 40 Countries and 25 Major Cancers in 2018.” European Journal of Cancer 103:356–87. doi:https://doi.org/10.1016/j.ejca.2018.07.005.
- Fisher, S. 1973. “A Life Cycle Model of Life Insurance Purchases.” International Economic Review 14:132–52. doi:https://doi.org/10.2307/2526049.
- Fountoulakis, K. N., W. Kawohl, P. N. Theodorakis, A. J. F. M. Kerkhof, A. Navickas, C. Höschl, D. Lecic-Tosevski, E. Sorel, E. Rancans, E. Palova, et al. 2014. “Relationship of Suicide Rates to Economic Variables in Europe: 2000–2011.” British Journal of Psychiatry 205:486–96. doi:https://doi.org/10.1192/bjp.bp.114.147454.
- Hakansson, N. H. 1969. “Optimal Investment and Consumption Strategies under Risk, an Uncertain Lifetime, and Insurance.” International Economic Review 10:433–66. doi:https://doi.org/10.2307/2525655.
- Hazra, N. C., C. Rudisill, and M. C. Gulliford. 2018. “Determinants of Health Care Costs in the Senior Elderly: Age, Comorbidity, Impairment, or Proximity to Death?” European Journal of Health Economics 19:831–42. doi:https://doi.org/10.1007/s10198-017-0926-2.
- Karni, E., and I. Zilcha. 1986. “Risk Aversion in the Theory of Life Insurance: The Fisherian Model.” Journal of Risk and Insurance 53:606–20. doi:https://doi.org/10.2307/252966.
- Kivimäki, M., M. Jokela, S. T. Nyberg, A. Singh-Manoux, E. I. Fransson, L. Alfredsson, J. B. Bjorner, M. Borritz, H. Burr, A. Casini, et al. 2015. “Long Working Hours and Risk of Coronary Heart Disease and Stroke: A Systematic Review and Meta-analysis of Published and Unpublished Data for 603 838 Individuals.” The Lancet 386:1739–46. doi:https://doi.org/10.1016/S0140-6736(15)60295-1.
- Kjosevski, J. 2012. “The Determinants of Life Insurance Demand in Central and Southeastern Europe.” International Journal of Economics and Finance 4. doi:https://doi.org/10.5539/ijef.v4n3p237.
- Lewis, F. D. 1989. “Dependents and the Demand for Life Insurance.” American Economic Review 79:452–67.
- Li, D., F. Moshirian, P. Nguyen, and T. Wee. 2007. “The Demand for Life Insurance in OECD Countries.” Journal of Risk & Insurance 74:637–52. doi:https://doi.org/10.1111/j.1539-6975.2007.00228.x.
- Lutz, W., W. Sanderson, and S. Scherbov. 2008. “The Coming Acceleration of Global Population Ageing.” Nature 451:716–19. doi:https://doi.org/10.1038/nature06516.
- McKee, M., M. Suhrcke, E. Nolte, S. Lessof, J. Figueras, A. Duran, and N. Menabde. 2009. “Health Systems, Health, and Wealth: A European Perspective.” The Lancet 373:349–51. doi:https://doi.org/10.1016/S0140-6736(09)60098-2.
- Müller-Reichart, M. 2005. “The EU Insurance Industry: Are We Heading for an Ideal Single Financial Services Market?” Geneva Papers on Risk and Insurance - Issues and Practice 30:285–95. doi:https://doi.org/10.1057/palgrave.gpp.2510027.
- Musílek, P. 2010. “Finanční krize a jejich odezvy v institucionálních reformách: Glass-Steagall Act versus Dodd-Frank Act.” Čes. Finanč. Účetní Časopis 2010.
- “European Sourcebook of Crime and Criminal Justice Statistics.” n.d. Accessed July 10, 2019. https://wp.unil.ch/europeansourcebook/.
- Naczyk, M., and S. Domonkos. 2016. “The Financial Crisis and Varieties of Pension Privatization Reversals in Eastern Europe: East European Pension Privatization in Crisis.” Governance 29:167–84. doi:https://doi.org/10.1111/gove.12159.
- Novovic Buric, M., M. Bacovic, J. Cerovic, and M. Lipovina Bozovic. 2017. “Factors Influencing Life Insurance Market Development in Montenegro.” Periodica Polytechnica Social and Management Sciences 25:141. doi:https://doi.org/10.3311/PPso.10049.
- OECD, Organisation for Economic Co-operation and Development. “OECD Data.” OECD. 2019. https://data.oecd.org/
- Outreville, J. F. 2015. “The Relationship between Relative Risk Aversion and the Level of Education: A Survey and Implications for the Demand for Life Insurance: Relative Risk Aversion and Education.” Journal of Economic Surveys 29:97–111. doi:https://doi.org/10.1111/joes.12050.
- Pay-as-You-Go, Cambridge Dictionary. 2021.https://dictionary.cambridge.org/dictionary/english/pay-as-you-go
- Pissarides, C. A. 1980. “The Wealth-Age Relation with Life Insurance.” Economia 47:451–57.
- Sliwinski, A., T. Michalski, and M. Roszkiewicz. 2013. “Demand for Life Insurance—An Empirical Analysis in the Case of Poland.” Geneva Papers on Risk and Insurance - Issues and Practice 38:62–87. doi:https://doi.org/10.1057/gpp.2012.21.
- Tipurić, D., M. Pejić Bach, and T. Pavić. 2008. “Concentration of the Insurance Industry in Selected Transition Countries of Central and Eastern Europe, 1998–2006.” Post-Communist Economies 20:97–118. doi:https://doi.org/10.1080/14631370701865755.
- Vogel, E., A. Ludwig, and A. Börsch-Supan. 2017. “Aging and Pension Reform: Extending the Retirement Age and Human Capital Formation.” Journal of Pension Economics and Finance 16:81–107. doi:https://doi.org/10.1017/S1474747215000086.
- Wooldridge, J. M. 2016. Introductory Econometrics: A Modern Approach. Sixth edition, Student edition. Boston, MA: Cengage Learning
- World Bank. 1994. Averting the Old Age Crisis: Policies to Protect the Old and Promote Growth. Summary. The World Bank. doi:https://doi.org/10.1596/0-8213-2970-7.
- Yaari, M. E. 1965. “Uncertain Lifetime, Life Insurance, and the Theory of the Consumer.” Review of Economic Studies 32:137–50. doi:https://doi.org/10.2307/2296058.
Appendix
Table A1. Descriptive statistics – Czech Republic
Table A2. Descriptive statistics – Hungary
Table A3. Descriptive statistics – Poland
Table A4. Descriptive statistics – Slovakia
Table A5. Pearson correlation matrix – Czech Republic
Table A6. Pearson correlation matrix – Hungary
Table A7. Pearson correlation matrix – Poland
Table A8. Pearson correlation matrix – Slovak Republic
Figure A1. Variable DEN (1999–2017).
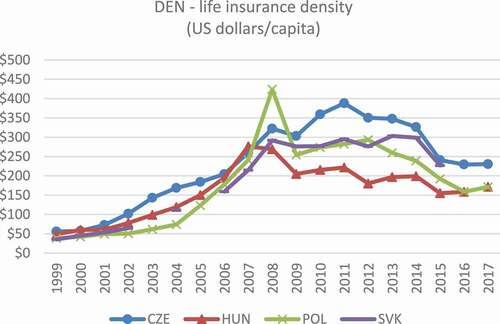
Figure A2. Variable PEN (1999–2017).
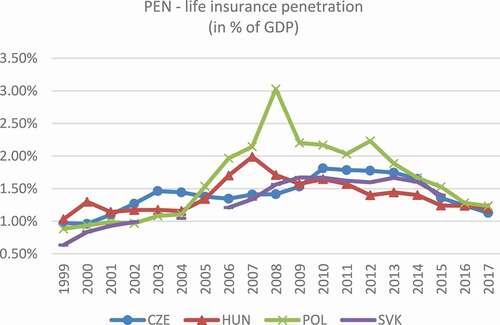
Figure A3. Variable PFA (1999–2017).
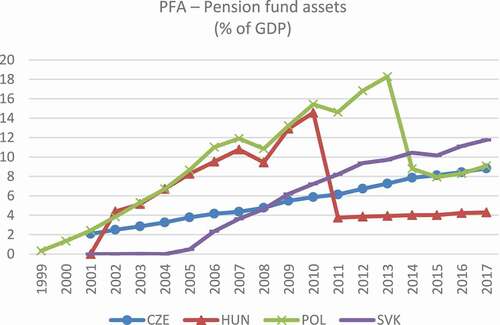
Figure A4. Variable GI (1999–2017).
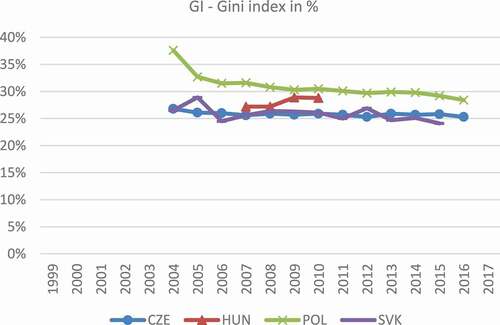
Figure A5. Variable UR (1999–2017).
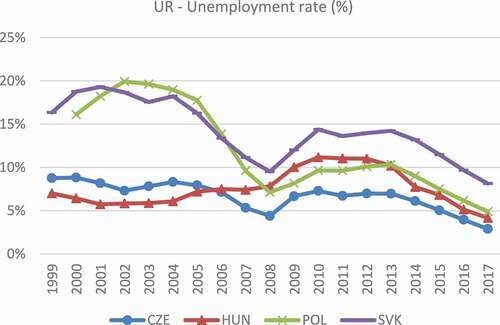
Figure A6. Variable LE (1999–2017).
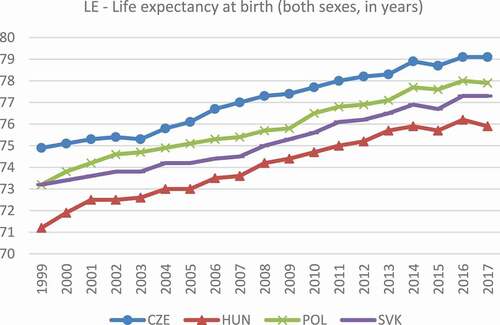
Figure A7. Variable SUI (1999–2017).
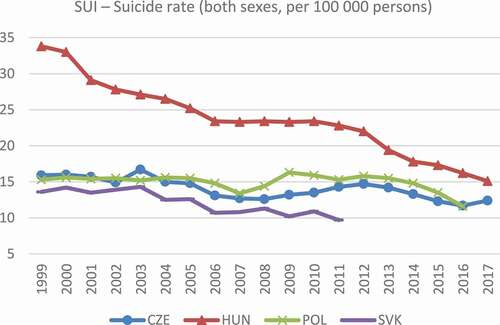
Figure A8. Variable CAN (1999–2017).
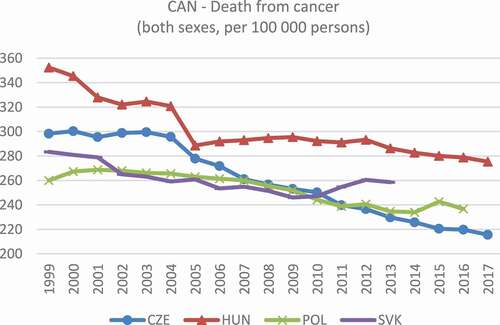
Figure A9. Variable DBT (1999–2017).
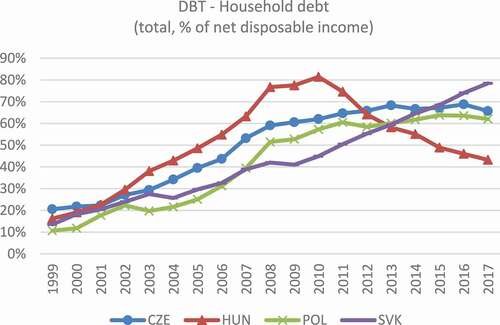
Figure A10. Variable HLT (1999–2017).
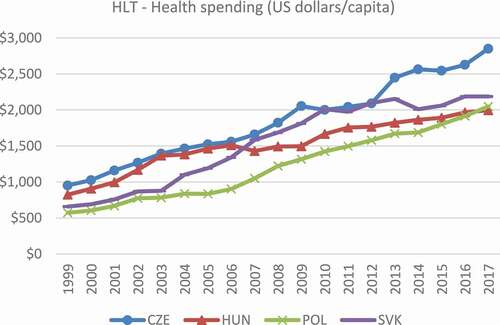
Figure A11. Variable FRT (1999–2017).
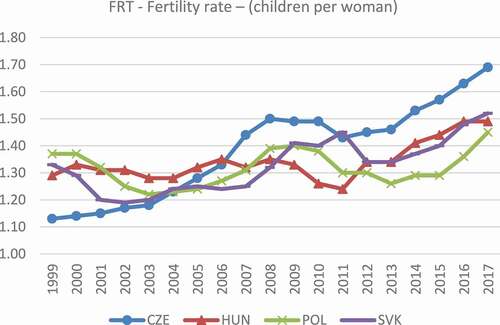
Figure A12. Variable UNI (1999–2017).
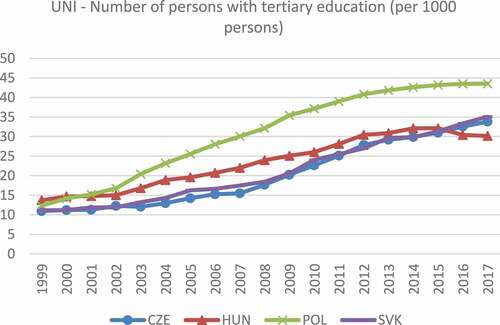
Figure A13. Variable PNS (1999–2017).
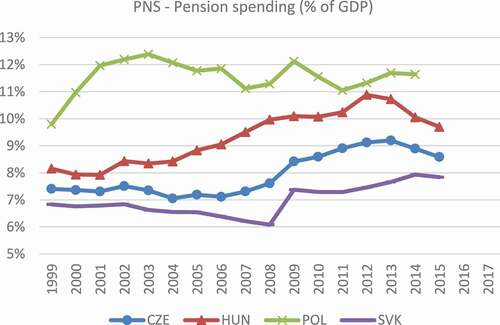
Figure A14. Variable WAP (1999–2017).
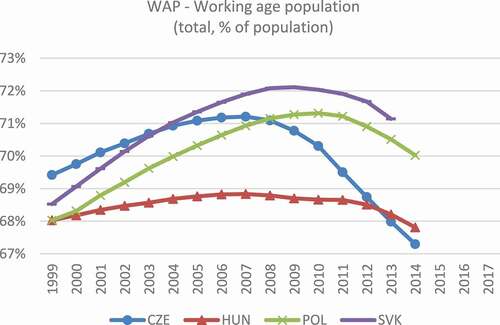
Figure A15. Variable NNI (1999–2017).