?Mathematical formulae have been encoded as MathML and are displayed in this HTML version using MathJax in order to improve their display. Uncheck the box to turn MathJax off. This feature requires Javascript. Click on a formula to zoom.
ABSTRACT
This paper examines the impact of two government measures in the Czech Republic and the Slovak Republic: the number of passengers transported by rail and the kilometers traveled. Eurostat data were used to develop an autoregressive integrated moving average (ARIMA) statistical model for capturing the time-series trend. The results confirm statistically significant differences in the Slovak Republic after introducing fare-free public transport (FFPT). Passenger-transport volumes increased by 449,000 quarterly; passenger-kilometer volumes increased by 23.2 million. A similar government intervention – in the Czech Republic – was statistically insignificant. Passenger-transport volumes increased by 1.17 million and passenger-kilometers increased by 42.9 million quarterly; but compensation to railway operators increased by 763%.
Introduction
Government subsidies that are provided for public transport are a frequent topic of discussion in parliaments and governments in developed and transition economies, and some governments have spent large sums on these subsidies. This paper discusses the positive and negative impacts of introducing transport subsidies for socially disadvantaged groups in two transition economies (Czech Republic and Slovak Republic) in Central and Eastern Europe (CEE), and based on time-series modeling and trend identification.
Many economic policy instruments have various impacts on private companies and state-owned enterprises, and many measures are populist with a debatable impact on the population and the state budget. Some countries, including Estonia, Luxembourg, and Poland, have attempted to introduce fare-free public transport (FFPT), which is often called zero-fare public transport, or “public transport funded in full by means other than collecting fares from passengers.” FFPT is common in Europe and globally as it continues to grow, and may be funded by national, regional, or local government through taxation or by commercial sponsorship of businesses.
Sometimes, introducing public transport as fare-free is solely a political choice but, more importantly, FFPT does helps decrease loneliness for a growing elderly population group in all societies (Hulten, Citation2019). As part of “Measures to improve people’s living standards,” the Slovak Republic Parliament introduced FFPT for certain population groups, such as children, students, and pensioners, and this measure entered into force in November 2014 (Government Office of the Slovak Republic Citation2012). Free travel became valid on all ZSSK (Slovak Republic railways) trains, with the exception of the higher category of Inter-City trains, and the government reimburses train operators for FFPT (Railway company Slovakia ZSSK, Citation2014).
A similar public advantage was prepared in the Czech Republic. To maintain competition on the railways, a 75% discount on fares for the aforementioned population groups was introduced in the document, “Introduction of a new fare discount on trains and buses for seniors, children, pupils and students” (Government of the Czech Republic Citation2018). The principle of the discount in the Czech Republic was to supplement the fare for children, students under 26 years of age, and a range of pensioners (including disabled, old-age, widowed, widower pensioners). The discount began to be widely applied in September 2018. However, the impact of introducing both measures was contradictory. The popularity of both governments (Czech Republic and Slovak Republic) among disadvantaged population groups increased, but the positive consequences of the changes are debatable.
Several research studies (Mohring Citation1972; Cats, Susilo, and Reimal Citation2017; Modijefsky Citation2018; Köllinger Citation2021) have investigated the effects of introducing budgetary compensations for specific population groups. However, to my knowledge, few studies have determined causal conclusions about statistically significant impacts, despite this topic’s obvious political and economic importance. Thus, this paper models the time series before and after introducing fare discounts for selected socially disadvantaged groups in passenger rail transport in these two countries. This study uses a long-term data set covering 24 quarters (6 years) before, and 25 quarters (6.25 years) after introducing discounts in the Slovak Republic; plus 40 quarters (10 years) before, and nine quarters (2.25 years) after introducing discounts in the Czech Republic. This period allows for a relatively long-range analysis, in order to provide more precise information on the implications of economic policies.
This paper is structured as follows. Section 2 provides a literature overview, while Section 3 includes processing methods and time data. Section 4 presents statistical processing to identify statistically significant differences, and compare trends after introducing discounts on rail fares. Section 5 discusses the results, and Section 6 presents the conclusions, while limitations and recommendations for further directions appear in the final section.
Literature Review
The Czech Republic and the Slovak Republic, both of which formerly constituted Czechoslovakia, experienced dramatic change at the end of the twentieth century, and the fall of communism in November 1989, during the so-called Velvet Revolution (i.e. nonviolent transition from communism to a Western type of democracy for the first time since 1939), prompting socio-economic changes. The Velvet Revolution established a new political system, and the Czechoslovak economy experienced deregulation, privatization, reduced subsidization, and private marketization. In addition to the societal benefits of innovation, productivity, and economic freedom, the changes also created inequality between national regions and social groups.
Thus, the fall of communism, followed by the creation of two independent states, the Czech Republic, and the Slovak Republic, affected the economy and transportation systems (Pucher Citation1999). The car industry strengthened its position, while public transport usage fell across formerly socialist countries in the European Economic Community (EEC), due to the rapid growth in car ownership and the unfavorably high costs of public transport, due to the increased labor costs. Most countries’ governments, e.g. Poland, the Czech Republic, Hungary, reacted to the new situation by mitigating the deficit with a subsidy scheme (Pucher Citation1995).
Since then, public transport subsidy policies have been adopted everywhere in developed and transition countries. Despite various arguments and motivations behind such policies, there are two central premises: (1) fulfilling public transport’s social function by increasing accessibility and affordability for disadvantaged groups (e.g. the elderly, disabled, students, those without driver’s licenses, low-income households) while avoiding problems of social exclusion (Small Citation1992; Quinet and Vickerman Citation2004); (2) increasing public transport by reducing externalities that are associated with the rise of car usage (Hulten, Citation2015). Notably, those externalities (e.g. congestion, limited parking, greenhouse gas emissions, pollution, and noise) pose urban transport challenges, especially for capital and large cities overall (van Gent and Rietveld Citation1993; Serebrisky et al. Citation2009; Basso and Silva Citation2014; Fielbaum, Jara-diaz, and Gschwender Citation2016). Hence, authorities have expected that subsidizing public transport would turn the mode of transport away from private operators (Modijefsky Citation2018; Hulten van Citation2019; Köllinger Citation2021).
Another frequently discussed motivation for transport subsidies is that increased travel volumes lead to supply response as a positive externality, in that a higher frequency leads to scheduling cost decreases that are associated with new and existing travelers (Börjesson, Eliasson, and Rubensson Citation2020). Finally, public transport is characterized by economies of scale, that are based on a relationship between inputs and the total volume of output power (Turečková and Nevima Citation2020). Marginal costs are below average, therefore, marginal cost pricing results in deficits that are counterbalanced by subsidization (van Goeverden et al. Citation2006), hence, economies of scale are advantageous.
There is an extensive body of literature and research on subsidies and their related aspects. The theory of Turvey and Mohring (Citation1975) is that the optimal price for scheduled bus services consists of the producer’s marginal cost, plus the difference between the user’s marginal and average costs. The Mohring (Citation1972) effect showed that public transit operations should be subsidized by minimizing the sum of transit users’ costs (their time) and operators’ costs. Moreover, the theory of Jansson (Citation1979) verifies that the value of passenger time is many times higher than the value of transit time, and the absolute values of total user costs are much higher in passenger transport than in freight transport.
Thus, the author of the present paper, chose to investigate the positive and negative impacts of introducing public transport subsidies for socially disadvantaged populations groups, within two transition economies: the Czech Republic and the Slovak Republic.
However, this paper is not the first to focus on public transport subsidies, because a comprehensive body of literature exists that justifies them, in favor of economic efficiency arguments. Many of the pioneering studies in public transport have been reviewed in books by Nash (Citation1982), and later by Berechman (Citation1993) and Gwilliam (Citation2008). Those authors have published extensive economic and policy overviews of the problems associated with public transportation, and they are leading sources of information on rail deregulation.
The empirical literature provides evidence on user preferences for different public transport modes and transfers in large networks (Hensher and Golob Citation2008; Garcia-Martinez et al. Citation2018). Some studies have argued that the final transport performance (i.e. actual passenger flows and passenger-kilometers) reflects the ultimate economic motive behind service provision (De Borger, Kerstens, and Costa Citation2002). The final transport performance is useful to measure the efficiency of the transport service provider’s service offerings (Small and Verhoef, Citation2007). Notably, there is an urgent need to subsidize private monopoly railways in a thriving economy e.g. UK. (Shaoul Citation2007).
As most arguments state, subsidies can compensate for externalities within the economic system (Pakšiová Citation2020). Many studies in the field, especially in CEE (Pucher Citation1990, Citation1993, Citation1998), date back to the twentieth century, and debate the impact of policies and behavior changes within the transport industry. Economic policy is by no means in confined to an experimental model environment with overly optimistic expectations, but is rather always implemented within the real-time conditions that are present in the country (Macgregor Pelikánová Citation2019). The number of transported persons and the level of services in individual states can also influence nonpolitical decisions in a non-satisfactory way (see Bockova and Doubravský Citation2021).
A 17-year study by Bly and Oldfield (Citation1986) on the effects of public transport subsidies on supply and demand, identified a correlation between year-on-year changes in subsidy and operating indicators, resulting in an increasing number of subsidized operated services and reduced fares. Those authors calculated that each additional 1% of the cost covered by a subsidy probably, attracts an increase in passengers in the range of 0.2%–0.4%. Nevertheless, they also discovered the connection between increased subsidies, unit costs, and wages, along with reduced output per employee.
Frankena (Citation1973) has argued that all subsidies have a distribution effect on income; thus, many authors, such as Pucher (Citation1981) and Gurria and Gollin (Citation1986), have focused on the distributive and social dimensions of subsidies within public transport, but mainly in developed countries. In the late 1970s and early 1980s, alternative goals regarding social welfare and profit functions were more frequently discussed than they are today. In cases where the goal is to improve the situation of mobility for impaired people, like in the UK, free bus rides only tackle one part of their problem. Free transport can only contribute to improving mobility for disabled people if the entire package of such measures is in place (Fearnley Citation2013). Mobility is a crucial aspect of social stratification, to the extent that, more generally, “transport disadvantage” is intimately tied up with social exclusion (Calder Citation2010). Nash (Citation1978), Nash (Citation1982) examined the maximization of passenger and car miles that are subjected to budget constraints, and also considered another management objective: revenue maximization under a zero-profit condition. When fares are high, revenues are reinvested in providing excess mileage, so that profits eventually fall to zero. More recently, authors such as Asensio et al. (Citation2003) and Börjesson, Eliasson, and Rubensson (Citation2020) have added to the body of research on this topic.
Transport policy has frequently examined the cost recovery rate of fare revenues (i.e., the level of public transport subsidization), and national policies have a natural desire to develop subsidy rules that can determine the optimal financial contribution from the public budget. The primary mechanism of the optimal subsidy is determined by the starting point of the cost recovery theorem of Mohring and Harwitz (Citation1962). The complicated Swiss subsidy reviews by Andersen (Citation1993) included the future of cheap fares, by comparing Swiss with Scandinavian developments. Finally, the comprehensive body of literature has mainly focused on the redistribution of resources due to a congested pricing system (Eliasson and Mattsson Citation2006; Kristoffersson, Engelson, and Börjesson Citation2017; West and Börjesson Citation2020), in contrast to the lack of analyses with a focus on the incidence of transit subsidies.
Data and Methodology
In this study, the empirical research results were used to model the development trend of person-kilometers, and the number of transported passengers in the Czech Republic and the Slovak Republic, after the introduction of FFPT and fare subsidy. The author used quarterly data on passenger transport by rail as person-kilometers and the number of transported passengers (as provided by Eurostat), with data on passengers transported quarterly between 2009Q1-2019Q4Footnote1 (Eurostat Citation2021), including the impact, of introducing the fare subsidy, on the trend. The autoregressive integrated moving average (ARIMA) model with independent variables was used to create prediction models of future, assuming that the data would form a time series, thus allowing the author to assume that values were correlated. ARIMA modeling uses three kinds of processes, which are: the autoregressive (AR) process, the moving average (MA) process, and the integrated process; while the assumptions for ARIMA models are sufficient observations and stationarity (which can be interpreted as steady probabilistic behavior). The autocorrelation function (AFC) and partial autocorrelation function (PACF) show the relationships between values of a series that are separated by a given number of periods. The ARIMA model is considered by the automatic procedure, detecting detects outliers, interpolating missing values, and calculating the calendar effects. For series with no more than 360 observations, the results were found to be satisfactory for slightly more than 90% of the series, which is excellent regarding whitening of the series and the capture of seasonality (Maravall, Pavon, and Canete Citation2016). The ARIMA model is highly successful among various models which are based on time series analysis (Cai, Wang, and Huang Citation2013). Smeral and Wuger (Citation2008) used time-series techniques and econometric approaches to quantify the effects in the ARIMA model. It has a time-series intervention model, that filters out special effects via outlier detection methods, maps any influence from trends in the model, and depicts the effect(s) of business trends. However, this finding violated an assumption of the classical linear model. Moreover, the series in the present study was expected to be non-stationary; hence, the classical model was inconsistent and completely misleading. The ARIMA allowed the author to model the endowment effect as a predictor of the series studied.
The ARIMA is described as follows:
where
p is the number of autoregressive terms,
d is the number of nonseasonal differences needed for stationarity, and
q is the number of lagged forecast errors within the prediction equation.
Hence, the author first differentiated the time series, and then focused on the seasonal component in order to identify the model.
where the fact that AR and MA processes are usually within the bounds of 2, often applies
The process of determining the values of p, d, and q in the best way for a given statistic is further discussed in later sections of the notes (whose links are the highest on this page). However, a preview of a number of the kinds of nonseasonal ARIMA models that are commonly encountered appears below:
ARIMA (1,0,0) = first-order autoregressive model: if the series is stationary and autocorrelated, perhaps it is often predicted as a multiple of its previous value, plus a continuation. The forecasting equation during this case is
where Y is regressed on itself, lagged by one period, and often an “ARIMA (1,0,0) +constant” model. If the mean of Y is zero, then the constant term would not be included.Footnote2
A suitable ARIMA adjustment can be (1,1,0); differenced first-order autoregressive model: If the errors of a random walk model are autocorrelated, perhaps the problem can be fixed by adding one lag of the dependent variable to the prediction equation (i.e., by regressing the first difference of Y on itself, lagged by one period, yielding the following prediction equation:
rearranged to
This is a first-order autoregressive model with one order of nonseasonal differencing and a constant term (i.e., an ARIMA (1,1,0) model).
ARIMA models are estimated using the Box-Jenkins method (Box et al. Citation2015), consisting of three steps:
Identification and selection of the order of the model. This part of the analysis determined what values of orders p, d, q, and P, D, Q, respectively, should be set. Here, the analysis of autocorrelations and partial autocorrelations of the investigated time series were used.
Estimation of regression coefficients, usually by the method of maximum likelihood, testing the model, especially the stationarity of its residuals. The ARIMA model described complex time-series behavior, incorporating classical regression, and extending it with time-series specifics.
Testing the model, especially the stationarity of its residuals.
Four variables were processed to create the model (see ).
Table 1. List of variables.
SPSS software was used to process the statistical calculations.
Results of the Estimation
The time series was examined during the period of 2009Q1–2019Q4, and each state was marked with the introduction date of student and pensioner benefits (for descriptive statistics, see Appendix 1). The times series modeler was set up using outliers with a local trend definition for the first time, see .
Table 2. Outliers model_1, ARIMA (0,0,0) (0,0,0).
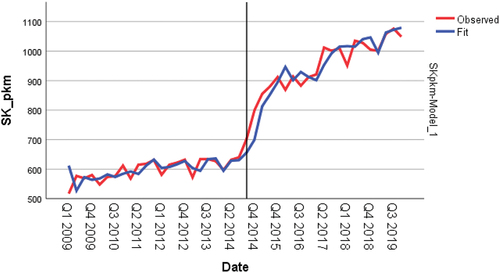
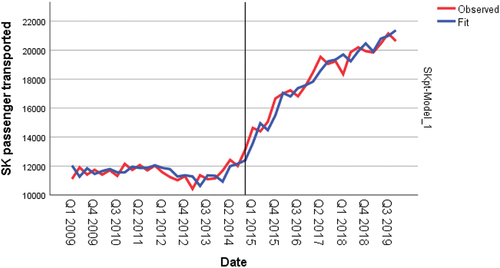
After the first modeling, Slovakian (SK) passengers transported and passenger-kilometers were statistically significant, but the respective variables for Czechoslovakian (CZ) passengers were not. However, pure heteroscedasticity did not exist (i.e., after specifying the correct model and yet author observe non-constant variance in the residual plots), so the author added an accounts receivable process. Residuals were still not pure, so the seasonal component of ARIMA (1,0,0) (1,0,0) was added to the model. Thus, the local trend was highly significant for the variable SK passengers transported (see ). Immediately after introducing FFPT, SK passengers transported increased by 11.38% quarter-on-quarter, marking a change in the observed trend. shows the effect of the trend change. Each quarter, the number of SK passengers transported increased by 449,779. According to , the trend was zero until 2014Q4, when FFPT was introduced. After the policy intervention, the number of passenger-kilometers increased by 23.219 million (13.7%).
Table 3. Time-series modeling results for fare subsidies in the Czech Republic and the Slovak Republic.
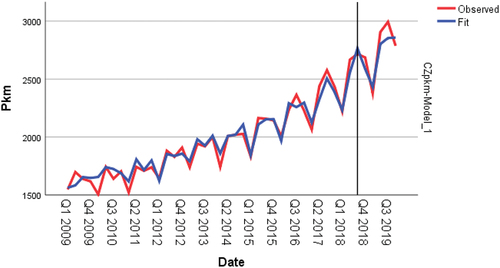
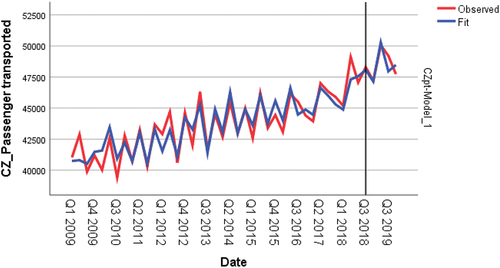
For the time series of values from the Czech Republic, a further modification of the ARIMA model was performed using differencing in ARIMA (1,1,0) (1,0,0). The values of the statistics appear in . The local trend was statistically insignificant in the Czech Republic for both variables. Only a level shift change was identified, with a one-time increase of 1,171,335 passengers transported in 2018Q4 compared to 2018Q3. The number of CZ passenger-kilometers increased by 42.893 million, but the effect was statistically insignificant (p-value = 0.401). Thus, the policy intervention induced a modest increase in the number of passengers transported (2.6%), and the number of average CZ passenger-kilometers increased by 1.87%, but only in the quarter when the fare subsidy was introduced.
Between 2018Q3 and 2018Q4, the number of CZ passenger-kilometers decreased by 1.1%, while in the following quarters, the average number of passenger-kilometers decreased (see ). The final model of the impact of introducing FFPT in the Slovak Republic appears in , including SK passenger-kilometers, while shows SK passengers transported. Accordingly, the turning point in passenger railway transport occurred in 2014Q4 when the FFPT project was launched.
Figure 1. The Czech Republic: Rate of growth (%, CZK billion).
Similarly, the present author investigated whether the impact on passenger railway transport in the Czech Republic was statistically significant. The quarter introducing the fare subsidy was 2017Q3, when the 75% discount was introduced in the Czech Republic on 1st September, 2018. summarizes the results of the statistical model.
The impact of the introduction of a fare subsidy was statistically insignificant for CZ passengers transported and CZ passenger-kilometers. summarizes the results of the statistical model. Next, the present author calculated the ARIMA model’s criteria and other relevant diagnostic tests, including the Bayesian information criterion (BIC) value, and other criteria indicated in . MAPE – indicates the percentage change by how much the assumptions of the present study were wrong, on average. Regarding the percentage of variance between the selected data and the model that this study managed to explain by way of the model, is in good agreement.
Table 4. Criteria and relevant diagnostic tests to the variables.
The significance of the Ljung-Box test is common in with respect to the test strength values. Residuals are statistically independent. The Ljung-Box test is statistically insignificant for all models, hence the residue correlation hypothesis cannot be rejected; hence, the selected models can be considered correct.
A model of the time series, during the period of 2009–2019, for the number of CZ passenger-kilometers with the impact of the introduction of a 75% discount on fares for students and pensioners appears in , while shows CZ passengers transported. Both figures show that in contrast to the Slovak Republic, the CZ passenger railway transport trend has continued to grow, even without introducing fare subsidies. The creation of the CZ model involved a transformation through a level shift and by introducing a seasonal component. The final model of ARIMA (AR [1]; AR, seasonal [1]) appears in .
Results
According to the literature search results, the introduction of discounts in passenger transport, compensated to operators from the state budget, promotes an increase in the number of passengers transported, passenger-kilometers, and operators’ financial results. The varied approaches to discounting in different countries (Yusak and Cats Citation2014; Modijefsky Citation2018; Mobilité Gratuite Au Luxembourg Citation2020), have not allowed for a comparative and consistent assessment approach toward the impact of policy interventions.
However, the Czech Republic and the Slovak Republic presented a unique opportunity to compare the effect of a similar policy decision on countries with similar economic developments over a period of many years. Hence, it was critical to conduct a transparent empirical assessment, in order to educate the research community. The paper has dealt with time-series modeling before and after introducing FFPT and fare compensation for disadvantaged groups in the countries studied. The present author conducted time-series modeling in the period of 2009Q1–2019Q4, in order to identify the statistically significant impact of a particular intervention, that was intended to provide transport options for pupils, students, and pensioners in both countries, at a significant discount or free of charge. Missing fare revenues were compensated in the case of the Slovak Republic, but only to the state transport operator. In the case of the Czech Republic, fare compensation was given to both state and private operators (see ).
Table 5. Amount of compensation paid in the Slovak Republic and the Czech Republic (€).
To compare the number of people benefitting from fare subsidies in the two countries studied, this author converted the figures into percentages, relative to the total population. The Slovak Republic required registration for FFPT, and by the end of 2015, almost 1 million people had registered (see ). Moreover, the estimated number of registered users by the end of 2020 was just over 1 million. The introduction date of FFPT on railways was November 2014.
Table 6. The number of people who benefited from fare subsidies (%).
Comparatively, changes introduced by the Czech government, providing 75% discount for pupils and students aged between 6 and 26 years and persons over 65 years, were applied to bus and train transport (Government of the Czech Republic Citation2018). The discounts were applied to all domestic rail lines, with no differentiation between carriers. shows that a larger group in the Czech Republic was eligible for the discount, since registration was not required (only an ID or student card was needed to qualify). The fare discount for pupils, students, and pensioners on public bus and rail transport began in September 2018. The discount was provided via compensation awarded directly to the individual carrier, which then claimed the compensation bonus from the Ministry of Transport CZ (Citation2018).
Data on passenger-kilometers and the number of passengers transported in quarterly time series from 2009Q1 to 2020Q4 were taken from Eurostat (Citation2021). Due to the uniqueness of year 2020, with a shutdown in the Czech Republic and the Slovak Republic in March due to the COVID-19 pandemic, only data up to 2019Q4 were used. The introduction of the subsidy was marked on the quarterly time series. The present author used an independent samples t-test to determine statistically significant differences (see Appendix 2), and the developed descriptive statistics (see Appendix 1). The test criteria and diagnostic tests appear in .
The year-on-year change in the number of passengers carried, passenger-kilometers, the evolution of subsidies (until 2018Q2), and the compensatory fare discounts provided by the state budget to the four most important carriers in the country, are shown in . The number of CZ passengers transported increased by 3.55% between 2017 and 2018, and fare compensations (burdening the state budget) to operators increased by 763% (see ). In 2019, fare compensations to operators grew while the number of passengers transported, and passenger-kilometers decreased. As of 1st January, 2020, the Ministry of Transport CZ set a cap on what carriers pay in fares. Since introducing the rebates (2018Q3), €118 million has been paid to rail operators over a 12-month period. Under the government’s new proposal, the rebate will be reduced to 50%, a reduction of € 77,440 K in the 2022 state budget deficit (Ministry of Transport CZ, Citation2022).
The growth rate of passenger railway transport in the Slovak Republic and the development of the compensation provided to the only state operator in the Slovak Republic – Železniční společnost Slovensko (ZSSK) – appears in . The subsidies provided to ZSSK range between €204 million and €300 million throughout the period under review. confirms that the number of SK passengers transported increased by 23.36%, and the volume of SK passenger-kilometers increased by 34.65% in 2015.
Figure 2. The Slovak Republic: Rate of growth (%, € billion).
In what follows is an explanation of why the introduction of FFPT on the state railway in the Slovak Republic has made pupils, students, and pensioners travel more than before. For pupils and students who commute to schools on a daily basis, the free rail fare provided an impulse to leave the bus or commercial rail and move to rail travel. For them and their families, this move meant savings in the amount of tens of Euros a month. Similarly, it allowed pensioners to save tens of Euros a month by changing the mode of transport. In the Czech Republic, however, the change came at the same time as the start of the school year, when pupils and students must travel to schools, in any case. Unlike in the Slovak Republic, however, they did not have to choose only the railways, but could stay with the commonly-used operators. From the point of view of comparing GDP per capita in 2014, when the FFPT was introduced in the Slovak Republic, the difference between the Czech Republic (€15,480) and the Slovak Republic (€13,600) was 12.1%. In 2018, the Czech Republic reached €17,990 and the Slovak Republic reached €15,510 GDP per capita. The difference between the two countries widened to 13.8%. The lack of interest in making greater use of the fare discount in the Czech Republic can, therefore, be interpreted as meaning that a higher standard of living in the Czech Republic allows students and pensioners to travel by car or use a shared economy. However, any other reasons are difficult to identify at a later stage, as the choice of mode of transport is subjective for each individual.
Conclusions
This paper discussed the impacts of introducing subsidies for the public transport of socially disadvantaged groups in two transition economies (Czech Republic and Slovak Republic). Although politicians generally expect social policies to boost living standards, there is still a political debate on the effectiveness of these taxpayer-funded public interventions. Scholars (Mohring Citation1972; Serebrisky et al. Citation2009; Cats, Susilo, and Reimal Citation2017; Štraub Citation2020) have identified that FFPT is effective if it increases the standard of living or reduces the environmental burden on the environment. However, if FFPT or other fare subsidies lead to a long-term burden on the public budget, these support policies may be considered unsuccessful in the long run.
To draw adequate conclusions about the effectiveness of FFPT in the Slovak Republic and the fare discount for the selected group in the Czech Republic, the author evaluated specific impacts on the number of passengers carried and the number of kilometers traveled. This empirically-based research can serve as important feedback for future policy adjustments.
The findings of this study are threefold. Firstly, the results show that the SK government’s intervention in rail fares via FFPT has positively affected the number of SK passengers transported and passenger-kilometers, signaling a positive effect of the government’s programme. The developed ARIMA time-series model showed a statistically significant effect of FFPT on the number of SK passengers transported and SK passenger-kilometers. The number of SK passengers transported increased by 23.36% year-on-year in 2015, and the total value of SK passenger-kilometers increased by 34.65%.
In contrast, the impact of CZ fare compensation was not statistically significant. The only change was a shift in the level, with a one-time increase in the number of CZ passengers transported in 2018Q4 by 1,171,335, compared to 2018Q3. The number of CZ passenger-kilometers increased by 42.8 million. The shift of public transport to rail travel has had a positive effect, as the frequency of train travel has increased by up to 14 times in the Slovak Republic (Garai Citation2019), where a decrease in passenger car travel is expected.
Secondly, another result is the impact on the state budget, which is questionable. While in the Czech Republic the system compensated all operators for student and pensioner fares regarding the proven use of transport, in the Slovak Republic, transport for socially disadvantaged groups was free of charge, based on registration in the system. In 2017, the Czech Republic compensated €5.012 million in passenger rail transport, while in 2018 €42.589 million was spent on these compensations from the state budget (Ministry of Transport CZ, Citation2019b). Thus, in the Czech Republic, the introduction of a 75% discount resulted in the transfer of significant funds from the public state budget to the state operator’s budget, České dráhy, a.s. and private operators, such as RegioJet, a.s., LeoExpress a.s., and ARRIVA (Ministry of Transport CZ, Citation2022). Comparatively, in the Slovak Republic, the cost of FFPT for railways was the highest in 2018, when it reached €300 K (ZSSK Citation2019).
Thirdly, the other result is passenger discrimination. When the Slovakian Republic only allowed FFPT for passenger rail transport, it created an artificial demand for travel (ZSSK, Citation2020b). Hence, many passengers used trains only because the fare was free of charge (Žarnovnický, Citation2016). Thus, bus passengers and patrons without train service experienced discrimination. In contrast, the Czech Republic also compensated bus operators with no discrimination in the choice of public transport.
Hence, the the Czech Republic system has several advantages over the Slovakian system. Notably, neither passengers nor carriers have experienced discrimination in the Czech Republic, which has not distorted the quality of the competitive environment since public and private operators began receiving compensation. However, the introduction of FFPT has harmed private carriers in the Slovak Republic, that are not entitled to compensation; hence students and pensioners preferred to use the state-owned ZSSK. Thus, a question for further research is whether or not there is a more effective and targeted way to support selected population groups, in pursuit of raising the population’s standard of living since, from the perspective of students and pensioners, tens to hundreds of euros have been saved, per individual.
Limitations
A limitation of this study is that it has a narrow focus.
Given the time-series data on the evolution of revenues and bonuses of individual carriers, it would be interesting to focus future research on identifying the interdependence of the profits paid to the state budget as the equivalent of compensatory discounts granted from the state budget to individual carriers
Moreover, it would be appropriate to extend the analysis period to include the years both countries were crippled by the COVID-19 pandemic and include subsequent years.
In both countries, the COVID-19 pandemic lifted restrictions on the provision of rebates and compensation.
Acknowledgments
LIPREAL, Ltd financially supported this research
Disclosure Statement
No potential conflict of interest was reported by the author(s).
Additional information
Notes on contributors
Nina Bočková
Nina Bočková, Ph. D. is a postdoctoral fellow at the Faculty of Business Administration of the Prague University of Economics and Business. Her research interests are in lie in the determination of R&D investments and subsidy policy. She has published one paper in an academic journal with IF and eight original papers in peer-reviewed scientific journals indexed by SCOPUS or WoS. She has recently started to address the issue of subsidy policy and its impact on entrepreneurship.
Notes
1. Data for 2020 are available, but the effects of the COVID-19 pandemic have affected the time series results
2. If the slope coefficient ϕ1 is positive and fewer than 1 in magnitude (it must solely be 1 in magnitude if Y is stationary), the model describes mean-reverting behavior, during which the next period’s value should be predicted to be ϕ1 times as distant from the mean as this period’s value. If ϕ1 is negative, it predicts mean-reverting behavior with an alternation of signs, i.e., it also predicts that Y is going to be below the mean next period if it is above the mean in this era.
3. The exchange rate as of 31st December of the relevant year was used to convert the CZK exchange rate
References
- Andersen, B. 1993. “A Survey of the Swiss Public Transport System and Policy.” Transport Reviews 13 (1): 61–81. doi:10.1080/01441649308716835.
- Asensio, J., A. Matas, and J. L. Raymond. 2014. ”Redistributive Effects of Subsidies to Urban Public Transport in Spain.” Transport Reviews 23 (4): 433–52. doi:10.1080/01441647.2002.10823176.
- Basso, L.J., and H.E. Silva. 2014. “Efficiency and Substitutability of Transit Subsidies and Other Urban Transport Policies.” American Economic Journal: Economic Policy 6 (4): 1–33. doi:10.1257/pol.6.4.1.
- Berechman, J. 1993. Public Transit Economics and Deregulation Policy. North Holland: Elsevier. doi:10.1016/C2009-0-08990-9.
- Bly, P.H., and R.H. Oldfield. 1986. “The Effects of Public Transport Subsidies on Demand and Supply.” Transportation Research Part A: General 20 (6): 415–27. doi:10.1016/0191-2607(86)90078-6.
- Bockova, N., and K. Doubravský. 2021 Impact of Covid-19 on passenger-kilometers in Selected European Countries. In: Kotlanová, E. (ed.) Proceedings of International Conference Economic and Societal Challenges of the European Economy (Covid and Post-Covid Period). Karviná: Silesian University, pp.28–38. 9788075104885. 9788075104885.
- Börjesson, M., J. Eliasson, and I. Rubensson. 2020. “Distributional Effects of Public Transport Subsidies.” Journal of Transport Geography 84. doi:10.1016/j.jtrangeo.2020.102674.
- Box, G. E. P., G. M. Jenkins, G. C. Reinsel, and G.M. Ljung. 2015. Time Series Analysis: Forecasting and Control, 5th. Hoboken: John Wiley & Sons.
- Cai, T., X. Wang, and S. Huang. 2013 „ A Chinese New Year Aware ARIMA Model for Electricity Consumption Forecast. In: Zheng, F. (ed.) Proceedings Of The 2013 International Conference On Advanced Computer Science And Electronics Information (ICACSEI 2013). Paris: ATLANTIS PRESS, pp. 385–87. 19516851. 19516851.
- Calder, G. 2010. “Mobility, Inclusion and the Green Case for Basic Income.” Basic Income Studies 4 (2): 1–10. doi:10.2202/1932-0183.1181.
- Cats, O., Y.O. Susilo, and T. Reimal. 2017. “The Prospects of fare-free Public Transport: Evidence from Tallinn.” Transportation 44 (5): 1083–104. doi:10.1007/s11116-016-9695-5.
- Czech Social Security Administration. 2020. “Pensioners in the Czech Republic.” Accessed February 11, 2021. https://www.cssz.cz/documents/20143/99428/duchodci_v_cr_v_casove_rade.pdf/c75ba336-7353-69a0-7595-eb4d027db7dd.
- De Borger, B., K. Kerstens, and A. Costa. 2002. “Public Transit Performance: What Does One Learn from Frontier Studies?” Transport Reviews 22 (1): 1–38. doi:10.1080/01441640010020313.
- Eliasson, J., and L. Mattsson. 2006. “Equity Effects of Congestion Pricing. Quantitative Methodology and a Case Study for Stockholm.” Transportation Research Part A 40 (7): 602–20. doi:10.1016/j.tra.2005.11.002.
- Eurostat. “Passenger Transported. Passenger Transport by Type of Transport.” Accessed May 14, 2021. https://ec.europa.eu/eurostat/databrowser/view/rail_pa_typepas/default/table?lang=en.
- Fearnley, N. 2013. “Free Fares Policies: Impact on Public Transport Mode Share and Other Transport Policy Goals.” International Journal of Transportation 1 (1): 75–90. doi:10.14257/ijt.2013.1.1.05.
- Fielbaum, A., S. Jara-diaz, and A. Gschwender. 2016. “Optimal Public Transport Networks for a General Urban Structure.” Transportation Research. Part B, Methodological 94:298. doi: 10.1016/j.trb.2016.10.003
- Frankena, M. 1973. “Income Distributional Effects of Urban Transit Subsidies.” Journal of Transport Economics and Policy 7 (3): 215. http://search.proquest.com/docview/1302779303/.
- Garai, Tomáš. 2019. “Odkedy Sú Vlaky Zadarmo, Dotácie Narástli O 51 Miliónov” Finweb, August 5 2019. Acessed January 31, 2020. https://finweb.hnonline.sk/ekonomika/1984959-odkedy-su-vlaky-zadarmo-dotacie-narastli-o-51-milionov.
- Garcia-Martinez, A., R. Cascajo, S.R. Jara-Díaz, S. Chowdhury, and A. Monzon. 2018. “Transfer Penalties in Multimodal Public Transport Networks.” Transportation Research Part A: Policy and Practice 114:52–66. doi: 10.1016/j.tra.2018.01.016
- Government Office of the Slovak Republic. 2012. “100 Najdôležitejších Opatrení Vlády Roberta Fica Prijatých Od Roku 2012.” Accessed February 11, 2021. https://www.vlada.gov.sk//100-najdolezitejsich-opatreni-vlady-roberta-fica-prijatych-od-roku-2012/
- Government of the Czech Republic. 2018. “Resolution of the Government of the Czech Republic of 27 March 2018 N. 206.” Accessed December 2, 2021. https://apps.odok.cz/attachment/-/down/RCIAAXKAR554.
- Gurria, J. C., and A. A. Gollin. 1986. “Net Tax Incidence for Public Transport Subsidies in New Zealand.” Transportation 13 (4): 319–28.
- Gwilliam, K. 2008. “A Review of Issues in Transit Economics.” Research in Transportation Economics 23 (1): 4–22. doi:10.1016/j.retrec.2008.10.002.
- Hensher, D., and T. Golob. 2008. “Bus Rapid Transit Systems: A Comparative Assessment.” Transportation 35 (4): 501–18. doi:10.1007/s11116-008-9163-y
- Hulten van, M. 2015. “Fare Free Public Transport as a Growth Factor: Fare-Free Public Transport (FFPT)”. SAXION School of Governance, Law a Urban Studies. Accessed November 4, 2021. https://freepublictransport.info/wp-content/uploads/sites/7/2015/07/Fare_Free_Public_Transport_Dr_Michel_van_Hulten.pdf.
- Hulten van, M. 2019. “Get on the Bus: The Case for Free Public Transport” Accessed November 2, 2021. https://apolitical.co/en/solution_article/get-onthe-bus-the-case-for-free-public-transport.
- Jansson, J. O. 1979. “Marginal Cost Pricing of Scheduled Transport Services: A Development and Generalisation of Turvey and Mohring’s Theory of Optimal Bus Fares.” Journal of Transport Economics and Policy 13 (3): 268–94.
- Köllinger, Claus. 2021. “Estonia’s Free County Public Transport Did Not Fulfill Goals.” Eltis, March 23 2021. Accessed December 15, 2021. https://www.eltis.org/in-brief/news/estonias-free-county-public-transport-did-not-fulfill-goals.
- Kristoffersson, I., L. Engelson, and M. Börjesson. 2017. “Efficiency Vs Equity: Conflicting Objectives of Congestion Charges.” Transport Policy 60:99–107. doi: 10.1016/j.tranpol.2017.09.006
- Macgregor Pelikánová, R. 2019. “Harmonization of the Protection against Misleading Commercial Practices: Ongoing Divergences in Central European Countries.” Oeconomia Copernicana 10 (2): 239–52. doi:10.24136/oc.2019.012.
- Maravall, A., R.L. Pavon, and D.P. Canete. 2016. “Reg-Arima Model Identification: Empirical Evidence.” Statistica Sinica 26 (4): 1365–88. doi:10.5705/ss.2014.189t.
- Ministry Of Transport. 2019b. “Changes in Fare Discounts: Reimbursement Will Have Its Ceiling.” Ministry of Transport October 31 2019. Accessed January 25, 2022. https://www.mdcr.cz/Media/Media-a-tiskove-zpravy/Zmeny-ve-slevach-na-jizdne-Proplaceni-bude-mit-sv.
- Ministry Of Transport. 2022. Discounts in Public Transport of 50% Will Help to Reduce Budgetary Compensations by One Third. Accessed January 25, 2022. https://www.mdcr.cz/Media/Media-a-tiskove-zpravy/Slevy-ve-verejne-doprave-budou-50-procent,-vydaje?returl=/Media/Media-a-tiskove-zpravy.
- Ministry of Transport CZ. 2018. “From Saturday, September 1, Fare Discounts for Students and Seniors Will Apply.” Ministry of Transport August 29 2018. Accessed February 11, 2021. https://www.mdcr.cz/Media/Mediaa-tiskove-zpravy/Od-soboty-1-zari-zacnou-platit-slevy-jizdneho-pro.
- Ministry of Transport CZ. 2019a. “Amount of Compensation for state-mandated Discounts for Students and Seniors Divided by Individual Carriers for Each Calendar Month from September 2018”. Ministry of Transport December 13 2019. Accessed May 12, 2021. https://www.mdcr.cz/Ministerstvo/Zadost-o-poskytnuti-informace-(1)/Poskytnute-informace/Vyse-kompenzaci-za-statem-narizene-slevy-pro-stude?lang=cs-CZ.
- Mobilité Gratuite Au Luxembourg. 2020. “Transports publics gratuits depuis le 01/03/20.” Accessed December 11, 2021. https://mobilitegratuite.lu/mobilite-gratuite/.
- Modijefsky, M. 2018. “Estonia Launches the Largest Free Public Transport Scheme in the World.” Eltis, July 18 2018. Accessed January 11, 2022. https://www.eltis.org/discover/news/estonia-launches-largest-free-public-transport-scheme-world.
- Mohring, H. 1972. “Optimization and Scale Economies in Urban Bus Transportation.” The American Economic Review 62 (4): 591–604.
- Mohring, H., and M. Harwitz. 1962. Highway Benefits: An Analytical Framework. Evanston: Transportation Center at Northwestern University.
- Nash, C.A. 1978. “Management Objectives, Fares and Service Levels in Bus Transport.” Journal of Transport Economics and Policy 12 (1): 70–85. https://www.jstor.org/stable/20052491?seq=1#metadata_info_tab_contents.
- Nash, C. A. 1982. Economics of Public Transport. New York: Longman.
- Němec, J. 2021. “Data From: Compensation for Discounts in Public Transport.” Ministry of Transport of the Czech Republic. Accessed February 2, 2021. https://www.mdcr.cz/Ministerstvo/Zadost-o-poskytnuti-informace-(1)/Poskytnute-informace/Statistika-kompenzaci-slev-ve-verejne-doprave?lang=cs-CZ.
- Pakšiová, R. 2020. “Business Costs Arising from Protectionism, Corruption and Other Non-market Restrictions on Free Trade”. Paper presented at the European Forum of Entrepreneurship 2020: Protectionism - Protection or Destruction of National Economies? (p. 121–28). Brno: NEWTON College.
- Pucher, J. 1981. “Equity in Transit Finance: Distribution of Transit Subsidy Benefits and Costs among Income Classes.” Journal of the American Planning Association 47 (4): 387–407. doi:10.1080/01944368108976521.
- Pucher, J. 1990. “Capitalism, Socialism, and Urban Transportation Policies and Travel Behavior in the East and West.” Journal of the American Planning Association 56 (3): 278–96. doi:10.1080/01944369008975773.
- Pucher, J. 1993. “The Transport Revolution in Central Europe.” Transportation Quarterly 47 (1): 97–113. https://babel.hathitrust.org/cgi/pt?id=uc1.c104685622&view=1up&seq=107.
- Pucher, Jo. 1995. “The Road to Ruin?: Impacts of Economic Shock Therapy on Urban Transport in Poland.” Transport Policy 2 (1): 5–13. doi:10.1016/0967-070X(95)93241-P.
- Pucher, J. 1998. “Urban Transport in Germany: Providing Feasible Alternatives to the Car.” Transport Reviews 18 (4): 285–310. doi:10.1080/01441649808717020.
- Pucher, J. 1999. “The Transformation of Urban Transport in the Czech Republic, 1988–1998.” Transport Policy 6 (4): 225–36. doi:10.1016/S0967-070X(99)00023-2.
- Quinet, E., and R. Vickerman. 2004. Principles of Transport Economics. Cheltenham: Edward Elgar.
- Railway company Slovakia (ZSSK). 2014. “Conditions of Departure of Passengers Entitled to Free Transport from 17.11.2014.” Accessed February 11, 2021. https://www.zssk.sk/fileadmin/dokumenty/2014_pdf/Podmienky_vypravenia_bezplatnych_cestujucich_od_17112014.pdf.
- Serebrisky, T., A. Gómez-lobo, N. Estupiñán, and R. Muñoz-raskin. 2009. “Affordability and Subsidies in Public Urban Transport: What Do We Mean, What Can Be Done?” Transport Reviews 29 (6): 715–39. doi:10.1080/01441640902786415.
- Shaoul, J. 2007. “Leasing Passenger Trains: The British Experience.” Transport Reviews 27 (2): 189–212. doi:10.1080/01441640600907024.
- Small, K. A. 1992. Urban Transportation Economics. U.S: Harwood Academic Publishers.
- Small, K. A., E. T. Verhoef, and R. Lindsey. 2007. The Economics of Urban Transportation, 2th. London: Routledge.
- Smeral, E., and M. Wuger. 2008. “Methods for Measuring the Effects of the EU Presidency on International Tourism.” Tourism Economics 14 (2): 313–24. doi:10.5367/000000008784460454.
- Štraub, D. 2020. “The Effects of Fare-Free Public Transport: A Lesson from Frýdek-Místek (Czechia).” Sustainability 12 (21): 9111. doi:10.3390/su12219111.
- Turečková, K, and J. Nevima. 2020. “The Cost Benefit Analysis for the Concept of a Smart City: How to Measure the Efficiency of Smart Solutions?” Sustainability (Basel, Switzerland) 12 (2663): 2663. doi:10.3390/su12072663.
- Turvey, R., and H. Mohring. 1975. “Optimal Bus Fares.” Journal of Transport Economics and Policy 9 (3): 280–86. https://www.jstor.org/stable/20052415?seq=1#metadata_info_tab_contents.
- van Gent, H.A., and P Rietveld. 1993. “Road Transport and the Environment in Europe.” Science of the Total Environment 129 (1–2): 205–15. doi:10.1016/0048-9697(93)90171-2.
- van Goeverden, C., P. Rietveld, J. Koelemeijer, and P. Paul. 2006. “Subsidies in Publicї Transport.” European Transport, Institute for the Study of Transport within the European Economic Integration 32:5–25. https://citeseerx.ist.psu.edu/viewdoc/download?doi=10.1.1.526.4244&rep=rep1&type=pdf.
- West, J., and M. Börjesson. 2020. “The Gothenburg Congestion Charges: Cost-benefit Analysis and Distribution Effects.” Transportation 47 (1): 145–74. doi:10.1007/s11116-017-9853-4.
- Yusak, O. S., and O. Cats. 2014. “Exploring Key Determinants of Travel Satisfaction for multi-modal Trips by Different Traveler Groups.” Transportation Research Part A: Policy and Practice 67:366–80. doi: 10.1016/j.tra.2014.08.002
- Žarnovický, M. 2016. “Two Years of Fico’s Free Trains: A Chance to Change.” Dennik November 19, 2016. Accessed December 05, 2021.https://dennikn.sk/blog/611594/dva-rokyficovych-vlakov-zadarmo-premarnena-sanca-na-zmenu/.
- ZSSK. 2014. “Annual Administration 2013.” Accessed December 05, 2021.https://www.zssk.sk/fileadmin/dokumenty/2014_pdf/VS_ZSSK_SK_2013.pdf.
- ZSSK. 2015. “Annual Administration 2014.” Accessed December 05, 2021.https://www.zssk.sk/fileadmin/dokumenty/2015_pdf/VS_ZSSK_2014_schv.akc.pdf.
- ZSSK. 2016. “Annual Administration 2015.”Accessed December 05, 2021. https://wwwzssk.sk/fileadmin/Dokumenty2/2016_pdf/VS_2015_SK.PDF.
- ZSSK. 2017. “Annual Administration 2016.” Accessed December 05, 2021. https://www.zssk.sk/fileadmin/dokumenty/2017_pdf/vyrocna_sprava_zssk_2016_a.pdf.
- ZSSK. 2018. “Annual Administration 2017.” Accessed December 05, 2021.https://www.zssk.sk/fileadmin/dokumenty/2018_pdf/VS_ZSSK_2017_SK_web1.pdf.
- ZSSK. 2019. “Annual Administration 2018.” Accessed December 05, 2021.https://www.zssk.sk/wp-content/uploads/2019/08/Vyrocna-sprava_SK_2018_FINAL_WEB.pdf.
- ZSSK. 2020a. “Annual Administration 2019.” Accessed December 05, 2021.https://www.zssk.sk/wp-content/uploads/2020/08/Vyrocna-sprava_SK_2019_FINAL_WEB.pdf.
- ZSSK. 2020b. “The Number of Paying Rail Passengers Has Been Growing for Four Consecutive Years.” Accessed December 07, 2021. https://www.zssk.sk/aktuality/pocet-platiacich-cestujucich-na-zelezniciach-rastie-uz-styri-roky-po-sebe/.
Appendix 1
Appendix 2
Appendix 3. Time Series Model SKpkm.
Appendix 4. Time Series Model SKpt.
Appendix 5. Time Series Model CZpt.
Appendix 6. Time Series Model CZpkm.