
 ?Mathematical formulae have been encoded as MathML and are displayed in this HTML version using MathJax in order to improve their display. Uncheck the box to turn MathJax off. This feature requires Javascript. Click on a formula to zoom.
ABSTRACT
The BRICS countries are known to be a key market for foreign direct investment. This paper analyzes the decision of EU acquirers from developed economies to invest in the energy sector in BRICS countries. Using empirical evidence on 4,222 cross-border M&As and fuzzy logic, the research results show that acquirers consider macroeconomic factors as significant. When choosing a company located in the BRICS, its audit status is significant, but financial returns are not. This fact indicates that for sustainable decisions, industry is importantly correlated with financial information quality but not with company performance.
Introduction
Since the 2000s, the emergence of the economies of Brazil, Russia, India, and Republic of China, a group known by the BRIC abbreviation, have attempted to catch the attention of the entire world. On April 13, 2011, in Beijing, South Africa became part of the group (although there were voices that contested this decision). Since that point, international organizations have recognized the BRICS group in their reports (Fletcher Citation2011). The rapid expansion of some of the economies contained therein made them very attractive to investors around the world. This aspect is mainly reflected in the amount of foreign direct investment (henceforth FDI), that has flowed into their economies. In 2022, Algeria, Argentina, and Iran applied for membership in BRICS. There are also potential candidates such as Saudi Arabia, Turkey, Egypt, and Afghanistan. If accepted, the new proposed BRICS members would create an entity with a GDP 30% greater than USA, over 50% of the global population, and in control of over 60% of global gas reserves (Devonshire-Ellis Citation2022).
Cross-border mergers and acquisitions (CBM&As) represent a key part of FDI and they are motivated by a wide range of expected outcomes, such as the need for specialized resources or the multinational companies market expansion (henceforth MNEs) (Gregory and O’Donohoe Citation2014; Moeller and Schlingemann Citation2005; Very and Schweiger Citation2001), especially in emerging markets. Firstly, the proof in this direction is their growth in volume and number in recent years, especially in the BRIC countries, Eastern Europe, and Africa. The countries in the first group are among the most attractive markets in the world for these business concentrations (Bekaert and Harvey Citation2017; Smimou Citation2015).
Secondly, rapid economic growth may be unsustainable due to pressure on environmental systems, foreclosing options for the future (May Citation2008). The evolution of emerging economies is due to the inflows and outflows of FDI, but has shifted towards a focus on sustainability. Many countries are using green energy projects to attempt to protect their climate and several others have shut down carbon power plants (Ali et al. Citation2018). Andriuškevičius and Štreimikienė (Citation2021) showed in their research that the focus on sustainable development in the energy industry has led to an increase in M&A activities.
The entry decision in a cross-border business concentration is a dual one and involves two steps: choosing a country and then choosing a company. Given the recent interest in sustainable development and the consequences of COVID-19 lockdowns, which led to a decrease in CO2 emissions, companies which intend to invest in CBM&As are focusing on the environment and population countries prosperity associated to target company (Raghavendra et al. Citation2022). MNEs investment decisions is also a global countries commitment to follow a new “post-2015” era of sustainable development (Fuso Nerini et al. Citation2019). This fact is reflected in the United Nation’s (UN) 17 Sustainable Development Goals and international agreements hoping to protect the environment such as the Paris Agreement on Climate Change. Likewise, the European Union (EU) has had an interest in energy climate influence, climate change, and environmental strategies. As a response to Paris Agreement, this reaction could be expressed through companies’ investments from the more developed economies of the EU.
In today’s economic context, emerging markets are considered important for developed economies investment decision making-process. This study focuses on CBM&As involving EU companies as investors and BRICS companies as targets. In this research it is considered the targets financial potential and their environmental commitment, as presented in the Europe 2020 Strategy. The paper also analyzes the BRICS companies’ investment potential, considering the financial data as influencing factors for the CBM&As investment decisions in energy sector compared with others. The analyzed sample includes 4,222 CBM&As involving European acquirers and BRICS targets. As independent variables, macroeconomic factors related to target countries sustainable approach (human development index – HDI and CO2 emissions) and microeconomic ones (financial information which describes the target company attractiveness for investment) are considered.
Based on recent references from the literature on choosing the energy sector compared to other sectors, the research questions (RQ) are addressed as follows:
RQ1:
In the case of BRICS countries, how do environmental and social factors influence the target companies’ choice from the energy sector, compared to other sectors?
RQ2:
In the case of companies located in BRICS countries, do financial factors have a significant contribution in choosing an investment in the energy sector?
The paper objective is focused on explaining the factors that lead MNEs to invest in energy-sector target companies compared to other sectors, in the case of BRICS countries. The analysis starts from a macroeconomic perspective to a microeconomic one. Firstly, the MNEs choice is explained by their attitude toward the environment and population prosperity. The choice for BRICS can be explained by the fact that, in 2021, China and Brazil were among the leading countries for renewable energy development, followed by India.
Secondly, after choosing the country, the acquirers’ expectations regarding the financial status of the target companies located in BRICS are reflected in a series of financial indicators (return on equity, return on capital employed, the growth rate of stock market capitalization), in the transparency regarding their investors, and in their audit status. The latter adds positive synergy to the growth strategy of an investor, given the fact that the audit opinion enhances the quality of the financial information publicly presented by the companies.
The main contribution of this paper is represented by the substantiation of sustainable decision to invest in one of the BRICS countries using fuzzy logic, based on financial performance and audit opinion, as strategic one taking into account financial information 3 years before the M&As. The acquirers must follow EU’s flagship projects, including “Resource-efficient Europe” which addresses actions to decouple economic growth from the use of resources, transition to a low-carbon economy, greater use of renewable energy sources, modernization of transport, and promotion of energy efficiency (Pomykala and Szelag Citation2022).
The first part of the paper reviews the literature, taking into account the following aspects: the strategic or speculative nature of investments in the energy sector and the presentation of the influencing factors of MNEs’ decision to invest or not in the energy sector in the BRICS countries. The second part includes the presentation of the research methodology and design (data used, analysis models, population, and sample to be analyzed). The third part is dedicated to the results and discussions of the study.
Energy Markets and Investment in the Energy Market in the BRICS
History shows that the energy sector has had a great impact on the development of communities and economies, on living standards, and on the overall quality of life. Due to its importance, it has been an intrinsic part of economic development and consequently has had an interesting evolution over the years.
Energy needs were modest prior to the industrial revolution. The evolution of the steam engine during the 17th and 18th centuries opened the possibilities for industry to develop. Furthermore, in the 19th century, the need for energy increased due to coal-powered steam engines, electric generators, and hydroelectric plants. In the 20th century, massive power stations, large coal mines, hydroelectric plants, power lines, and nuclear power plants were the key driving forces of energy production and accessibility. This evolution, although it responded to the economic needs of countries, has led to climate problems and, organically, to a need for a sustainable approach to all economic processes. The explanation is relatively simple: economic development needed energy, but energy consumption led to climate change, thus a change in the attitude toward the environment of both the countries and the companies was necessary. Although for over a century, fossil fuel energy was the driver of economic growth, in recent years, we have seen political pressure for the development of the renewable energy sector.
Traditionally, the energy industry consists of companies engaged in the exploration, production, refining, marketing, storage, and transportation of oil and gas, coal, and other consumable fuels, according to the Global Industry Classification Standard. Nowadays, the energy sector includes nonrenewable and renewable energy.
There is a difference between renewable and sustainable energy. The concept of renewable energy is related to natural sources of energy that regenerate (wind, solar, and hydropower). Sustainable energy is linked to the concept of a low-carbon economy, and both countries and companies are looking for ways to reduce pollution. We are currently witnessing a shift in energy sources from fossil (high carbon energy) to non-fossil (low carbon energy). For example, at the moment nuclear energy is sustainable energy because it produces zero CO2, but it is not renewable because uranium ore has a limited capacity to produce energy and becomes a waste over time. If scientists find a way to extract uranium from seawater instead of ore, there is a possibility for nuclear energy to be considered renewable.
In order to stimulate economic growth and improve the living conditions of the population, many countries have sacrificed the environment in exchange for economic development (Shah, Arjoon, and Rambocas Citation2016; Onofrei et al. Citation2020). But blindly following the economy, many ignored the environmental cost and caused a significant increase in energy consumption, leading, as we will demonstrate, to a huge increase in CO2 emissions and climate change that seems difficult to stop (Wang, Jiang, and Zhan Citation2019).
During the COVID-19 lockdowns, the global CO2 emissions have decreased by only 5% (Dlugokencky and Tans Citation2020). These results have been confirmed by world organizations and have raised an alarm about the high need for countries to invest more in renewable energies. The data in suggests that the need for fossil fuels will decrease and investment in renewable energy will increase until 2050.
Table 1. Forecast of worldwide electricity generation by different energy sources (in trillion kilowatt hours).
The data presented in shows that, worldwide, the future trends are inclined toward low-carbon energy sources (nuclear and renewable) which will register an increase of 166.42% compared to 2020. Also, at that point in the future, these sources of energy will represent approximately 48.94% of the world’s total energy sources. Their implementation is a major lever for decarbonizing the energy sector and mitigating the effects of climate change (Sinsel, Yan, and Stephan Citation2019), a fact that is confirmed by the data presented.
Considering the trends of the future, as presented in , investing in the energy sector can be a challenge, if the acquirers expect both synergies and a sustainable approach regarding the environment and the well-being of the population. On the one hand, there are the fuel-based companies. Despite their instable prices, the negative influence on the environment and the fluctuant price of the raw materials, they base their activity on already existing plants, reducing the investment in technologies (Fernandes, Cunha, and Ferreira Citation2011). On the other side, renewable energy sources are a necessary condition to achieve sustainable development, despite the high costs for a spread use. Anyway, many companies decide to invest in energy, using CBM&As or greenfield investments, a decision which starts with the choice for a specific country. The choice for BRICS can be grounded in their massive potential for investment, being the world’s most fast-growing economies. Usually, the authors who decide to analyze BRICS countries use macroeconomic indicators to compare them, in order to explain their ascension or their economic growth. India was the country of interest for authors Prakash and Kumar (Citation2017), who analyzed studies regarding the influence of macroeconomic indicators on the foreign direct investment (FDI) in this country, compared to the other members of the group. The choice for comparing the BRICS countries in purchasing power parity terms is discussed by Güriș and Tiraşoğlu (Citation2018), who assert that PPP approach is valid for Brazil and South Africa, but not valid for Russia, India, and China. This macroeconomic indicator was also used by Su et al. (Citation2012), who consider it valid for all the countries, and by Chang, Lee, and Hung (Citation2012), whose findings lead to the conclusion that PPP is not valid for Brazil but valid for the rest of the BRIC group.
The importance of the BRICS countries, which make them so appealing for the investors, can be reflected in GDP and GDP growth rates (Ogujiuba Citation2020). With a total GDP of 24.712,19 billion dollars in 2021, 20.785,61 billion dollars in 2020, compared to 21.166,82 in 2019, these five countries count for 25,72% in 2021, 24,55% in 2020 and 24,17% in 2019, respectively, of global GDP (World Bank Citation2022a, Citation2022b).
FDI, as an external way of investing, remains the largest and most constant form of financing, for developing economies – compared with portfolio investments, remittances, and official development assistance (UNCTAD Citation2017) and companies from around the world are targeting BRICS markets for future expansion. As a proof, we note that FDI inflows in BRICS countries represented 25,9% of the world’s FDI in 2019 and 19,7% in 2020 (UNCTAD Citation2021). CBM&As account for the majority of the FDI inflows, which justifies the purpose of our current study.
Given their potential, BRICS countries have not only the possibility to be leading economies but financial centers as well, if they can truly leverage their stance. All in all, the general idea is that investors with long-time horizons should look to the emerging economies of the BRICS as the markets to invest in the form of FDI. Since CBM&As are receiving/investing amounts representing a big part of FDI, it is thus insightful and highly relevant to conduct research to determine what is at stake for investors to purchase shares in companies that are resident in BRICS countries. Obviously, as a result of the conflict in Ukraine, the position of the Russian Federation can be questioned, as a member of the BRICS group, as a provider of fossil fuel or as a target country for EU investors.
Brazil is the fifth-largest country in the world and the largest in South America. It re-ported a GDP decrease of −23.06%, in 2020, and an increase of 11.03% in 2021, up to 1.61 trillion dollars, which made it occupy the 12th position in the world ranking of GDP (World Bank, Citation2022). Its place in the group of world’s most notorious emerging economies is due to low inflation rates, fast growth of key economic sectors, and increased FDI (Ardichvili et al. Citation2012).
Ranking 11th on the world ranking based on GDP, with a decrease of 12.09% in 2020, and an increase of 19.46% in 2021 (from 1.49 trillion dollars to 1.78 trillion dollars), and ninth in the world population evidence, Russian Federation has roughly 16 mil Km2 and a density of population of 9 P/Km2. The country consolidated, over the years, a strong position as an important fossil fuel supplier, being the world’s third-largest oil producer behind the United States and Saudi Arabia. Russia was also the world’s largest exporter of oil to global markets and the second largest crude oil exporter behind Saudi Arabia. Although its influence in Europe was diminished by Germany and Norway, there were some key events between Russia and China – long-term energy contract in 2013 and the “Polar Silk Road Initiative” proposed in 2017 – which may lead to the obvious conclusion that these two countries will belong to the same community in the future (Wang, Fan, and Zhou Citation2022). The relations between the two countries were consolidated at the meeting in Samarkand, Uzbekistan, on September 16th, 2022, when Vladimir Putin and Xi Jinping reiterated their alliance.
Since the second half of 2021, the energy prices in the EU and worldwide increased and there are powerful players who use energy as bargaining chips to influence international relationships. Furthermore, the price of fuels has risen as a consequence of Russia’s aggression against Ukraine, started on February 24, 2022, negatively affecting the security of energy supply in the EU. Russia’s decision to suspend gas deliveries to Bulgaria and Poland also impacted the situation.
Industry, religion, geography, and many other aspects make India a country of great diversity. From a long-run perspective, India’s current development challenges and policies could be quantified since 1950 when the country gained its independence. Its rapid growth started in the early 1990s and can be considered an economically sustainable way, characterized by no serious macroeconomic crises, low inflation, and natural resources (World Bank, Citation2016). Due to its rapid development, the environment was affected by major greenhouse gas emissions, as a result to coal usage. Thus, the necessity for renewable energy is now a priority in India. In 2020, the country reported a GDP decrease of 7.33%, and an increase of 18.63% in 2021, and it is the sixth country in the world, based on GDP.
Out of the five countries, China is the only one which reported a GDP growth of 3.10% in 2020, taking into account that the COVID-19 pandemic crisis started from an outbreak in the city of Wuhan. Next year, the country recorded a 20.69% increase in GDP, being the second country in the world. In order to recover from the pandemic and keep its economic growth, huge energy needs were expected and also quantified, making this country the greatest polluter in the world, considering its CO2 emissions. Like the case of India, the country has assumed a sustainable development approach. As a result, in 2016, the Development and Reform Commission of China released the “Green Development Index System” as the basis for assessing the implementation of ecological civilization in its government policies (Wang et al. Citation2020).
According to the creator of the concept of BRIC, the addition of South Africa to the group has weakened the “brick,” so there has been a lot of discussion if BRICS is better than BRIC (Frank Citation2013; Petropoulos Citation2015). Occupying 32nd place on the world based on GDP evidence, South Africa reported a decrease of this indicator of 13.53% in 2020, followed by an increase of 25.19% in 2021 (from 335.44 billion dollars in 2020 to 419.95 billion dollars in 2021). Its ranking justifies, from an objective point of view, the opinions of economists and academia, regarding the decision from 2011 to be included in the group of the most fast-growing emerging economies of the planet.
In the 21st century, investing in CBM&As is a dual decision, which concerns both synergies, reflected in the returns of the involved parties and a responsible approach toward the environment. Thus, the perspectives to develop the energy industry in BRICS have importance for investors.
Nowadays, the energy-sector investment is a mandatory fact but also a challenge. In order to reduce climate change, the pollution associated with CO2 emissions from the energy sector must be decrease. Given the EU and UN approach toward climate change, any measure which sustains a clean environment, energy supplies security (given the military actions involving Russia), economic stability, and social aspects must be considered. There are opinions that state the adoption of a global carbon tax, as an instrument to accelerate the decarbonization process (Papadis and Tsatsaronis Citation2020). Also, some opinions sustain the idea that all countries should accelerate the renewable technologies implementation (Carvalho et al. Citation2020; Roelfsema et al. Citation2020), while efficiency improvements are especially important in emerging countries (China, India, and Brazil) and fossil-fuel-dependent countries (Russian Federation).
China had in 2019 and 2020 the highest installed wind energy and solar photovoltaic’s capacity worldwide, based on internal production. Its human development has increased in the last years, despite the COVID-19 pandemic context. Due to low purchase costs, Chinese cells and modules were the driver for an increase of wind energy and solar photovoltaic’s in Brazil (Carvalho et al. Citation2020). Although not being very active on the M&As market, China needs strong policy measures to control on its increased CO2 emissions, while improving upon wind and hydropower energy generation. Its stable energy policies and support of wind and solar power development by tendering specific tariffs for energy generation make Brazil a desirable country for investing in energy sector ().
In India, energy companies are among the top performers in policy disclosures related to environment and social issues (Behl et al. Citation2022). India’s energy sector is one of the most globally diversified. This sector excels in innovation related to pollution reduction and reforms, facts that make this emerging economy attractive to investors. India needs revision in energy policy and requires extra incentives and consumer-specific energy policies for research infrastructure and energy generation technologies.
Until 2018, Russia’s big fossil-fuel reserves made this country the main target for the investors in the energy sector. Although renewable energy used around the world is increasing, its implementation in the Russian Federation has been relatively slow (Agyekum et al. Citation2021). The military strategic operation in Ukraine in 2022 does not improve the EU investors attractiveness, given the EU sanctions and restrictions. The current context might change this privileged status and future analysis will confirm or deny this.
South Africa recorded the lowest score from all the regions in Africa related to climate change, although it excelled at many other points from SDG, regarding the human development and the increase in the life quality (Aust, Morais, and Pinto Citation2020). The African country increased its renewable energy sources () and it must reduce CO2 emissions. Yet, it is far for the values recorded by the other countries in the group. Despite that, in the last years, South Africa recorded large investments in energy technologies based on solar and wind.
Table 2. The descriptive statistics of the CO2 emissions in BRICS countries (2001–2021) (Friedlingstein et al. Citation2022).
Table 3. Descriptive statistics of the renewable energy sources (growth rates for 2000–2021) (Our World in Data Citation2022).
In the case of hydropower generation, China ranked first with 1.300 terawatts per hour and India ranked third, with a capacity of 160.33 terawatts per hour, as a result of investments in 2021. In the case of wind energy generation, India ranks first in 2021, with a capacity of 68.09 terawatts per hour. For solar energy, the situation in 2021 is similar with hydropower, China recording a capacity of 327 terawatts per hour, and India 68.31 terawatts per hour. South Africa appears in top 10 countries, occupying the sixth place with a capacity of 7.9 terawatts per hour.
Determinant Factors for Investing in Energy Sector – Hypotheses Development
Until the beginning of the 18th century, less than one billion people were estimated to have lived on the planet, the year 1804 being considered the milestone for this threshold. In 1927, the limit of 2 billion was reached and 33 years later, 3 billion, due to modern medicine and public health. Since 1960, the number of years which passed between these thresholds was between 12 and 14 years, according to UN (Victor Citation2022). In 2022, the world population just reached 8 billion people and the vast majority of them, in one way or another, use electricity for personal or professional purposes. Inevitably, the increasing need for electricity led to environment pollution and degradation. This fact opened the perspective toward new forms of sustainable or renewable energy, as an opportunity for investing in this sector.
The industrial revolution which started at the beginning of 20th century used energy as “fuel for development.” This revolution came with a climate crisis, biodiversity collapse, and oceans rise, with negative consequences of people shaping the planet instead of planet shaping people. Although achieving incredible progress in the last 100 years, the humans age (the Anthropocene) has damaged the Earth and, in the last years, countries, organizations, and companies have been focusing majorly on both survival of the individual and the planet.
Environmental and Social Factors That Contribute to Investment Choice in Energy Sector Companies
The Anthropocene is what defines Earth’s most recent geologic period time, without being known when it exactly started. It is distinguished as a new period either after or within the Holocene (which began approximately 11,700 years ago, since the end of the last major glacial advance). The Anthropocene is also known as “the age of humans” and consists of overwhelming global evidence that atmospheric, geologic, hydrologic, biosphere, and other earth system processes are being altered by humans.
According to Crutzen (Citation2002), the originator of the Anthropocene terminology, “The Anthropocene could be said to have started in the late eighteenth century when analyses of air trapped in polar ice showed the beginning of growing global concentrations of carbon dioxide and methane.” Zalasiewicz et al. (Citation2008) agreed with Crutzen (Citation2002) and consider that this era starts at the beginning of the Industrial Revolution. Some findings suggest that it has to do with the rise of farming and the global spread of human populations in the latter stages of the first Agricultural Revolution. Other findings suggest that the beginning of the Anthropocene is associated with the release of first atomic bomb on Hiroshima and Nagasaki, in Japan in 1945. This led to radioactive particles to be detected in soil samples globally.
Knowing that global carbon dioxide emissions from fuels and industry reached a record high in 2019 of 36.7 billion metric tons of CO2, investing in a low-carbon economy seems to be the most ethical solution for a higher Anthropocene lifespan. Some opinions suggested that the lockdowns from 2020 would lead to a high decrease in CO2, given the fact that the planet stopped, but the plummet was of only 5% to 34.81 billion metric tons (Friedlingstein et al. Citation2022). Over the years, the main cause for the rise in CO2 emissions was the energy sector (Adedoyin and Zakari Citation2020; Fatima, Shahzad, and Cui Citation2021). Speculative studies suggest that the global energy demand is expected to continue increasing in the coming decades as a consequence of the continuously growing population and economy (Lowe and Drummond Citation2022; Mardiros and Dicu Citation2014; Qiu et al. Citation2021; Scott et al. Citation2022).
Climate change plays a concerning role in the Anthropocene period of time. The main concern for the entire world is to unlock synergies in order to reduce CO2 emissions. The Paris Climate Agreement and the UN SDGs stand as proof in order to reduce greenhouse gas emissions. When looking for investment opportunities in a company located in BRICS countries, the investors’ main concern should be the decision’s influence on the environment. Thus, if the investors follow a sustainable approach when investing in BRICS, they should consider these countries’ position regarding their CO2 emissions.
During the last 21 years, all the BRICS countries recorded significant struggles in reducing CO2 emissions (). As it can be seen, China and India account for the majority of the CO2 emissions. Moreover, it can be noted that permanent increases were recorded in the case of India for 9 years until 2009. China is one of the most powerful countries in the world, and the single one that recorded an increase in CO2, considering the pandemic context (+1.7%). Despite this, in the last 10 years a tendency toward reducing pollution was recorded (). It could be noted that, out of the five countries, the Russian Federation is the one with the “cleanest approach” with a constant evolution of CO2 emissions with small increases and significant decreases including 2020 (−6.09%). In 2021, most of the countries resumed their economic activity and spikes in CO2 emissions were expected. Anyway, it seems that Russia had the highest pike and South Africa the lowest, which confirms their attitude toward environmental safety and well-being of the population. Further in-depth investigation is required in the case of the Russian Federation given the external relations with EU27 and United States after 24 of February 2022, regarding the siege on Ukrainian territory. Many restrictions were applied to Russian citizens, which could possibly determine the Russian Federation to reconsider the “cleaner approach” which once had. In case of an abnormal way of living, the Maslow’s Pyramid is always reshaped, as history shows.
Figure 1. BRICS emissions in percentages of Mt CO2 (Friedlingstein et al. Citation2022; Andrew and Peters Citation2022).
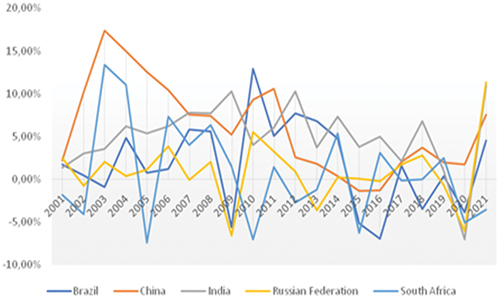
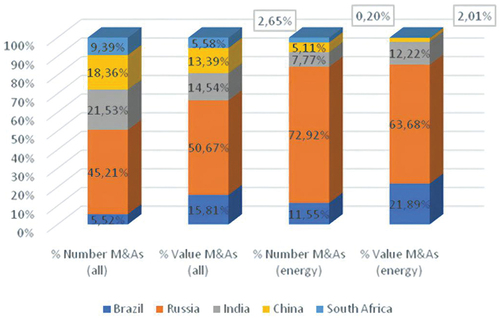
Figure 2. The number and value of M&As in BRICS countries for 2010–2018 (all and energy sector).
In , the CO2 emissions per person are presented, considering the peaks (the highest increase and lowest decrease) but also the mean, considering the period 2001–2021 (since the recognition of the BRICS group).
The most polluting country is South Africa when the CO2 emissions from coal are taken into account and Russian Federation when the pollution from gas and oil are discussed (). Although the pandemic started in China, and it was supposed to slowdown this country’s economy, it was the only one recording a GDP growth of 3.10% in 2020. Also, China recorded an increase in pollution per capita in the same year, considering all three types of fossil fuels.
The other countries recorded a decrease in pollution per capita in 2020 due to lockdowns, but also a comeback in this department as a result of resuming economic activity. Based on the analyzed data, the minimum pollution with CO2 resulted from using coal, of 0.22 t CO2 per capita, and minimum was reported by Brazil in 2009. In case of gas, the minimum value of 0.04 t CO2 per capita was recorded by India for a longer period of time from 2000 until 2007. The same country reported the lowest pollution on oil at the beginning of 2000s.
Considering data from 2001 to 2021, it seems that in case of coal, the South Africa reported the highest values, way above other countries in the group (in each year, the pollution was over 6 tCO2 per capita), with a slow decrease in the last 7 years. In the case of gas pollution, Russia recorded the highest value of 6.03 t CO2 per capita in 2021, and also it recorded the highest values in group in the case of pollution from oil. Every year, the reported values were above 2t CO2 per capita, compared to the rest of the group which reported below this value.
In 2021 world ranking regarding the territorial pollution with CO2 (country’s territorial boundaries – includes exports, but omit imports), Russian Federation holds 19th place, with 12t of CO2 per capita, and the fourth place, with a total of 1.756 Mt of CO2. Next country is China, which holds the 37th place, with 8t CO2 per capita, and the 1st place, with 11.472 Mt CO2. South Africa holds the 43rd position, with 7.3 t CO2 per capita, and the 14th position as a country, with 436 Mt CO2. Brazil and India are quite similar, first one holding the 90th position with 2.2 t CO2 per capita, and the 12th per nation, with 489 Mt CO2, and the second holds the 94th position, with 1.8 t CO2 per capita, but 3rd per total, with 2.170 Mt CO2.
The economy pollution comes from its CO2 emissions and the BRICS countries hold the first places. These countries should reconsider their energy-related policy and reorient toward renewable sources and the status of low-carbon economy (LCE). There are studies which estimate that, until the end of the century, the energy needs will increase with 300% (Wang, Fan, and Zhou Citation2022). The solution is the implementation of low-emission development strategies (LEDS), but the way to a LCE is still a challenge (Darda, Papalas, and Zabaniotou Citation2019). The main achievements of the LEDS are to reduce greenhouse gas emissions and achieve social, economic, and environmental success. In order to achieve these goals, government policies must urgently implement waste management strategies (Kanagaraj et al. Citation2015; Zorpas Citation2020), sustainable transportation (Zhao et al. Citation2020), sustainable tourism (Brady, Kaya, and Beckfield Citation2007; Gilpin and Gilpin Citation2011), and develop technologies which lead to decreases of CO2 emissions. Concerning the latter achievements, the problem is the price volatility of crude oil (Omri and Nguyen Citation2014).
Beyond their contribution to global CO2 emissions, the BRICS countries are also massively involved in producing renewable energy. includes the growth ratios for solar, wind, and hydroenergy generation, for the BRICS countries, for 2001–2021.
The leading countries to install renewable energy in 2021 were China, the U.S., and Brazil. China was leading in renewable energy generation with a capacity of around 1935.37 terawatts. Brazil is behind with 397.03 terawatts and India is also in the top 10 ranking, on fourth position, with 249.74 terawatts. In 2021, the most prolific countries were Russia, with an increase of capacity of wind energy generation of 107.41% (ranking first in the world), South Africa, with a growth rate for hydropower generation of 102.90%, also ranking first in the world, and Brazil, with a growth rate of solar power generation of 65.59%, ranking third in the world.
According to Enerdata (Citation2022), the renewable share in energy production in BRICS countries, Brazil ranks third in the world with 78.4%. China is close to the world share of 28.1%, with 28.8%. Russia, South Africa and India are below average, with 19.3%, 9.2% and 20.4%, respectively. In 2019, the renewable share in energy production worldwide was 26.3%.
The economic growth of a nation is high importance point when taking into account the well-being of that nation. Thus, by measuring health, education, and level of economic well-being of the population, the Human Development Index (henceforth HDI) is used to assess the investment in human capital. Unfortunately, the COVID-19 pandemic showed the weaknesses in social, economic, and political systems on the planet (UNDP Citation2022; Ștefan et al. Citation2023 Sahlian et al. Citation2023).
HDI recorded a permanent increase in years before the COVID-19 pandemic, and in the previous years since its implementation, there are few instances when the standard of living decreased (). Despite the fact that China was the source country for the SARS-COV-2 virus, it was also the only one which recorded increases of the HDI in both years following the beginning of the pandemic, in December 2019. All the other countries under analysis recorded decreases of the HDI index, due to limitations imposed by the lockdowns (Theerthaana and Arun Citation2021).
Table 4. The evolution of the HDI in BRICS countries (UNDP, Citation2022).
The quasi-constant increase of the index in BRICS group confirms that economic development is reflected in human development, once again confirming their emerging economies status. Brazil and China occupy quite similar rankings (87 and 79, respectively). This is the result of both high industrialization and the care for sustainable development, as data referring to renewable energy show. For India, there is a constant and significant increase of the index, but, due to its precarious living conditions, it ranks last in the group (occupying the position 132). For Russian Federation, there were constant increase in the 2010s, but in the last years the increases were insignificant, yet it ranks 1st in the group (occupying the position 52). A surprise is the position of South Africa, considering its permanent interest for renewable energy and its privileged status in African countries (it ranks 109).
Based on previous assumptions, the following research hypothesis is considered for being tested and validated:
H1:
For BRICS countries, the environmental and social factors significantly influence the investment choice in a company from the energy sector, compared to one which does not operate in this sector.
This hypothesis responds to the first research question.
Financial Factors That Contribute to the Investment Choice in the Energy Sector Based on Audit Opinion of Target Companies
When choosing a target company, an acquirer has two perspectives: a non-financial one, which is related to the target company’s attitude toward environment, community, and people, and a financial one, which can lead to potential synergies.
One of the first initiatives to assess the association between performance and various acquisition strategies belongs to Kusewitt (Citation1985). Considering the acquiree’s profitability just prior to the acquisition as one of the seven common factors of strategy, the premium based on market value is calculated. The results are aligned to Hogarty’s (Citation1970) research, in considering the premium paid in transaction as one of the main determinants of profitability in acquisitions. Hitt et al. (Citation2009) use figures from the pre-acquisition financial statements to control return on assets in measuring R&D intensity in acquisitions.
Relevant references show that recent empirical studies on acquisitions focused on analyzing the profitability as a proxy for the target’s expected cash flow as an explanatory variable. Target profitability is typically proxied by returns, and as predicted by theory, the coefficient on profitability is generally significant and positive (Hagendorff et al. Citation2012). But profitability is a factor that can influence the acquisition from both sides, not only targets, because acquiring firms with better performance may have more resources to involve in acquisitions (Shi, Zhang, and Hoskisson Citation2017).
There are relatively few studies that have addressed the problem of profitability and operating performance for companies involved in acquisitions. The reasons are numerous, but Camerlynck, Ooghe, and Langhe (Citation2005) synthesize them in two categories: lack of data availability and methodological problems. The studies aim to offer a financial profile of the acquirers and of the acquirees, using accounting data for companies of different sizes, among which we mention net return on total assets and net return on shareholders’ equity. Thus, they confirm that the profile of the target company is characterized by financial ratios, return included.
The financial description of the target company is based on accounting figures and the external audit enhances their credibility. The unqualified opinion on the target company’s financial number is analyzed by Xie, Yi, and Zhang (Citation2013), who assert that companies which are audited by Big N auditors are more probable to being acquired in an M&As transaction, especially the ones with high information risk (reflected in low accruals quality). On the same note is the research of Lim, Lee, and Chang (Citation2015), who found a direct relationship between the quality of the financial information provided by the target company and the success of the M&As, measured in the announcement returns recorded by the acquirers. Chang and Lian Sun (Citation2009) show that a high-quality external financial statement audit also mitigates information asymmetry and, hence, reduces the impact of market-timing behavior on the company’s capital structure. The external audit can also offer a proper insight on the value of the bidding company (Bouwman, Fuller, and Nain Citation2009; Faccio and Masulis Citation2005).
Seen from a geographical perspective, M&As can determine two different investors approaches. First side, these business concentrations lead to the creation of pan-world players, and, on the other side, there is an opposite trend toward the establishment of “national champions” (Verde Citation2008).
Oil is a strategic natural resource, that makes the M&As include in commercial transactions sector, but also as a response to geopolitical games (Yergin Citation2011). In this sector, there is a tendency toward concentration (Guo, Yang, and Wang Citation2021) and this dual approach is also seen at EU level. While in the 1980s, Europe encouraged their MNEs to expand globally, to unify the upstream and downstream enterprises through M&As. Nowadays, investment competition is increasing between international and national companies in the sector (Guo, Yang, and Wang Citation2021; Waterworth and Bradshaw Citation2018), in their search for know-how and unconventional technologies more than for resources.
Starting from the presented literature ideas, in this study it’s considered the second research hypotheses to be tested and validated:
H2:
For BRICS countries, the financial factors significantly influence the investment choice in a company from the energy sector, compared to one which does not operate in this sector.
This hypothesis responds to the second research question, proposed in the introduction of the paper.
BRICS countries need to redefine their energy policies based upon their existing geographical, economical, societal, and environmental conditions. Also, they have the potential to reshape the energy sector in the world, but also the energy policies, given their potential and their sustainable approach toward different sources of energy (Pathak and Shah Citation2019). In many BRICS countries, the governments offer incentives to foreign companies to invest in their economies, such as tax breaks, subsidies, and easy bureaucratic processes. Considering this, the paper assesses the influence of both non-financial and financial factors on the decision of the investors to pursue M&As in the energy sector, considering as target countries the BRICS, knowing that many countries in the world make real efforts in increasing share of their renewable resources.
Research Methodology
Target Population, Analyzed Sample, and Data Source
To test and validate the proposed research hypotheses, the study analyzes the empirical data related to 4.222 M&As with known purchased stake. To confirm the research hypotheses, the data regarding M&As were gathered from two databases, for the 2005–2018 period of time, considering only the target companies from BRICS countries. The information regarding the deals representing M&As was collected from the Zephyr database; financial information was collected from Orbis database.
Models Proposed for Analysis and Data Source
The method used to analyze the collected data is logistic regression, in order to assess the choice for the energy sector (or not), based on specific independent variables.
The probability (p) of choosing to invest in a company in the energy sector is significantly influenced by the factors included in f function:
These variables are considered for a period between the time of the M&As and 3 years before the M&As. The four-year period is used in other studies, and it is representative in analyzing these growth operations (Mehrotra and Sahay Citation2022; Mun, Koh, and Jang Citation2021).
Based on the estimated probability (p) from the logistic regression, we use the prediction from eq. (1) to consider the influence of the factors related to financial performance, as presented in g function:
where financial performance can be explained by the following factors:
where:
as market capitalization growth
and
Ztransparency score = the estimated discretionary accruals using operating cash flow (Dechow and Dichev Citation2002).
The variables proposed for the study are presented in .
Table 5. Variables included in the models proposed in the study.
For testing and validating the proposed hypotheses, data analysis would be performed using the statistical SPSS 26.0.
Using Fuzzy Logic to Assess the Investment Probability in BRICS M&As
Fuzzy logic approach uses the simulation capacity of a system that is similar to human reasoning (Lucchese et al. Citation2020; Tafuro et al. Citation2022; Veltri, Venturelli, and Mastroleo Citation2015; Zadeh Citation1973). This method provides some scientific tools to model a system using both quantitative and qualitative data (Negnevitsky Citation2005; Pislaru, Herghiligiu, and Robu Citation2019). Hence, it computes linguistic variables that contain words or sentences in a natural or artificial language, as values (Zadeh Citation1973). Linguistic variables involve understanding the (i) variables name, (ii) term-set of variables, (iii) discourse universe, (iv) syntactic rules, (v) semantic rules (Lu et al. Citation2022; Phillis and Kouikoglou Citation2005; Pislaru, Herghiligiu, and Robu Citation2019).
A fuzzy subset (U – discourse universe) is determined by a membership function µQ, which relates with elements of U in the interval [0, 1] and where µQ(u) is the membership grade (Zadeh Citation1965). Hence, a fuzzy set Qfuzzy = {(x, μQ)|x ∈ U, μQ∈ [0, 1]} is being determined by the membership function and offers the possibility to measure the similarity degree of an element associated to U in the fuzzy subset (Lu et al. Citation2022).
Fuzzy modeling, algorithm involves some specific main phases presented in .
Figure 3. Main process of fuzzy logic system (Lu et al. Citation2022).
The main phases of fuzzy modeling algorithm include: fuzzification, as a process that converts normalized inputs into linguistic variables through appropriate membership functions; membership function transfers the input to fuzzy sets; inference, as a process that is based on a series of rules that link fuzzy inputs and outputs: IF x is A AND y is B (premises) THEN z is C (conclusion), were A, B and C are linguistic values defined by fuzzy set associated to X, Y, and Z analysis universe; defuzzification as a process which “weights and averages the outputs from all of the individual fuzzy rules into one single crisp output value,” with varia defuzzification techniques. In this study, the centroid method is considered to be suitable (Bottani, Gentilotti, and Rinaldi Citation2017; Herghiligiu et al. Citation2020; Lu et al. Citation2022; Markowski and Mannan Citation2008; Pokoradi Citation2002; Zadeh Citation1965).
Starting from EquationEquation (2)(2)
(2) , in this study, the following fuzzy model was considered – .
Figure 4. The sustainable fuzzy model for energy sector.

Due to their statistical distribution, in the fuzzy model, just ROE and MC growth (D_MC) were considered. For these variables, the following fuzzy set rules were proposed, based on their statistical association (Herghiligiu et al. Citation2019):
Rule 1: If (ROE is ROE-low) and (D-MC is D-MC-high) then (Predicted_(p) is Predicted_(p)-high) (1)
Rule 2: If (ROE is ROE-medium) and (D-MC is D-MC-medium) then (Predicted_(p) is Predicted_(p)-medium) (1)
Rule 3: If (ROE is ROE-medium) and (D-MC is D-MC-low) then (Predicted_(p) is Predicted_(p)-medium) (1)
Rule 4: If (ROE is ROE-high) and (D-MC is D-MC-medium) then (Predicted_(p) is Predicted_(p)-low) (1)
The modeling was performed in MATLAB.
Results and Discussions
In this study, the analysis was performed in two steps. In the first one, statistical estimation for the parameters included in EquationEquation (1)(1)
(1) –(Equation3
(3)
(3) ) were performed. In the second step, the estimated parameters for the variables included in Sustainable fuzzy model [energy sector] were considered in performing the simulations.
For descriptive statistics, the results show that before 24 February of 2022, the Russian Federation was estimated to hold the world’s largest natural gas reserves, second-largest coal reserves, and seventh-largest oil reserves (Yang et al. Citation2021), and had a clear strategy regarding its energy sector, known as “Energy strategy until 2030.” This is one of the reasons for which the Russian companies were preferred by 53.89% of EU’s acquirers, out of 334 companies from the energy sector which are in our sample of interest.
Due to numerous reasons, out of which we mention the wide range of energy sources, India was second preferred by EU acquirers who decided to invest in Energy sector (20.36%). The last place is held by Brazil with only eight companies (2.32%), but this is explained by the fact that its top exports are soybeans, iron ore, raw sugar, and meat. The probability of choosing a target company in the energy sector is the highest in the case of the latter, probably because it is considered to be an unexplored market. The lowest probability is recorded in the case of South Africa, and the explanation might be the fact that this country exports mainly diamonds since 1868 when the Kimberley diamond strike imposed this emerging economy as the world leader in diamond production.
Regarding the first hypothesis, the study analyzes the data for 4 years, out of which 3 years were considered before the year of the M&A, and these values are significant for the EU acquirers in choosing a target company from the energy sector in BRICS countries. The fact that HDI, CO2 emissions, and the emerging characteristics of these economies are relevant for the acquirers for this period is a signal that they consider and plan their investments years before the transaction effectively takes place. The fact that the acquirers are from EU’s developed economies transposes in the significance of CO2 emissions for the year of the M&As which means that European companies adopt a sustainable approach in their investments ().
The descriptive statistics related to the predicted probability (p) of choosing to invest in a company in the energy sector from BRICS are presented in .
Table 6. Descriptive statistics related to the predicted probability (p) of choosing to invest in a company in the energy sector from BRICS.
Table 7. The parameters estimates for the variables included in Eq. (1) related to the probability (p) of choosing to invest in a company in the energy sector.
According to data from , and based on their financial data at the country level, we can see a profile of the target companies in the energy sector. The Russian companies, as data suggest, seem to not be efficient in using shareholders equity and proof in this regard is the negative values of ROE for the 4 years. In average, the best place is held by Chinese companies (data from suggest that three years before the M&As, companies report a return of 16.03% and increases in the following years).
Table 8. Descriptive statistics of ROE for the companies from BRICS.
Table 9. Descriptive statistics of ROCE for the companies from BRICS.
Table 10. Descriptive statistics of MC for the companies from BRICS.
Searching for the most profitable companies in the sample, South African companies reported the highest returns for the year of the M&As, and the year before the transaction (see ). In the case of the return on capital employed (ROCE), the situation is similar. Given that the target companies are from the energy sector, the probability for them not to be listed is narrowed too unexplainable.
Thus, regarding market capitalization, China and Brazil hold the best places in the ranking. The last place is held by India, but this is to be expected given the fact that this country’s growth started in 1990, and its financial market is in continuous development (Vishal Citation2020). The fact that the companies are listed transposes itself into the fact they are audited. The Russian Federation reports the most companies with qualified audit opinion on financial statements.
In the analyzed sample, based on 4.222 transactions, all the target companies from the energy sector are audited, while 3.574 companies from other sectors are unaudited (84.65%). The evolution is presented for 4 years. The fact that the energy companies are audited is understandable, given the fact that energy is usually a strategic domain for any economy.
Audit status is a variable of great importance when choosing to invest in a target company from the energy sector besides other sectors, as data suggest in and is consistent with our second study hypothesis.
Table 11. Audit status for the companies from BRICS.
The importance of an audit is due to the guarantee offered regarding the financial information provided by the target companies, which are part of the business concentration. From , data show that the acquirers from the EU prefer to choose companies which are audited two to one year prior to the M&As event. The audit status and, implicitly, the unqualified opinion on the financial statements is enough in certifying the quality of the financial information. This must be correlated with the transparency score, which is a significant variable for the year of the M&As and the year prior to the transaction. When considering the type of deal, mergers and takeovers are not strategically appealing, the EU acquirers preferring alliances, and purchases of stakes (either leading to majority or minority acquisitions). This is due to certain country laws, given the fact that the energy sector is of major importance at the country level.
In , there are presented the descriptive statistics related to the predicted probability (p) of choosing to invest in a company in the energy by audit status, that were estimated using EquationEquation (1)(1)
(1) .
Table 12. Descriptive statistics related to the predicted probability (p) of choosing to invest in a company in the energy by audit status.
Table 13. The parameters estimates for the variables included in Eq. (3) related to the probability (p) of choosing to invest in a company in the energy sector.
In , the membership functions for ROE () and D_CM () are presented as input variables and for Predicted (p) () as output variable. In this study, triangular membership functions are proposed, being easier to simulate human reasoning and adequate for sustainable energy profile.
Figure 5. Membership function of ROE (a), D_CM (b) and Predicted (p) (c).
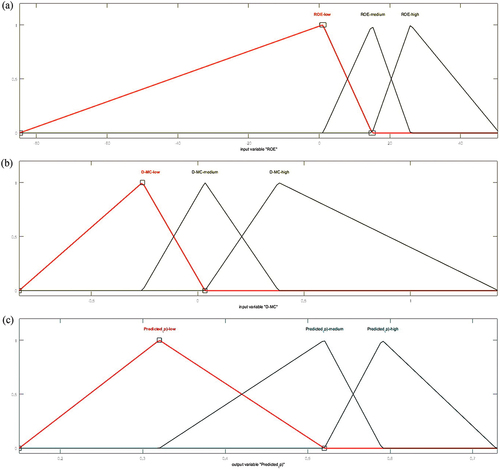
These triangular membership functions (Phillis and Davis Citation2009) were used due to their simplicity (Phillis, Grigoroudis, and Kouikoglou Citation2011) and because they are similar to human reasoning; also, these membership function types are the most suitable for performance measurements (Chan and Qi Citation2003). For each variable, the distribution is presented by category as follows:
ROE: triangular distribution [lower limit; peak location; upper limit] - ROE_low: [84.78; 1.039; 14.96]; ROE_medium: [1.039; 14.96; 25.81]; ROE_high: [14.96; 25.81; 50.54] ();
D_MC: triangular distribution [lower limit; peak location; upper limit] - D_MC_low: [−0.84; −0.26; 0.034]; D_MC_medium: [−0.26; 0.034; 0.38]; D_MC_high: [0.034; 0.38; 1.414] ();
Predicted (p): triangular distribution [lower limit; peak location; upper limit] - Predicted (p)_low: [0.15; 0.32; 0.52]; Predicted (p)_medium: [0.32; 0.52; 0.59]; Predicted (p)_high: [0.52; 0.59; 0.728] ().
Starting from the fuzzified variables associated with the proposed rules, the defuzzified out variable is aggregated in order to obtain the Predicted (p) distribution presented in .
Figure 6. Fuzzy rule based for ROE, D_MC and Predicted (p).
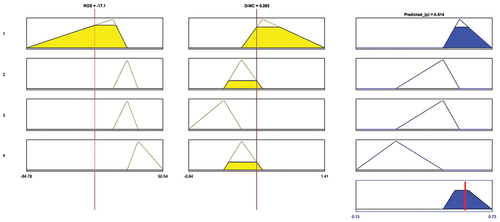
Figure 7. Diagram associated to the distribution of Predicted (p).
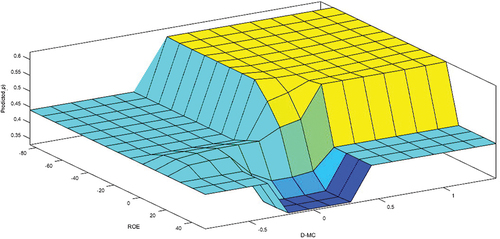
In this study, fuzzy output Predicted (p) is transformed into a crisp number with values between 0.15 and 0.728. The more the output result parameter is closer to 0.728, the predicted probability for investment choice in energy sector is more feasible. Applying the centroid method () where Predicted (p) is an output parameter that has 0.614 value, under the influence of ROE with − 17.1, and D_MC with 0.285.
includes the diagram that represents the distribution of Predicted (p) for investment choice on energy sector under the influence of ROE and D_MC. From the diagram, it can be assessed that Predicted (p) is positively influenced by negative values of ROE in the year of M&As due to investors’ behavior, who consider firms with low performance for participating in M&As. In contrast, firms with high ROE are more attractive for the market, but that determines high prices of their shares, with a negative impact on the Predicted (p), because investors search for lower price transactions.
For D_MC, the results show that Predicted (p) for investment choice on energy sector is positively influenced by a positive market capitalization growth, due to the fact that investors are looking for firms that offer sufficient returns in order to recover their initial investment. On the other hand, firms with negative market capitalization growth don’t offer the possibility of investment recovery and have a negative influence on the Predicted (p).
Conclusions
Based on the obtained results it can be assumed that the energy sector is a paradox. From one perspective, there are many investments perceived as being socially responsible, focused on preserving the planet, respecting human health and social behavior. On the other perspective, its products and operations are highly detrimental to the environment and the human life quality, due to its pollution capacity. Thus, the energy sector consumes the natural resources of the biophysical environment and, at the same time, is prone to exploit the environment and to generate pollution, leading to both ecological and social imbalances. All BRICS countries present high potential for exploiting renewable energy (hydropower, solar, and wind). Also, the transition to sustainable energy (non-fossil energy) is inevitable.
In this paper, the decision of EU acquirers from developed economies is analyzed from two different perspectives. Given the pollution with which all the nations are confronted nowadays, the sustainable approach is encouraged. According to the research results, the decision to invest in one of BRICS countries is a strategic one, the macroeconomic factors influence being significant 3 years before the M&As. The struggle for a cleaner environment is noticeable in the significant influence of the CO2 emissions for the year of the event.
The choice for the country being made, the target company is selected in a more pragmatic manner. Investors take into account its financial data, the transparency in financial and non-financial reporting and the assurance level brought by an unqualified audit opinion. Actually, there are no target companies from the energy sector which are not audited, but this is to be expected given the strategic nature of this sector, as a driver for all the other industries.
The target companies’ performance is less to no significant which translates into the fact that investing in energy is seen as having potential for the future and not reflected in the past of the companies. Moreover, the continuous preoccupation of the countries and companies for a cleaner environment and for the well-being of the population leads to a shift from conventional energy to renewable sources. Thus, the acquirers are interested in know-how and nonconventional technologies more than the previous performance of the companies they select.
Out of the five countries, Brazil seems to have the most potential for being chosen by EU acquirers, given its undiscovered market and the fact that this country was not much selected in the past. Until 2019, Russia was favored for CBM&As in energy sector, but the late events and the tensioned relations with EU definitely will generate a change in the matter. In its latest attempt to punish Russia for its invasion of Ukraine, the European Union decided to ban all imports of oil from Russia that are brought in by sea (31 May 2022). This decision could cut the amount of oil that EU countries import from Russia by up to 90%, reducing the amount of money the Russian government makes from oil sales.
Due to the current geopolitical situation and the permanent changes in the regulatory framework for conventional and renewable energy, the number and competitive relationships of the companies in the energy sector is expected to change accordingly in the years to follow.
Acknowledgments
This work was co-funded by the European Social Fund, through Operational Programme Human Capital 2014-2020, project number POCU/993/6/13/153322, project title “Educational and training support for PhD students and young researchers in preparation for insertion into the labor market” (partial).
Disclosure statement
No potential conflict of interest was reported by the authors.
Additional information
Notes on contributors
Ioan-Bogdan Robu
Ioan-Bogdan Robu is Full Professor, PhD in Accounting and PhD in Statistics, and a member the Department of Accounting, Business Information Systems, and Statistics of the Faculty of Economics and Business Administration of Alexandru Ioan Cuza University of Iasi (Romania). His main research areas are accounting quality, financial auditing, fraud auditing, and financial econometrics. He is also PhD Supervisor in Accounting field
George-Marian Aevoae
George-Marian Aevoae is PhD in Accounting and Teaching Assistant in the Department of Accounting, Business Information Systems, and Statistics of the Faculty of Economics and Business Administration of Alexandru Ioan Cuza University of Iasi (Romania). He teaches Fundamentals of Accounting (Romanian and English), Financial accounting, Standardization in Business Accounting, and Accounting for Nonprofit Organizations. His main area of interest is the synergy effect in mergers and acquisitions. He is also a chartered accountant in a private firm and a chartered appraiser
Daniela Neonila Mardiros
Daniela Neonila Mardiros is an Associate Professor and a member of the Department of Accounting, Business Information Systems and Statistics of the Faculty of Economics and Business Administration of Alexandru Ioan Cuza University of Iasi (Romania). She teaches Fundamentals of accounting, Financial accounting, Public accounting and Accounting for not-for-profit organizations. Her main area of interest is public accounting
Ionut Viorel Herghiligiu
Ionut Viorel Herghiligiu is Associated Professor Habil. with tenure of Management at”Gheorghe Asachi” Technical University of Iași (TUIASI), Romania. He has a PhD in Engineering and management from TUIASI and one in Engineering science from University of Angers, France. Also, he followed postdoctoral studies in Cybernetic and statistics at Alexandru Ioan Cuza University of Iasi, Romania. He is also PhD Supervisor in Engineering and management field
References
- Adedoyin, F. F., and A. Zakari. 2020. “Energy Consumption, Economic Expansion, and CO2 Emission in the UK: The Role of Economic Policy Uncertainty.” Science of the Total Environment 738:140014. https://doi.org/10.1016/j.scitotenv.2020.140014.
- Agyekum, E. B., N. M. Kumar, U. Mehmood, M. K. Panjwani, H. H. Alhelou, T. S. Adebayo, and A. Al-Hinai. 2021. “Decarbonize Russia—A Best–Worst Method Approach for Assessing the Renewable Energy Potentials, Opportunities and Challenges.” Energy Reports 7:4498–515. https://doi.org/10.1016/j.egyr.2021.07.039.
- Ali, A., R. A. Tufa, F. Macedonio, E. Curcio, and E. Drioli. 2018. “Membrane Technology in Renewable-Energy-Driven Desalination.” Renewable and Sustainable Energy Reviews 81:1–21. https://doi.org/10.1016/j.rser.2017.07.047.
- Andrew, R. M., and G. P. Peters The Global Carbon Project’s Fossil CO2 Emissions Dataset 2022. Accessed 10 November 2022. https://zenodo.org/record/7215364.
- Andriuškevičius, K., and D. Štreimikienė. 2021. “Developments and Trends of Mergers and Acquisitions in the Energy Industry.” Energies 14 (8): 2158. https://doi.org/10.3390/en14082158.
- Ardichvili, A., E. Zavyalova, V. Minina, and T. N. Garavan. 2012. “Human Capital Development: Comparative Analysis of BRICs.” European Journal of Training & Development 36 (2/3): 213–33. https://doi.org/10.1108/03090591211204724.
- Aust, V., A. I. Morais, and I. Pinto. 2020. “How Does Foreign Direct Investment Contribute to Sustainable Development Goals? Evidence from African Countries.” Journal of Cleaner Production 245:118823. https://doi.org/10.1016/j.jclepro.2019.118823.
- Behl, A., P. S. Kumari, H. Makhija, and D. Sharma. 2022. “Exploring the Relationship of ESG Score and Firm Value Using Cross-Lagged Panel Analyses: Case of the Indian Energy Sector.” Annals of Operations Research 313 (1): 231–56. https://doi.org/10.1007/s10479-021-04189-8.
- Bekaert, G., and C. R. Harvey 2017. “Emerging Equity Markets in a Globalizing World 2017.” Accessed November 10, 2022. http://ssrn.com/abstract=2344817.
- Bottani, E., M. C. Gentilotti, and M. Rinaldi. 2017. “A Fuzzy Logic-Based Tool for the Assessment of Corporate Sustainability: A Case Study in the Food Machinery Industry.” Sustainability 9 (4): 583. https://doi.org/10.3390/su9040583.
- Bouwman, C., K. Fuller, and A. Nain. 2009. “Market Valuation and Acquisition Quality: Empirical Evidence.” The Review of Financial Studies 22 (2): 633–79. https://doi.org/10.1093/rfs/hhm073.
- Brady, D., Y. Kaya, and J. Beckfield. 2007. “Reassessing the Effect of Economic Growth on Well-Being in Less-Developed Countries, 1980–2003.” Studies in Comparative International Development 42 (1–2): 1–35. https://doi.org/10.1007/s12116-007-9003-7.
- Camerlynck, J., H. Ooghe, and T. D. Langhe. 2005. “Pre-Acquisition Profile of Privately Held Companies Involved in Take-Overs: An Empirical Study.” Small Business Economics 24 (2): 169–86. https://doi.org/10.1007/s11187-003-3807-2.
- Carvalho, N. B., D. B. Viana, M. M. de Araújo, J. Lampreia, M. S. P. Gomes, and M. A. V. Freitas. 2020. “How Likely is Brazil to Achieve Its NDC Commitments in the Energy Sector? A Review on Brazilian Low-Carbon Energy Perspectives.” Renewable and Sustainable Energy Reviews 133:110343. https://doi.org/10.1016/j.rser.2020.110343.
- Chang, T., C. Lee, and K. Hung. 2012. “Can the PPP Stand on the BRICS? The ADL Test for Threshold Cointegration.” Applied Economics Letters 19 (12): 1123–27. https://doi.org/10.1080/13504851.2011.615727.
- Chang, J., and H. Lian Sun. 2009. “Crossed-Listed Foreign Firms’ Earnings Informativeness, Earnings Management and Disclosures of Corporate Governance Information Under SOX.” The International Journal of Accounting 44:1–32. https://doi.org/10.1016/j.intacc.2008.12.004.
- Chan, F. T., and H. J. Qi. 2003. ““An Innovative Performance Measurement Method for Supply Chain Management.” Supply Chain Management: An International Journal 8 (3): 209–23. https://doi.org/10.1108/13598540310484618.
- Crutzen, P. J. 2002. “Geology of Mankind.” Nature 415 (6867): 23. https://doi.org/10.1038/415023a.
- Darda, S., T. Papalas, and A. Zabaniotou. 2019. “Biofuels Journey in Europe: Currently the Way to Low Carbon Economy Sustainability is Still a Challenge.” Journal of Cleaner Production 208: 575–88. https://doi.org/10.1016/j.jclepro.2018.10.147.
- Dechow, P., and I. Dichev. 2002. “The Quality of Accruals and Earnings: The Role of Accrual Estimation Errors.” The Accounting Review 77 (Supplement): 35–59. https://doi.org/10.2308/accr.2002.77.s-1.35.
- Devonshire-Ellis, C. 2022. “The New Candidate Countries for BRICS Expansion.” Accessed April 20, 2023.https://www.silkroadbriefing.com/news/2022/11/09/the-new-candidate-countries-for-brics-expansion/.
- Dlugokencky, E., and P. Tans 2020. “Trends in Atmospheric Carbon Dioxide, National Oceanic & Atmospheric Administration, Earth System Research Laboratory (NOAA/ESRL) 2020.” Accessed November 10, 2022. http://www.esrl.noaa.gov/gmd/ccgg/trends/global.html.
- Enerdata. “World Energy and Climate Statistics – Yearbook 2022.” Accessed October 8, 2022. https://yearbook.enerdata.net/renewables/renewable-in-electricity-production-share.html.
- Faccio, M., and R. Masulis. 2005. “The Choice of Payment Method in European Mergers and Acquisitions.” The Journal of Finance 60 (3): 1345–88. https://doi.org/10.1111/j.1540-6261.2005.00764.x.
- Fatima, T., U. Shahzad, and L. Cui. 2021. “Renewable and Nonrenewable Energy Consumption, Trade and CO2 Emissions in High Emitter Countries: Does the Income Level Matter?” Journal of Environmental Planning and Management 64 (7): 1227–51. https://doi.org/10.1080/09640568.2020.1816532.
- Fernandes, B., J. Cunha, and P. Ferreira. 2011. “The Use of Real Options Approach in Energy Sector Investments.” Renewable and Sustainable Energy Reviews 15 (9): 4491–97. https://doi.org/10.1016/j.rser.2011.07.102.
- Fletcher, O. 2011. “China Seeks Heft for BRICS 2011.” Accessed November 2, 2022. https://www.wsj.com/articles/SB10001424052748703841904576256413453368944.
- Frank, W. P. 2013. “International Business Challenge: Does Adding South Africa Finally Make the BRIC Countries Relevant?” Journal of International Business Research 12 (1): 1.
- Friedlingstein, P., M. W. Jones, M. O’Sullivan, R. M. Andrew, D. C. Bakker, and J. Hauck; … J. Zeng. 2022. “Global Carbon Budget 2021.” Earth System Science Data 14 (4): 1917–2005. https://doi.org/10.5194/essd-14-1917-2022.
- Friedlingstein, P., M. O’ Sullivan, M. W. Jones, R. M. Andrew, L. Gregor, J. Hauck, C. Le Quéré, et al. 2022. “Global Carbon Budget 2022.” Earth System Science Data 14 (11): 4811–900. Accessed November 10, 2022. https://doi.org/10.5194/essd-14-4811-2022.
- Fuso Nerini, F., B. Sovacool, N. Hughes, L. Cozzi, E. Cosgrave, and M. Howells; … B. Milligan. 2019. “Connecting Climate Action with Other Sustainable Development Goals.” Nature Sustainability 2 (8): 674–80. https://doi.org/10.1038/s41893-019-0334-y.
- Gilpin, R., and J. M. Gilpin. 2011. Global Political Economy: Understanding the International Economic Order. Princeton, NJ, USA: Princeton University Press. https://doi.org/10.2307/j.ctvcm4j53.
- Gregory, A., and S. O’Donohoe. 2014. “Do Cross Border and Domestic Acquisitions Differ? Evidence from the Acquisition of UK Targets.” International Review of Financial Analysis 31:61–69. https://doi.org/10.1016/j.irfa.2013.09.001.
- Guo, Y., Y. Yang, and C. Wang. 2021. “Global Energy Networks: Geographies of Mergers and Acquisitions of Worldwide Oil Companies.” Renewable and Sustainable Energy Reviews 139:110698. https://doi.org/10.1016/j.rser.2020.110698.
- Güriș, B., and M. Tiraşoğlu. 2018. “The Validity of Purchasing Power Parity in BRICS Countries.” Prague Economic Papers, University of Economics 4 (4): 417–26. https://doi.org/10.18267/j.pep.654.
- Hagendorff, J., I. Hernando, M. J. Nieto, and L. D. Wall. 2012. “What Do Premiums Paid for Bank M&As Reflect? The Case of the European Union.” Journal of Banking & Finance 36 (3): 749–59. https://doi.org/10.1016/j.jbankfin.2011.03.009.
- Herghiligiu, I. V., I. B. Robu, M. Pislaru, A. Vilcu, and A. L. Asandului. 2020. “Fuzzy Logic Methodology for Environmental Sustainability Performance Evaluation.” Bulletin of the Polytechnic Institute of Iasi, Published by “Gheorghe Asachi” Technical University of Iasi 66 (70): 9–21.
- Herghiligiu, I. V., I. B. Robu, M. Pislaru, A. Vilcu, A. L. Asandului, S. Avasilcăi, and C. Balan. 2019. “Sustainable Environmental Management System Integration and Business Performance: A Balance Assessment Approach Using Fuzzy Logic.” Sustainability 11 (19): 5311. https://doi.org/10.3390/su11195311.
- Hitt, M. A., D. King, H. Krishnan, M. Makri, M. Schijven, K. Shimizu, and H. Zhu. 2009. “Mergers and Acquisitions: Overcoming Pitfalls, Building Synergy, and Creating Value.” Business Horizons 52 (6): 523–29. https://doi.org/10.1016/j.bushor.2009.06.008.
- Hogarty, T. 1970. “The Profitability of Corporate Mergers.” The Journal of Business 43 (3): 317–27. https://doi.org/10.1086/295284.
- Kanagaraj, J., T. Senthilvelan, R. C. Panda, and S. Kavitha. 2015. “Eco-Friendly Waste Management Strategies for Greener Environment Towards Sustainable Development in Leather Industry: A Comprehensive Review.” Journal of Cleaner Production 89:1–17. https://doi.org/10.1016/j.jclepro.2014.11.013.
- Kusewitt, J. B. 1985. “An Exploratory Study of Strategic Acquisition Factors Relating to Performance.” Strategic Management Journal 6 (2): 151–69. https://doi.org/10.1002/smj.4250060205.
- Lim, J., J. Lee, and J. Chang. 2015. “Financial Reporting Quality of Target Companies and Acquirer Returns: Evidence from Korea.” International Journal of Accounting & Information Management 23 (1): 16–41. https://doi.org/10.1108/IJAIM-07-2014-0052.
- Lowe, R. J., and P. Drummond. 2022. “Solar, Wind and Logistic Substitution in Global Energy Supply to 2050–Barriers and Implications.” Renewable and Sustainable Energy Reviews 153:111720. https://doi.org/10.1016/j.rser.2021.111720.
- Lucchese, M., N. Aversano, F. Di Carlo, and P. T. Polcini. 2020. “Assessing the Intellectual Capital and Related Performance in the Teaching Process Using FES Models: First Evidence in Italian Universities.” WSEAS Transactions on Business and Economics 17:1–20. https://doi.org/10.37394/23207.2020.17.34.
- Lu, L., F. Goerlandt, O. A. V. Banda, and P. Kujala. 2022. “Developing Fuzzy Logic Strength of Evidence Index and Application in Bayesian Networks for System Risk Management.” Expert Systems with Applications 192:116374. https://doi.org/10.1016/j.eswa.2021.116374.
- Mardiros, D., and R. M. Dicu. 2014. “The Emerging Economies Classification in Terms of Their Defining, Grouping Criteria and Acronyms Used for This Purpose.” Management Strategies Journal 26 (4): 311–19.
- Markowski, A. S., and M. S. Mannan. 2008. “Fuzzy Risk Matrix.” Journal of Hazardous Materials 159 (1): 152–57. https://doi.org/10.1016/j.jhazmat.2008.03.055.
- May, P. H. 2008. “Overcoming Contradictions Between Growth and Sustainability: Institutional Innovation in the BRICS.” Chinese Journal of Population Resources and Environment 6 (3): 3–13. https://doi.org/10.1080/10042857.2008.10684876.
- Mehrotra, A., and A. Sahay. 2022. “Financial Performance of Firms Pre-And Post-M&A: A Study of Selected Indian Acquirers.” Vision: The Journal of Business Perspective 097226292210873. https://doi.org/10.1177/09722629221087367.
- Moeller, S., and F. Schlingemann. 2005. “Global Diversification and Bidder Gains: A Comparison Between Cross-Border and Domestic Acquisitions.” Journal of Banking & Finance 29 (3): 533–64. https://doi.org/10.1016/S0378-4266(04)00047-0.
- Mun, S. G., Y. Koh, and S. Jang. 2021. “Which Type of M&A Makes an Acquiring Restaurant Firm a Star? Profit-Driven versus Growth-Driven M&A.” Cornell Hospitality Quarterly 63 (3): 369–84. https://doi.org/10.1177/1938965520979174.
- Negnevitsky, M. 2005. Artificial Intelligence. A Guide to Intelligent Systems. 2nd ed. Harlow, England: Pearson Education Ltd.
- Ogujiuba, K. K. 2020. “A Comparative Analysis of Macroeconomic Outcomes Amongst the BRICS (2000-2015).” Journal of International Economics. Accessed November 3, 2022. https://openscholar.ump.ac.za/handle/20.500.12714/232.
- Omri, A., and D. K. Nguyen. 2014. “On the Determinants of Renewable Energy Consumption: International Evidence.” Energy 72:554–60. https://doi.org/10.1016/j.energy.2014.05.081.
- Onofrei M., I. Bostan, F. Oprea, G. Paraschiv, and C. M. Lazăr. 2020. “The Implication of Fiscal Principles and Rules on Promoting Sustainable Public Finances in the EU Countries.“ Sustainability 12 (7): 2772. https://doi.org/10.3390/su12072772.
- Our World in Data. Renewable Energy 2022. Accessed November 10, 2022. https://ourworldindata.org/renewable-energy.
- Papadis, E., and G. Tsatsaronis. 2020. “Challenges in the Decarbonization of the Energy Sector.” Energy 205:118025. https://doi.org/10.1016/j.energy.2020.118025.
- Pathak, L., and K. Shah. 2019. “Renewable Energy Resources, Policies and Gaps in BRICS Countries and the Global Impact.” Frontiers in Energy 13 (3): 506–21. https://doi.org/10.1007/s11708-018-0601-z.
- Petropoulos, S. 2015. “Opportunities, Challenges and Prospects of South Africa in the BRICS.“ In The European Union and the BRICS, edited by M. Rewizorski, 161–80. Springer Cham. https://doi.org/10.1007/978-3-319-19099-0
- Phillis, Y. A., and B. J. Davis. 2009. “Assessment of Corporate Sustainability via Fuzzy Logic.” Journal of Intelligent and Robotic Systems 55 (1): 3–20. https://doi.org/10.1007/s10846-008-9289-3.
- Phillis, Y. A., E. Grigoroudis, and V. S. Kouikoglou. 2011. “Sustainability Ranking and Improvement of Countries.” Ecological Economics 70 (3): 542–53. https://doi.org/10.1016/j.ecolecon.2010.09.037.
- Phillis, Y. A., and S. V. Kouikoglou. 2005. Fuzzy Measurement of Sustainability. New York: Nova Science Publisher.
- Pislaru, M., I. V. Herghiligiu, and I. B. Robu. 2019. “Corporate Sustainable Performance Assessment Based on Fuzzy Logic.” Journal of Cleaner Production 223: 998–1013. https://doi.org/10.1016/j.jclepro.2019.03.130.
- Pokoradi, L. 2002. “Fuzzy Logic-Based Risk Assessment.” Academic and Applied Research in Military Science 1 (1): 63–73.
- Pomykala, A., and A. Szelag. 2022. “Reduction of Power Consumption and CO2 Emissions as a Result of Putting into Service High-Speed Trains: Polish Case.” Energies 15 (12): 4206. https://doi.org/10.3390/en15124206.
- Prakash, A., and G. Kumar. 2017. “The Effect of Macroeconomic Indicators on Foreign Direct Investment of BRICS Countries – an Insight into Econometric Models.” ICTACT Journal on Management Studies 3 (1): 440–46. https://doi.org/10.21917/ijms.2017.0059.
- Qiu, S., T. Lei, J. Wu, and S. Bi. 2021. “Energy Demand and Supply Planning of China Through 2060.” Energy 234:121193. https://doi.org/10.1016/j.energy.2021.121193.
- Raghavendra, C., M. Rampilla, V. R. Thanikella, and I. Gupta. 2022. “Impact of Carbon Tax and Environmental Regulation on Inbound Cross-Border Mergers and Acquisitions Volume: An Evidence from India.” International Journal of Financial Studies 10 (4): 106. https://doi.org/10.3390/ijfs10040106.
- Roelfsema, M., H. L. Van Soest, M. Harmsen, D. P. Van Vuuren, C. Bertram, M. Den Elzen, and S. S. Vishwanathan. 2020. “Taking Stock of National Climate Policies to Evaluate Implementation of the Paris Agreement.” Nature Communications 11 (1): 1–12. https://doi.org/10.1038/s41467-020-15414-6.
- Sahlian, D. N., A. F. Popa, V. C. Banţa, C. M. Răpan, and S. C. Chiriac. 2023. “The Value Relevance of Financial Performance and ESG Scores During Tumultuous Economic Periods.“ Eastern European Economics 1–19. https://doi.org/10.1080/00128775.2023.2225500.
- Scott, K., C. J. Smith, J. A. Lowe, and L. G. Carreras. 2022. “Demand Vs Supply-Side Approaches to Mitigation: What Final Energy Demand Assumptions are Made to Meet 1.5 and 2° C Targets?” Global Environmental Change 72:102448. https://doi.org/10.1016/j.gloenvcha.2021.102448.
- Shah, K. U., S. Arjoon, and M. Rambocas. 2016. “Aligning Corporate Social Responsibility with Green Economy Development Pathways in Developing Countries.” Sustainable Development 24 (4): 237–53. https://doi.org/10.1002/sd.1625.
- Shi, W., Y. Zhang, and R. E. Hoskisson. 2017. “Ripple Effects of CEO Awards: Investigating the Acquisition Activities of Superstar CEOs’ Competitors.” Strategic Management Journal 38 (10): 2080–102. https://doi.org/10.1002/smj.2638.
- Sinsel, S. R., X. Yan, and A. Stephan. 2019. “Building Resilient Renewable Power Generation Portfolios: The Impact of Diversification on investors’ Risk and Return.” Applied Energy 254:113348. https://doi.org/10.1016/j.apenergy.2019.113348.
- Smimou, K. 2015. “Regional Equity Market Conditions and Cross-Border Mergers and Acquisitions (M & A): Evidence from the BRIC, Eastern Europe, and Africa.” International Journal of Emerging Markets 10 (3): 535–59. https://doi.org/10.1108/IJoEM-09-2013-0157.
- Ştefan, G. M., D. L. Trașcă, D. N. Sahlian, A. F. Popa, L. M. Iacob, and S. C. Chiriac. 2023. “Private and Public Digitalization and Economic Resilience during COVID-19 Pandemic.“ Electronics 12 (5): 1224. https://doi.org/10.3390/electronics12051224.
- Su, C., H. Chang, T. Chang, and C. Lee. 2012. “Purchasing Power Parity for BRICS: Linear and Nonlinear Unit Root Tests with Stationary Covariates.” Applied Economics Letters 19 (16): 1587–91. https://doi.org/10.1080/13504851.2011.639732.
- Tafuro, A., G. Dammacco, P. Esposito, and G. Mastroleo. 2022. “Rethinking Performance Measurement Models Using a Fuzzy Logic System Approach: A Performative Exploration on Ownership in Waste Management.” Socio-Economic Planning Sciences 79:101092. https://doi.org/10.1016/j.seps.2021.101092.
- Theerthaana, P., and C. J. Arun. 2021. “Did Double Lockdown Strategy Backfire? Cobra Effect on Containment Strategy of COVID-19.” International Journal of Disaster Risk Reduction 65:102523. https://doi.org/10.1016/j.ijdrr.2021.102523.
- UNCTAD. World Investment Report. Investing in Sustainable Recovery 2021. Accessed October 10, 2022a. https://unctad.org/system/files/official-document/wir2021_en.pdf.
- UNCTAD. World Investment Report. Investment and the Digital Economy 2017. Accessed November 10, 2022b. https://unctad.org/en/PublicationsLibrary/wir2017_en.pdf.
- UNDP. 2022. Human Development Report 2021-2022. Accessed November 10, 2022). https://hdr.undp.org/content/human-development-report-2021-22.
- Veltri, S., A. Venturelli, and G. Mastroleo. 2015. “Measuring Intellectual Capital in a Firm Belonging to a Strategic Alliance.” Journal of Intellectual Capital 16 (1): 174–98. https://doi.org/10.1108/JIC-06-2014-0069.
- Verde, S. 2008. “Everybody Merges with Somebody—The Wave of M&As in the Energy Industry and the EU Merger Policy.” Energy Policy 36 (3): 1125–33. https://doi.org/10.1016/j.enpol.2007.11.023.
- Very, P., and D. Schweiger. 2001. “The Acquisition Process as a Learning Process: Evidence from a Study of Critical Problems and Solutions in Domestic and Cross-Border Deals.” Journal of World Business 36 (1): 11–31. https://doi.org/10.1016/S1090-9516(00)00052-3.
- Victor, D. 2022. “World Population Reaches 8 Billion,” U.N. Says 2022, The New York Times. Accessed November 10, 2022. https://www.nytimes.com/2022/11/15/world/world-population-8-billion.html.
- Vishal, C. 2020. “Fpi/Fii Investment Trends in India Financial Markets.” International Journal of Advanced Research in Management and Social Sciences 9 (2): 30–37.
- Wang, W., L. W. Fan, and P. Zhou. 2022. “Evolution of Global Fossil Fuel Trade Dependencies.” Energy 238:121924. https://doi.org/10.1016/j.energy.2021.121924.
- Wang, Q., R. Jiang, and L. Zhan. 2019. “Is Decoupling Economic Growth from Fuel Consumption Possible in Developing Countries?,a Comparison of China and India.” Journal of Cleaner Production 229:806–17. https://doi.org/10.1016/j.jclepro.2019.04.403.
- Wang, Y., Y. Lu, G. He, C. Wang, J. Yuan, and X. Cao. 2020. “Spatial Variability of Sustainable Development Goals in China: A Provincial Level Evaluation.” Environmental Development 35:100483. https://doi.org/10.1016/j.envdev.2019.100483.
- Waterworth, A., and M. J. Bradshaw. 2018. “Unconventional Trade-Offs? National Oil Companies, Foreign Investment and Oil and Gas Development in Argentina and Brazil.” Energy Policy 122:7–16. https://doi.org/10.1016/j.enpol.2018.07.011.
- World Bank. 2022a. “GDP Growth 2022.” Accessed November 10, 2022a. https://data.worldbank.org/indicator/NY.GDP.MKTP.KD.ZG.
- World Bank. 2022b. “The World Bank in India 2016.” Accessed November 8, 2022b. https://www.worldbank.org/en/country/india/overview.
- Xie, Z., H. S. Yi, and Y. Zhang. 2013. “The Value of Big N Target Auditors in Corporate Takeovers.” Auditing: A Journal of Practice & Theory 32 (3): 141–69. https://doi.org/10.2308/ajpt-50405.
- Yang, J., S. K. A. Rizvi, Z. Tan, M. Umar, and M. A. Koondhar. 2021. “The Competing Role of Natural Gas and Oil as Fossil Fuel and the Non-Linear Dynamics of Resource Curse in Russia.” Resources Policy 72:102100. https://doi.org/10.1016/j.resourpol.2021.102100.
- Yergin, D. 2011. The Prize: The Epic Quest for Oil, Money & Power. New York: Simon and Schuster Inc.
- Zadeh, L. A. 1965. “Fuzzy Sets.” Information & Control 8 (3): 338–53. https://doi.org/10.1016/S0019-9958(65)90241-X.
- Zadeh, L. A. 1973. “Outline of a New Approach to the Analysis of Complex Systems and Decision Processes.” IEEE Transactions on Systems, Man, and Cybernetics 1 (1): 28–44. https://doi.org/10.1109/TSMC.1973.5408575.
- Zalasiewicz, J., M. Williams, A. Smith, T. L. Barry, A. L. Coe, P. R. Bown, P. Brenchley, et al. 2008. “Are We Now Living in the Anthropocene?”. Accessed September 10, 2022. https://www.geosociety.org/gsatoday/archive/18/2/pdf/i1052-5173-18-2-4.pdf.
- Zhao, X., Y. Ke, J. Zuo, W. Xiong, and P. Wu. 2020. “Evaluation of Sustainable Transport Research in 2000–2019.” Journal of Cleaner Production 256:120404. https://doi.org/10.1016/j.jclepro.2020.120404.
- Zorpas, A. A. 2020. “Strategy Development in the Framework of Waste Management.” Science of the Total Environment 716:137088. https://doi.org/10.1016/j.scitotenv.2020.137088.