
abstract
There is consensus among scholars and policy makers that knowledge is one of the key drivers of long-run economic growth. It is also clear from the literature that not all knowledge has the same value. However, too often in economic geography and cognate fields we have been obsessed with counting knowledge inputs and outputs rather than assessing the quality of knowledge produced. In this article we measure the complexity of knowledge, we map the distribution and the evolution of knowledge complexity in US cities, and we explore how the spatial diffusion of knowledge is linked to complexity. Our knowledge complexity index rests on the bimodal network models of Hidalgo and Hausmann. Analysis is based on more than two million patent records from the US Patent and Trademark Office that identify the technological structure of US metropolitan areas in terms of the patent classes in which they are most active between 1975 and 2010. We find that knowledge complexity is unevenly distributed across the United States and that cities with the most complex technological structures are not necessarily those with the highest rates of patenting. Citation data indicate that more complex patents are less likely to be cited than less complex patents when citing and cited patents are located in different metropolitan areas.
What is important in knowledge is not quantity, but quality. It is important to know what knowledge is significant, what is less so, and what is trivial.
—Tolstoy Citation1997, 331
It has become commonplace to regard the production of knowledge and the diffusion of that knowledge across space as key to understanding the uneven geography of growth and development (Schumpeter Citation1942; Solow Citation1956; Nelson and Winter Citation1982; Romer Citation1990; Corrado and Hulten Citation2010; OECD Citation2013). Although knowledge has always been a critical input to production, the centrality of its role to capitalist competition has grown recently as global commodity markets have been increasingly integrated (Dunning Citation2002; Dicken Citation2007). This does not mean that the usual foundations of profitability have been flattened, that there are no longer lower-cost sites of production for particular goods, or richer markets, but rather that a growing number of firms from around the world have increased access to such sites for more and more segments of their value chains. In this environment, knowledge that is spatially sticky, difficult to create, or to move outside the region of its production, has taken on added importance (Lundvall and Johnson Citation1994; Markusen Citation1996; Gertler Citation2003). For many firms and regions of the industrialized world, competitive advantage hinges on the production of high-value, nonubiquitous, complex and tacit knowledge (Maskell and Malmberg Citation1999; Asheim and Gertler Citation2005).
It has proven difficult to subject these claims to broad empirical scrutiny because we lack measures of the complex nature of knowledge. Far too often the empirical literature on technological change offers simple counts of knowledge inputs and outputs rather than assessing the characteristics of knowledge produced. There are some notable exceptions. Graff (Citation2006) identifies the characteristics of local knowledge bases from patent filings in German cities; Ejermo (Citation2009) uses information on citations, multicountry filing, and litigation to value patents across Swedish regions; and Quatraro (Citation2010) links the coherence of local patent stocks to regional growth in Italy. There is also an emerging literature on the geography of high-value or breakthrough patents (Castaldi, Frenken, and Los Citation2015), and Fleming and Sorenson (Citation2001) provide a measure of the complexity of individual patents based on the interdependence of the subclasses they combine. However, at this time, we have no readily available measure of the complexity of regional knowledge stocks.
The primary goal of this article is to calculate the knowledge complexity of US cities from 1975 to 2010, to map spatial variations in knowledge complexity, and to explore the evolution of complexity across the US urban system. A secondary goal is to explore the geographic mobility of knowledge in relation to its complexity. In order to meet these goals, we extend the bimodal network model of Hidalgo and Hausmann (Citation2009) and compute a knowledge complexity index (KCI) for US Metropolitan Statistical Areas (MSAs). Our analysis rests on more than two million patent records from the US Patent and Trademark Office (USPTO) that identify the technological structure of US cities in terms of the patent classes in which they are most active. The KCI reveals whether the knowledge developed in a given city can easily be (re)produced in many other MSAs or if it is so sophisticated that it can only be produced in a few key centers of invention. We find that knowledge complexity is unevenly distributed in the United States and that cities with the most complex technological structure are not necessarily the ones with the highest rates of patenting. Using patent citation data, we show also that as knowledge increases in complexity, it becomes less geographically mobile. Together, these results provide empirical support for much of the recent theoretical literature in economic geography that links regional competitive advantage to spatial concentrations of complex and tacit knowledge.
The rest of the article is organized as follows. The next section provides a brief review of relevant literature, along with some further justification for our focus on patents. Following that, we describe construction of the city–tech knowledge network, the analytical backbone of our methodology. The structural analysis of this network and the underlying principles of the KCI are discussed in the next section. The penultimate section presents empirical evidence on the geography and evolution of knowledge complexity in US cities, alongside exploration of the flow of more and less complex knowledge. The final section offers some preliminary conclusions and directions for future research.
Literature Review
Economic geographers have long recognized geographic patterns of specialization in the distribution of industries (Scott Citation1996; Ellison and Glaeser Citation1999), in techniques of production (Rigby and Essletzbichler Citation1997, Citation2006), in organizational and institutional formations (Saxenian Citation1994; Storper Citation1997), and in research and development (Audretsch and Feldman Citation1996). That subsets of knowledge, or technological know-how, emerge in different places is strong evidence of the existence of localized communities of practice (Lawson and Lorenz Citation1999) that reflect place-specific sets of technological competences, capabilities, and institutional relations (Storper Citation1993; Gertler Citation1995; Boschma and Frenken Citation2007).These capabilities are often built up over long periods of time, and they shape the environment in which subsequent choices are made (Essletzbichler and Rigby Citation2007). Grabher (Citation1993) argues that the path-dependent nature of economic evolution locks some regions into technological regimes that yield diminishing returns, although Saxenian (Citation1994) provides compelling evidence of regional variations in the capacity to maintain innovation. Long-run creativity in regions is linked to institutional practices that foster open knowledge architectures, absorptive capacity, and connections to pools of knowledge generated elsewhere (Cohen and Levinthal Citation1990; Bathelt, Malmberg, and Maskell Citation2004; Asheim and Coenen Citation2005).
The persistence of regional differences in knowledge bases suggests not only that invention is cumulative in nature, resulting from the recombination of existing ideas and from processes of search that tend to be localized, but also that knowledge subsets developed in one location are often difficult to replicate elsewhere. David (Citation1975) and Nelson and Winter (Citation1982) argue that the cumulative nature of much technological change is limited by the sunk costs of accumulating experience. These claims are reinforced by models of search in which costs of exploration rise steeply outside the boundaries of familiar knowledge terrain (Atkinson and Stiglitz Citation1969; Binswanger Citation1974; Stuart and Podolny Citation1996; Antonelli Citation2005).
The difficulties of moving certain kinds of knowledge are discussed by Kogut and Zander (Citation1992), Lundvall (Citation1988), and Gertler (Citation1995). Kogut and Zander (Citation1992) envision the firm as a coherent set of organizing principles, similar to the routines of Cyert and March (Citation1963) and Nelson and Winter (Citation1982), that link and combine complex and tacit knowledge held by skilled workers in collective sets of procedures, which often themselves embody a tacit dimension. When these routines are shared across economic agents in agglomerations, united by traded and untraded interdependencies (Marshall Citation1920; Storper Citation1995), our conception of the knowledge-based region emerges (Lundvall and Johnson Citation1994; Tallman et al. Citation2004; Asheim and Gertler Citation2005). In both these visions, knowledge-based firms and knowledge-based regions are more than simply the sum of their (knowledge) parts. In an all too often used aphorism, adulterated from Polanyi (Citation1966), regions, like firms, know more than they can tell.
Though considerable theoretical effort has been directed toward uncovering what it takes to be a learning region or a knowledge economy, much less attention has been given to the character of knowledge produced in regions. One of the primary reasons we know so little about the spatial composition of knowledge is that we lack precise measures of knowledge and technology (Pavitt Citation1982). Recent work has attempted to capture differences in the nature of knowledge cores over space. Inspired by measures of the technological distance between firms (Jaffe Citation1986) and measures of technological coherence (Teece et al. Citation1994), Graff (Citation2006), Kogler, Rigby, and Tucker (Citation2013), and Rigby (Citation2015) use patent data to measure distances between classes of technologies and provide visualizations of national and local knowledge spaces and their evolution over time. Boschma, Balland, and Kogler (Citation2015) and Rigby (Citation2015) explore how the structure of these spaces guide localized trajectories of knowledge development through patterns of technological abandonment and diversification extending work on relatedness (Hidalgo et al. Citation2007; Neffke Citation2009).
That inventions differ in their novelty and value is broadly understood (Sahal Citation1981; Dosi Citation1982; Abernathy and Clark Citation1985; Christensen Citation1997), and there have been numerous attempts to assess the quality and the value of individual patents using forward citations Trajtenberg (Citation1990) and composite indicators, including citations, family size, renewals, and litigation (Harhoff, Schere, and Vopel Citation2003; Lanjouw and Schankerman Citation2004). Ejermo (Citation2009) uses these methods to weight patent counts across Swedish regions. In related research, Schoenmakers and Duysters (Citation2010) trace the technological origins of blockbuster patents to the number of knowledge domains they combine. Kelley, Ali, and Zahra (Citation2013) use a similar definition in their examination of breakthrough patents in the drug and semiconductor sectors. Verspagen (Citation2007) also uses patents and citation data related to fuel cells to uncover critical branching points in knowledge development that steer subsequent trajectories of technological development.
Although patent valuations provide one indicator of the value of knowledge held by firms and located in different regions, another critical dimension of the competitive advantage conveyed by knowledge is its inimitability. Nickerson, Silverman, and Zenger (Citation2007) argue that both value creation and capture sit at the core of strategic management theory and the knowledge-based view of the firm. This raises the question of what makes knowledge more or less difficult to replicate. The cost of acquisition is critical for some (Howells Citation2002), and is thought to rise with the tacit nature of knowledge and its complexity (Cavusgil, Calantone, and Zhao Citation2003), although the cost of its absorption is key for others (Cohen and Levinthal Citation1990). For Simon (Citation1962), the complexity of different knowledge architectures influences their potential exclusivity and value.
Which regions hold the most valuable knowledge, especially knowledge that is complex and tacit and thus difficult to access? So far it has proven difficult to answer this question, at least in part because we have no readily available measures of the complexity or the tacit nature of knowledge located in particular places. Fleming and Sorenson (Citation2001) offer a model of search-based, recombinant innovation that rests on the complexity of knowledge. They provide a measure of complexity for individual patents using estimates of the difficulty of combining knowledge subsets represented by different technology subclasses in USPTO data. Hidalgo and Hausmann (Citation2009) develop a quite different measure of product and place complexity based on the product-level diversity of national economies and the range of countries across which individual products are produced. They argue that individual countries develop different core competences, and places that amass larger sets of capabilities tend to produce more specialized products. These specialized (complex) goods tend to be produced by relatively few economies and form the basis for longer-run competitive advantage. In this article, we develop the arguments of Hidalgo and Hausmann (Citation2009) to examine the complexity of knowledge produced in cities and regions of the United States.
The intuition behind our measure of knowledge complexity is simply that some kinds of knowledge are more difficult to develop or to replicate than others. This relatively trite observation underpins knowledge-based visions of the firm (Grant Citation1996) and associated arguments about the knowledge economy and its geographic unevenness (Maskell and Malmberg Citation1999). Precisely what makes knowledge more or less complex is unclear. The complexity science model of Simon (Citation1962) and Kauffman (Citation1993) rests on the variety of knowledge components that comprise new ideas. The tacit knowledge claims of Polanyi (Citation1966) suggest that some forms of knowledge reside in our subconscious, and that they are difficult to articulate and often embodied in collective social routines that are not separable (see also Gertler Citation2003). The aim of this article is not to try to discriminate between these ideas, because they provide interesting and productive frameworks for understanding the heterogeneity of knowledge and the implications of that heterogeneity for economic geography. Neither do we see the need to develop an alternative model of knowledge complexity. This does not mean that the indices of knowledge complexity that we derive are to be interpreted as measures of tacit knowledge or of the density of the knowledge subsets that form new knowledge types: indeed, they are not. Our measures reflect the apparent difficulty with which different kinds of knowledge can be produced across US metropolitan areas.
A question might be raised at this juncture concerning our focus on patents as important signifiers of economic potential. Though it is clear that technological change represents a key driver of economic growth and that patents provide perhaps the most comprehensive index of new technology, at least for the industrialized world (see Jaffe and Trajtenberg Citation2002), it is less clear that the characteristics of invention are correlated with economic performance at the city–region level. Though Pavitt (Citation1982) and Griliches (Citation1990) provide early reviews of the use and abuse of patent data, it is now relatively well established that patents, as measures of innovation, are positively linked to firm valuations and future performance (Ernst Citation2001; Bloom and Van Reenen Citation2002; Balasubramanian and Sivadasan Citation2011). Since Acs, Anselin, and Varga (Citation2002) established that patents provide reliable proxies for innovation at the regional level, a large body of work has emerged on the regional knowledge production function (see Audretsch and Feldman Citation2004). Related research clearly establishes links between the volume and character of regional knowledge bases and economic growth (Akçomak and ter Weel Citation2009; Quatraro Citation2010).
The City–Tech Knowledge Network
The analytical core of our measure of knowledge complexity is the city–tech knowledge network that connects cities to the technological knowledge they develop. This is a two-mode network (Borgatti Citation2009), the structure of which emerges out of the linkages between nodes of different types,Footnote1 in this case between cities and technologies (see ). This type of network is also referred to as a bipartite, bimodal, or an affiliation network in the network science literature (Opsahl Citation2013). Typical examples of two-mode networks are individual-event networks (Davis, Gardner, and Gardner Citation1941), interlocking directorates (Robins and Alexander Citation2004), predator–prey networks (Allesina and Tang Citation2012), or firm–projects networks (Balland Citation2012). Although we focus on a network of cities and technologies, the structural analysis of two-mode networks formed by other types of spatial units and knowledge domains offers various ways for understanding geographies of innovation. Following Hidalgo and Hausmann (Citation2009), we show that the particular architecture of the city–tech network reveals the relative capacity of cities to produce complex technological knowledge.
Figure 1. The (two-mode) city–tech network.
Note: The connections represent the production of knowledge in technology class T by city C.
To construct the city–tech knowledge network, we use patent documents from the USPTO for the years 1975 to 2010. The connections between cities and technologies are established over time as inventors in cities develop new knowledge (patents) in given technological fields.Footnote2 Patent data provide precise and systematic information on the production of knowledge in different technology fields (the T nodes in ) over space (the C nodes in ) and time. These are crucial inputs for construction of the two-mode network. Since we are interested in the timing of new knowledge creation, we use the application year to date individual patents. In the process of examination, each (granted) patent is allocated to one or more distinct technology classes that reflect the technological characteristics of the new knowledge created. By the end of 2004, there were 438 primary technology classes of utility patents in use by the USPTO (see Strumsky, Lobo, and van der Leeuw Citation2012). In this article, we fractionally split individual patents across all the technology classes in which they claim novelty such that all patents have a weight of unity. Patent documents also provide information on the places of knowledge production by referencing the address of inventors. We only consider patents where the primary inventor resides in the United States, and in cases of co-invention, patents are fractionally split across metropolitan areas where inventors are located.Footnote3
More formally, we represent the geography of technological knowledge production as an n by k two-mode matrix. The resulting network involves n = 366 cities (MSAs) and k = 438 technological domains or classes. In this n*k matrix, the weight of each edge xc,i is the number of patents produced in city c in technological category i (c = 1,…, n; i = 1, …, k). We divide the years for which we have patent data into subperiods and construct two-mode city–knowledge networks for each of these periods. shows a visual representationFootnote4 of the city–tech knowledge network for the period 2001–2010. For clarity, the network visualization presented in does not show the full two-mode network structure, but rather a summary of its structure using a maximum spanning tree algorithm. The maximum spanning tree of the n*k city–tech knowledge network is the n*k subgraph with (n + k - 1) edges, which has a maximum total weight. This is the backbone of the network. Two rules apply: (1) the network should stay fully connected, that is, no isolates (cities or technologies) should be generated while removing the links; and (2) the sum of the weight of the links of the subgraph should be the highest possible. Of course, this visualization only gives a general idea of the city–tech knowledge network, and the structural analysis presented in the next section is based on the full network.
Figure 2. The structure of the city–tech knowledge network (2001–2010).
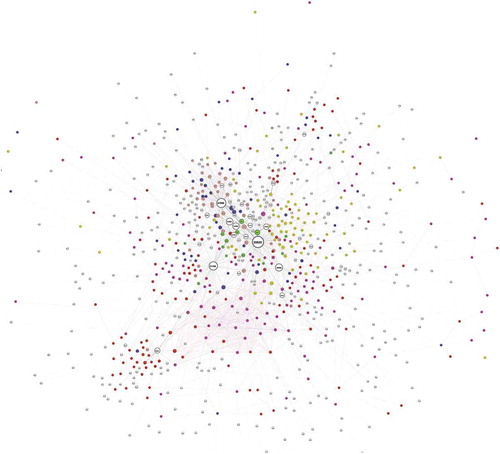
In , cities are represented by white nodes, while technologies are represented by colored nodes. Each color corresponds to one of six aggregate patent categories identified by Hall, Jaffe, and Trajtenberg (Citation2001). The position of cities in the knowledge space reflects the technological classes in which they have relative technological advantage (RTA) as well as the density of their patents across these classes. shows, for instance, the specialization of San José in computers and communications and electrical and electronics technologies, along with the smaller ICT/electronics hub in Austin. San Francisco is pulled a little away from those technologies toward biotechnology and pharmaceutical knowledge fields more generally. More diversified cities like New York and Boston occupy the center of the knowledge space, a region where links between technology nodes are particularly dense and where there are strong possibilities for technological recombination as existing competences can be readily redeployed. Los Angeles and Chicago are only slightly removed from the knowledge core. Detroit occupies a more peripheral location, embedded in a mechanical cluster within the knowledge space, a cluster that is by now somewhat less well-connected to other technologies. Houston and Pittsburgh also occupy somewhat more peripheral parts of knowledge space.
As is often the case in complex networks research, the visual representation of the two-mode network is limited by the number of nodes and ties that can be identified. Despite major advances in layout algorithms for large-scale networks, visualization can only offer preliminary insights into the structure of the city–tech knowledge network. We turn to a more comprehensive, statistical analysis of that structure below.
Knowledge Complexity Index
Simultaneously combining information on (1) which cities produce specific technologies and (2) how common specific technologies are across cities, it is possible to measure the knowledge complexity of a city’s technological portfolio for a given period of time. This KCI is based on the method of reflections developed by Hidalgo and Hausmann (Citation2009). In their pioneering work, Hidalgo and Hausmann show that the economic complexity of a country is reflected by the product composition of its export basket, taking into account the relative composition of the export baskets of all other countries. The main idea in their analytical framework is that more complex economies produce more exclusive goods, that is, nonubiquitous commodities that are sourced in relatively few countries in total. Countries with complex economic structures experience a privileged source of comparative advantage, a form of spatial–technological monopoly from which they extract rents. Countries that produce goods that are widely imitated by others, commodities that are ubiquitous, tend to have low scores in terms of economic complexity. Following this approach, we analyze the architecture of the city–tech knowledge network, and we show that a city has a complex technological composition if it produces knowledge that relatively few other cities are able to imitate.
To construct our index of knowledge complexity we only consider cities that are significant producers of particular technologies. As a result, it should be noted that the city–tech knowledge network that is used to compute the KCI is based only on technological classes in which a city has an RTA in terms of patenting activity. The US city–tech knowledge network is operationalized as a n*k two-mode matrix , where
reflects whether or not city c has RTA in the production of technological knowledge i (c = 1,…, n; i = 1, …, k). A city, c, has RTA in technology i at time t if the share of technology i in the city’s technological portfolio is higher than the share of technology i in the entire US patent portfolio. More formally,
if
Following the method of reflections, the KCI sequentially combines two variables: the diversity of cities and the ubiquity of technological classes. These two variables correspond to the two-mode degree centrality of both sets of nodes in the city–tech knowledge network. The degree centrality of cities (Kc,0) is given by the number of technological classes in which each city has RTA (diversity):
where is defined above. Similarly, the degree centrality of technological classes (Ki,0) is given by the number of cities that exhibit RTA in a particular class (ubiquity):
Hidalgo and Hausmann (Citation2009) show that measures of knowledge complexity for both cities and technologies can be found by sequentially combining these measures of diversity and ubiquity in the following two equations over a series of n iterations:
To provide some further interpretation of this method, in a second iteration, for n = 1, in equation (3) represents the average ubiquity of the technologies in which city c has RTA. In similar fashion,
in equation (4) measures the average diversity of cities that have RTA in technology i. In the next iteration,
captures the average diversity of cities that have technology baskets similar to city c, and
reveals the average ubiquity of the technologies developed in cities that have RTA in technology class i. Each additional iteration in
(equation 3) yields a finer-grained estimate of the knowledge complexity of a city using information on the complexity of the technologies in which the city exhibits RTA. Each additional iteration in
(equation 4) provides a finer-grained estimate of the knowledge complexity of a technology using information on the complexity of cities that have RTA in that technology. Although higher-order iterations in this technique become progressively more difficult to define, the method of reflections provides more and more precise measures of the KCI of cities and technologies, as noise and size effects are eliminated. The iterations are stopped when the ranking of cities and technologies is stable from one step to another (i.e., no further information can be extracted from the structure of the city–tech network).
Caldarelli et al. (Citation2012) show that the iterative method of reflections is an approximation of a fixed-point theorem based on Markov chain analysis.Footnote5
Additional metrics derived from this mathematical reformulation are outlined in Tacchella et al. (Citation2012). We use this alternative methodology to calculate the KCI for cities and technology classes in the US city–tech knowledge network. The binary n*k two-mode matrix M is the primary input in this method. We row standardize matrix M and then row standardize its transpose . The product
is a square matrix with dimension equal to the number of metropolitan areas in our network (366). The elements along the principal diagonal of B represent the average ubiquity of the technology classes in which the row and column city has RTA. The off-diagonal elements represent the product of the technology classes in which city (row) i has RTA and the ubiquity of the technology classes in which city (column) j has RTA. These elements thus capture the similarity in the technological structure of pairs of cities. The KCI for each city is provided by the second eigenvector of matrix B. Note that reversing the order of matrix multiplication generates the square matrix D =
that has a dimension of 438, equal to the number of technology classes in the city–tech knowledge network. The second eigenvector of D yields the KCI for each technology class.
The Geography of Complex Knowledge
In this section, we present results of the structural analysis of the city–tech knowledge network with a particular focus on cities.Footnote6 We concentrate attention on the KCI for the latest period (2001–2010), and we report how the complexity of the knowledge base of cities has evolved since the first ten-year period examined (1975–84).Footnote7
To begin our investigation of the structure of the US city–tech knowledge network, we follow Hidalgo and Hausmann (Citation2009) and analyze the relationship between the diversity of the technologies produced by a city and the average ubiquity of these technologies. shows the relationship between the diversity of cities and the average ubiquity of technologies they produce
for the period 2001–2010.Footnote8
A high value of
means that the technological structure of the city is diversified, and a low value of
means that the city produces sophisticated, or nonubiquitous, technologies on average. The strong negative relationship between these two indicators indicates that cities with more diversified technological structures tend to produce more exclusive (i.e., less ubiquitous) technologies.
Figure 3. City diversity and average ubiquity of technologies produced (2001–2010).
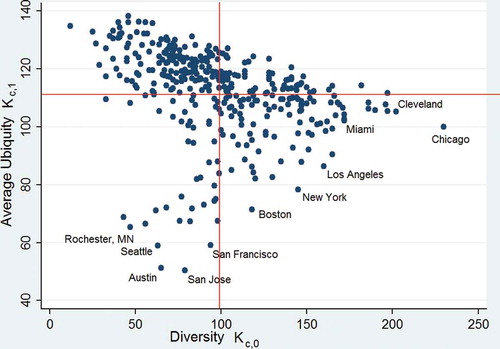
Plotting the mean of diversity (vertical line) and the mean of average ubiquity (horizontal line) we divide the graph in four quadrants. In the bottom left quadrant, we find cities that have RTA in relatively few technological classes that are nonubiquitous. These cities, including San José, Austin, San Francisco, and Seattle, produce some of the most sophisticated new technologies. In the top left quadrant of the graph, we also find cities that have RTA in only a few technological classes, but these cities (such as Anchorage, Springfield, and Carson City) produce relatively ubiquitous technologies. On the right-hand side of the graph, we find larger, more diversified cities, producing sophisticated technologies in the bottom quadrant (e.g., Chicago, Los Angeles, and New York) and cities producing more ubiquitous technologies in the upper quadrant (Oklahoma City, New Orleans).
Looking at the diversity and average ubiquity of technologies provides interesting preliminary insights on the distribution of knowledge production in the United States that cannot be captured by simply counting aggregate knowledge outputs such as patents. These indicators, however, are based only on a small fraction of the entire structure of the city–tech knowledge network. Exploiting all information in this network, using the methods above, we are able to characterize the full complexity of the knowledge structure of all 366 MSAs across the United States. This complexity is mapped in for the most recent period, 2001–2010.
Figure 4. Technological knowledge complexity in US cities (2001–2010).
The KCI for US cities is quite heterogeneous as reveals. Knowledge complexity is relatively high (KCI > 70) in Austin, San José, Rochester (MN), and San Francisco. These metropolitan areas tend to develop a number of technologies that can only be replicated in a small number of other US cities. Knowledge production is of moderately high complexity (60 < KCI < 70) in Burlington (VT), Santa Cruz, Portland (OR), Seattle, Boise, Poughkeepsie, and the Research Triangle cities of North Carolina. It is clear from that the leading centers of complex knowledge production are scattered across the nation. Many of the places that round out the top 10 percent of complex knowledge producing locations are cities with well-known research universities.
provides a listing of the top twenty US cities in terms of knowledge complexity over the period 2001–2010. The KCI values and ranks of several other large cities are also reported, along with a ranking of cities in terms of patents per worker. The metropolitan areas that top the KCI rankings are generally those that rank highly in terms of patents per worker. Indeed, the Spearman rank correlation between the KCI rankings and the patents per worker rankings across all 366 metropolitan areas is 0.46. However, this relationship tends to unravel further down the rank order. For example, Detroit ranks 39 in terms of patents per worker but falls to 209 in the KCI ranking. Thus, Detroit is producing a substantial number of patents that could easily be produced by other metropolitan areas. Many other cities across the rustbelt of the United States exhibit similar ranking profiles (Cleveland loses 102 places from the ranking of patents per worker to the KCI ranking, Akron 184 places, Milwaukee 112 places, and Flint 229 places). There are also cities that rank considerably higher in terms of KCI than patents per worker. Washington, DC, New York, and Phoenix produce more complex patents than their rate of patenting would predict. In general, these results suggest that looking at knowledge quality, as well as knowledge quantity, provides a somewhat different picture of the distribution of knowledge production in the United States.
Table 1 Knowledge Complexity Index of Selected MSAs (2001–2010)
reports knowledge complexity for the top ten USPTO technology classes for patents generated between 2001 and 2010. The USPTO class descriptions are provided along with the values of ubiquity (the number of metropolitan areas that have RTA in each class). The mean ubiquity value for technology classes over the period 2001–2010 is 82.8. In general, the most complex technologies have relatively low ubiquity values, though not necessarily the lowest. (Note that the KCI reflects not only the measures of city diversity and technological ubiquity but also the arrangement of those measures across the entire city–tech network. Thus, a technology class with a specific level of ubiquity found only in cities with other low ubiquity technologies will receive a higher complexity score than a class with the same level of ubiquity that is distributed across cities characterized by technologies with generally high levels of ubiquity.) Most of the technologies listed in are associated with computing and electronics. These are not rare technologies: most of the classes listed produce relatively large numbers of patents placing them in the top 10 percent of the most active patent classes. However, these technologies are not broadly produced across the US metropolitan system. Of the most technologically complex metropolitan areas listed in , the top three cities have RTA in all classes listed in . On average, the top ten most technologically complex cities from have RTA in 8.1 of the ten classes listed in . If we move down the ranks of metropolitan patent complexity, to cities ranked twenty-one to thirty, they average RTA in only 4.8 of the technology classes listed in .
Table 2 Technology (USPTO Class) Complexity
So far, we have presented the KCI for the most recent ten-year period, 2001–2010. Of course, cities are continuously changing their technological portfolio as they diversify into new knowledge classes and abandon old technologies (Colombelli, Krafft, and Quatraro Citation2012; Essletzbichler Citation2015; Rigby Citation2015). As a result, the complexity of knowledge in the US city–tech knowledge network is also evolving over time. reveals how knowledge complexity in US cities has changed from 1975–84 to 2001–2010. (Note that KCI values in are normalized to facilitate comparison between periods.) Cities that are located above the forty-five degree red line have improved the complexity of their technological knowledge structures, although the cities located below the line have experienced a decline in their KCI relative to other metropolitan areas. Boise, Seattle, Portland, Rochester (MN), and Austin have registered strong gains in the relative complexity of their knowledge structure. At the same time, cities such as Philadelphia, Trenton–Ewing, and New Orleans now have a significantly lower KCI than in the late 1970s.
Figure 5. Evolution of the knowledge complexity index over time.
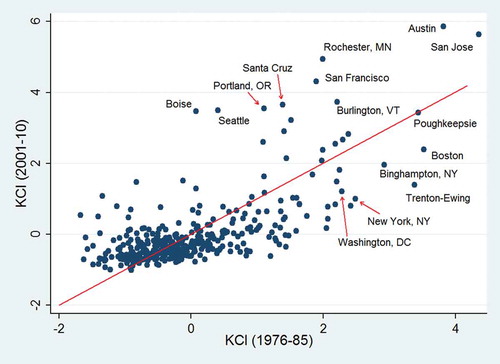
It is interesting that for most cities, the KCI is relatively stable over time. This provides some indication of strong path dependence in the evolution of technological structure. If we focus exclusively on newly added technological classes, a similar pattern emerges. The average complexity of the newly added technological classes in a city, from one period to the next, is strongly correlated with lagged KCI. These data support the arguments about knowledge development being a cumulative process of recombining existing skills and competencies.
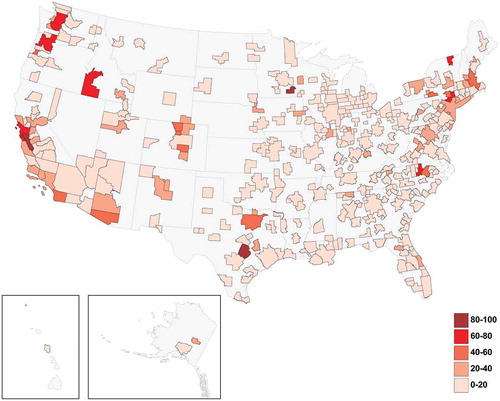
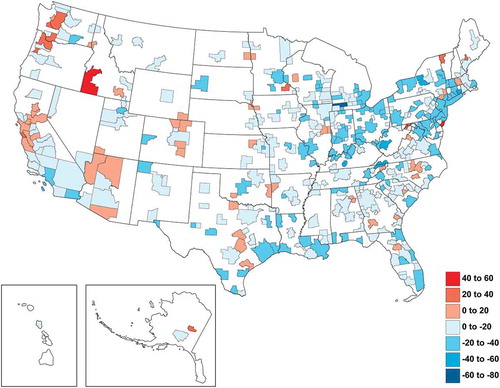
The geography of shifts in knowledge complexity by metropolitan area is shown more clearly in . The red shading in this figure indicates those metropolitan areas that have experienced increases in KCI from the period 1975–84 to 2001–2010, although the blue shading indicates declining KCI. The legend reports changes in KCI values over the two periods. shows a general decline in the complexity of knowledge produced across much of the snowbelt of the United States, along with a few cities from the South. Indeed, collecting all the metropolitan areas in the core of the US snowbelt (those in the New England, Mid-Atlantic, and East North Central census regions) shows a mean change in KCI ranks from 1975–84 to 2001–2010 of −33.8. In the core of the sunbelt (comprising the Pacific and Mountain census regions), the mean change in KCI city ranks over the same period is +72.2. The most significant gains in knowledge complexity are recorded by Boise, Seattle, Rochester (MN), and Portland (OR) over the thirty, or so, years examined. Relatively strong gains in KCI are also registered by Merced, Olympia, Santa Cruz, Austin, and Fairbanks. The largest declines in KCI are registered by Trenton–Ewing, Philadelphia, Huntsville, Syracuse, Indianapolis, Baltimore, and New York City.
Figure 6. Changes in knowledge complexity index 1975–84 to 2001–2010.
The discussion above highlights spatial unevenness in both levels and changes in knowledge complexity across US cities. These results support core theoretical claims in economic geography that relatively few cities and regions have the capacity to produce complex knowledge and that these areas are likely to be key sites of economic growth (Maskell and Malmberg Citation1999). For this argument to be sustained, it is also required that complex knowledge is relatively immobile, in large part remaining embedded in the workers, firms, and institutions of particular places (see Gertler Citation1995). Thus, we view complexity as one component of that which makes knowledge tacit. It is to this question that we turn next, using patent citations to explore how the complexity of knowledge influences its flow. We recognize that there are various channels through which knowledge flows over space between economic agents and that not all of these are captured by patent citations (see Breschi and Lissoni Citation2004). However, rarely have studies of knowledge flows incorporated information on the complexity of ideas.
presents results from our investigation of knowledge complexity and knowledge flows as captured in patent citations. In this part of the analysis, we follow Sorenson (Citation2005) and Sorenson, Rivkin, and Fleming (Citation2006) who explore how informational interdependence, a key component of complexity, influences knowledge flow. Our analysis is based on all US patents with application years in 1980, 1990, and 2000. We link these focal patents to all subsequent US patents applied for in the years 1981–85, 1991–95 and 2001–2005, respectively. The 1980 focal set of patents is linked to the potential citation set in 1981–85 and so on for the three periods analyzed. A five-year window is sufficient to capture most citations received by patents, and we are limited by censoring on the right side of our database for the last period. Of the records in the potential citation sets, some will cite the patents of the focal set and some will not. We exploit this asymmetry, loosely following the matching methodology of Jaffe, Trajtenberg, and Henderson (Citation1993), by identifying those citations that link patents in the focal set and the potential citation set, and for each of these cases identifying a control set of ten patents from the potential citation set that do not cite the focal group. This set of control patents are then randomly assigned to individual members of the original focal set of patents. We remove self-citations, based on assignees and inventors from the citation links. To clarify, there were 66,502 USPTO utility patents with an application year of 1980. Of these 38,083 had a primary inventor located in a US metropolitan area. These US patents were cited 53,363 times by subsequent US patents with an application year spanning the period 1981–85 inclusive. Removing self-citations leaves 36,790 cites to the original 1980 patents. These citations comprise our focal group of patent–citation pairs for 1980. For each of these focal patent–citation pairs, ten patents were chosen at random from the full set of patents applied for between 1981 and 1985 that did not cite the 1980 patent of the focal patent–citation pair. Thus, for 1980 the matched case-control group includes 36,790 focal patent–citation pairs along with a control group of 367,900 nonciting patents. This same matching procedure is reproduced for 1990 and 2000. This procedure goes some way toward capturing the relatively rare event of a citation actually occurring between one of the patents in the focal set and one in the potential matching set. The number of potential matched pairs in this instance is over seven billion, making identification of controls on the process of citation computationally difficult. Using citations as a proxy for knowledge flows, we estimate the following econometric equation:
Table 3 Knowledge Complexity and Knowledge Flows
where citation takes the value of one when the observation indicates an actual citation of patent i by patent j, and zero otherwise. Our models include measures of the complexity of the focal patents i as indicated by the KCI of the technology class in which they are located. (We use only the primary classes into which patents are placed for this analysis.) As complex knowledge is at the same time more valuable and more difficult to make, we do not formulate specific expectations on the sign of . The models also include a measure of distance, which is a dummy variable that takes a value of zero, when the focal and control patent are located in the same MSA, and one otherwise. We anticipate that patent pairs that are more geographically distant from one another will cite each other less (
Our main variable of interest is the interaction term between complexity and distance. The null hypothesis
indicates that distance does not have an effect on the flow of complex knowledge. From the discussion and descriptive results above on the geography of complex knowledge, we expect a negative coefficient for this partial regression coefficient, indicating that complex knowledge does not travel well. A first covariate includes time in years between the cited and citing patent pairs in the treatment group and the nonciting patent pairs in the control group. A second covariate includes the technological relatedness between patent pairs in the focal set and those in the case-control group (Rigby Citation2015). As technological proximity between members of the focal set of patents and the case-control group increase we expect the probability of citation to rise, following the frequently reported higher incidence of citations among patents in related technology classes (Jaffe and Trajtenberg Citation2002). We estimated our econometric equation using both a linear probability model (LPM) and logistic regression. Both methods produce similar results, reported in . Further concerns regarding the relatively rare nature of a patent–citation pairing also led us to experiment with Firth logits. The results from the Firth logits were no different than those we report in . In the discussion, we focus on the LPM results (models 1–3), as the economic interpretation of the interaction effect is more straightforward.
In all specifications presented in , the independent variables are mean centered, so the constant term in the LPM reflects the expected probability of knowledge flow (i.e., the chance of observing an actual citation). Therefore, the intercept is equal to the mean of the dependent variable (). Model 1 presents results of a baseline specification, including geographic distance, technological relatedness, and the time lag. As expected, the coefficient for geographic distance is negative and significant, and the coefficients for technological relatedness and the time lag are positive and significant. Model 2 adds knowledge complexity to the estimated equation. The effect is positive and statistically significant, but the economic impact is close to zero. In fact, increasing complexity by ten points increases the probability of a knowledge flow by about 0.6 percent.Footnote9
Model 3 includes the interaction term between knowledge complexity and geographic distance to explore how the probability of citing knowledge of different complexity changes with distance. The interaction variable (Knowledge complexity*Geographic distance) reveals that focal patents that are more complex have a significantly lower probability of being cited when potential inventors are not located in the city where the focal patent was developed. This result confirms our intuition that distance limits the diffusion of complex knowledge. In this specification, the main coefficient for knowledge complexity indicates the influence of knowledge complexity when a patent pair is located in the same MSA (i.e., when the dummy for geographic distance = 0). As we can see, the coefficient is positive and significant, but the economic impact is now much stronger than in the previous specification. Increasing complexity by ten points increases the probability of a knowledge flow by about 13 percent, if the inventors are located in the same MSA. However, if patents are located in different MSAs, the probability of citation does not increase as complexity increases.Footnote10
These results suggest that geographic proximity plays an important role in the diffusion of complex knowledge. Overall, these findings place even more significance on the uneven geography of complex knowledge production.
Conclusion
Knowledge is an increasingly critical dimension of competitive advantage. Although earlier research has explored the geography of patenting, this work largely treats individual patents as homogeneous, assuming that each patent adds only as much technological potential to a region’s economy as the next. However, not all patents hold the same value. Recent work has shown how the knowledge cores of countries and regions might be differentiated using patent data and measures of the technological relatedness between patents in different classes. In this article we discuss the usefulness of the concept of complex knowledge in economic geography, we present an application of the method of reflections to patent data, and we describe the geographic patterns (and shifts) of complex knowledge generated across US metropolitan areas since 1975.
A first result from our analysis reveals that there are wide geographic variations in knowledge complexity, with only a few metro regions producing the most complex new technologies at any one time. There is considerable rank stability in the positions of many cities in terms of the complexity of knowledge embodied in patents across the periods that we examined. However, many snowbelt cities, and cities in the South, have witnessed a slow decline in the complexity of the knowledge that they are producing. Across a number of metropolitan areas in the West, and a few selected cities in the East, the complexity of knowledge produced has generally increased over the last thirty years or so.
A second key finding from our analysis is that not all knowledge is spatially sticky. On the one hand, complex knowledge tends to be produced in relatively few places and, once produced, this knowledge is not easy to move. On the other hand, low complexity, more routinized, forms of knowledge are easier to move over space, at least as indicated by patent citations. In a rapidly integrating global economy, the development of low complexity knowledge is increasingly footloose and provides an insecure foundation of competitive advantage. How cities and regions might be able to transform their knowledge cores toward greater complexity is a fundamental question. Preliminary analysis suggests that as technological regimes shift, geographies of complex knowledge are also rewritten. The long-run analysis of knowledge complexity raises many interesting questions about geographies of creative destruction, urban and regional technological lock-in, and regional resilience. Much more work remains to be done on these issues and what they imply for the future of cities in the United States and across the world.
This line of research has important implications for the development and implementation of regional innovation policy. A prime illustration is the smart specialization strategy (SSS), the underlying innovation policy tool of the EU growth strategy until 2020. SSS aims to support regions in developing new research and technological areas of specialization. In this context, regions are encouraged to forge new comparative advantages by building on related, preexisting knowledge domains. This is an important starting point. But thinking in terms of complex knowledge introduces a new dimension to this framework. Innovation policy should not only support the development of related areas of potential specialization, regions should be encouraged to develop related technologies that are more complex than what they already produce. This requires either increased funding for research and education or more narrowly defined strategic investments in specific scientific and technological fields. In the long run, transforming regional knowledge structures from low complexity to high complexity will help regions reinvent themselves, upgrade their technologies, and allow them to escape some of the most debilitating forms of global competition.
Acknowledgment
We are grateful to Andrés Rodríguez-Pose and three anonymous referees for insightful comments. We thank Bernhard Truffer for suggesting an algebraic reformulation of the complexity algorithm. The research in this paper was conducted while the authors were recipients of the Utrecht University - UCLA visiting fellowship 2015 and 2016. Pierre-Alexandre Balland gratefully acknowledges financial support for part of this research from the Regional Studies Association through the Early Career Grant scheme.
Notes
1 Connections between nodes of the same mode, that is, city-city or technology-technology ties are not considered.
2 We only focus on the complexity of technological knowledge produced in cities. We do not consider artistic, cultural, or other forms of knowledge. We also recognize that not all new technological knowledge is captured by patents.
3 Using only the primary class and the primary inventor to locate patents makes little difference to results.
4 This graph has been visualized using the Gephi software.
5 We would like to thank Bernhard Truffer for pointing out the limitation of the method of reflections and suggesting an alternative algebraic solution.
6 Following this approach, we could analyze the complexity of technological classes, but this is beyond the scope of the present article.
7 We focus on ten-year periods so that we have a reasonably large number of patents over which calculations are made.
8 The relationship represented in holds for other time periods.
9 The coefficients listed in give the impact of a one-unit change on the probability of citation. Knowledge complexity ranges from zero to one hundred before centering. Therefore, increasing complexity by ten points increases the probability of citation by (0.00006*10)/0.0909 = 0.6%.
10 If patents are not co-located (different MSA), increasing complexity by ten points increases the probability of citation by (0.00124−.00122)*10/.0909 = 0.2%; so there is virtually no effect.
References
- Abernathy, W., and Clark, K. 1985. Innovation: Mapping the winds of creative destruction. Research Policy 14:3–22.
- Acs, Z. J., Anselin, L., and Varga, A. 2002. Patents and innovation counts as measures of regional production of new knowledge. Research Policy 31:1069–85.
- Akçomak, I. S., and ter Weel, B. 2009. Social capital, innovation and growth: Evidence from Europe. European Economic Review 53:544–67.
- Allesina, S., and Tang, S. 2012. Stability criteria for complex ecosystems. Nature 483:205–8.
- Antonelli, C. 2005. Models of knowledge and systems of governance. Journal of Institutional Economics 1:51–73.
- Asheim, B., and Coenen, L. 2005. Knowledge bases and regional innovation systems: Comparing Nordic clusters. Research Policy 34:1173–90.
- Asheim, B., and Gertler, M. 2005. The geography of innovation: Regional innovation systems. In The Oxford handbook of innovation, ed. J. Faberberg, D. Mowery, and R. Nelson, 291–317. Oxford: Oxford University Press.
- Atkinson, A., and Stiglitz, J. 1969. A new view of technological change. Economic Journal 79:573–78.
- Audretsch, D., and Feldman, M. P. 1996. R&D spillovers and the geography of innovation and production. American Economic Review 86:630–40.
- ———. 2004. Knowledge spillovers and the geography of innovation. In Handbook of regional and urban economics, ed. J. V. Henderson, and J. Thisse, Vol. 4, 2713–39. Amsterdam: North Holland Publishing.
- Balasubramanian, N., and Sivadasan, J. 2011. What happens when firms patent? New evidence from US economic census data. Review of Economics and Statistics 93:126–46.
- Balland, P. A. 2012 Proximity and the evolution of collaboration networks: Evidence from research and development projects within the Global Navigation Satellite System (GNSS) industry. Regional Studies 46:741–56.
- Bathelt, H., Malmberg, A., and Maskell, P. 2004. Clusters and knowledge: Local buzz, global pipelines and the process of knowledge creation. Progress in Human Geography 28:31–56.
- Binswanger, H. 1974. A microeconomic approach to induced innovation. Economic Journal 84:940–58.
- Bloom, N., and Van Reenen, J. 2002. Patents, real options and firm performance. Economic Journal, 112:C97–C116.
- Borgatti, S. 2009. 2-Mode concepts in social network analysis. In Encyclopedia of complexity and system science, ed. R. A. Meyers, 8279–91. London: Springer.
- Boschma, R., and Frenken, K. 2007. A theoretical framework for evolutionary economic geography: Industrial dynamics and urban growth as a branching process. Journal of Economic Geography 7:635–49.
- Boschma, R., Balland, P. A., and Kogler, D. 2015. Relatedness and technological change in cities: The rise and fall of technological knowledge in U.S. metropolitan areas from 1981 to 2010. Industrial and Corporate Change 24:223–50.
- Breschi, S., and Lissoni, F. 2004. Knowledge networks from patent data. In Handbook of quantitative science and technology research, ed. E. Noyons, H. Moed, W. Glanzwel, and U. Schmochl, 613–43. Amsterdam: Kluwer.
- Caldarelli, G., Cristelli, M., Gabrielli, A., Pietronero, L., Scala, A., and Tacchella, A. 2012. A network analysis of countries’ export flows: Firm grounds for the building blocks of the economy. PLOS One 7. http://journals.plos.org/plosone/article?id=10.1371/journal.pone.0047278#pone.0047278-Hidalgo2.
- Castaldi, C., Frenken, K., and Los, B. 2015. Related variety, unrelated variety and technological breakthroughs: An analysis of U.S. state-level patenting. Regional Studies 49:767–81.
- Cavusgil, S., Calantone, R., and Zhao, Y. 2003. Tacit knowledge transfer and firm innovation capability. Journal of Business & Industrial Marketing 18:6–21.
- Christensen, C. 1997. The innovator’s dilemma. Boston, MA: Harvard Business School Press.
- Cohen, W., and Levinthal, D. 1990. Absorptive capacity: A new perspective on learning and innovation. Administrative Science Quarterly 35:128–52.
- Colombelli, A., Krafft, J., and Quatraro, F. 2012. The emergence of new technology-based sectors at the regional level: A proximity-based analysis of nanotechnology. Papers in Evolutionary Economic Geography 12.11. Utrecht, the Netherlands: Utrecht University. http://econ.geo.uu.nl/peeg/peeg1211.pdf.
- Corrado, C., and Hulten, C. 2010. How do you measure a “technological revolution”? American Economic Review 100:99–104.
- Cyert, R., and March, J. 1963. A behavioral theory of the firm. Englewood Cliffs, NJ: Prentice-Hall.
- David, P. 1975. Technical choice, innovation and economic growth. Cambridge, MA: Cambridge University Press.
- Davis, A., Gardner, B., and Gardner, M. 1941. Deep south. Chicago: University of Chicago Press.
- Dicken, P. 2007. Global shift: Mapping the changing contours of the world economy. Newbury Park, CA: Sage.
- Dosi, G. 1982. Technological paradigms and technological trajectories: A suggested interpretation of the determinants and directions of technical change, Research Policy 11:147–62.
- Dunning, J. 2002. Regions, globalization and the knowledge-based economy. Oxford: Oxford University Press.
- Ejermo, O. 2009. Regional innovation measured by patent data—Does quality matter? Industry & Innovation 16:141–65.
- Ellison, G., and Glaeser, E. 1999. The geographic concentration of industry: Does natural advantage explain agglomeration? American Economic Review 89:311–16.
- Ernst, H. 2001. Patent applications and subsequent changes of performance: Evidence from time-series cross-section analyses on the firm level. Research Policy 30:143–57.
- Essletzbichler, J. 2015. Relatedness, industrial branching and technological cohesion in US metropolitan areas. Regional Studies 49:752–66.
- Essletzbichler, J., and Rigby, D. 2007. Exploring evolutionary economic geographies. Journal of Economic Geography 7:549–71.
- Fleming, L., and Sorenson, O. 2001. Technology as a complex adaptive system: Evidence from patent data. Research Policy 30:1019–39.
- Gertler, M. 1995. Being there: Proximity, organization and culture in the development and adoption of advanced manufacturing technologies. Economic Geography 71:1–26.
- ———. 2003. Tacit knowledge and the economic geography of context, or the undefinable tacitness of being (there). Journal of Economic Geography 3:75–99.
- Grabher, G. 1993. The weakness of strong ties: The lock-in of regional development in the Ruhr area. In The embedded firm: On the socioeconomics of industrial networks, ed. G. Grabher, 255–77. London: Routledge.
- Graff, H. 2006. Networks in the innovation process. Cheltenham, UK: Edward Elgar.
- Grant, R. 1996. Toward a knowledge-based theory of the firm. Strategic Management Journal 17:109–22.
- Griliches, Z. 1990. Patent statistics as economic indicators: A survey. Journal of Economic Literature 28:1661–707.
- Hall, B., Jaffe, A., and Trajtenberg, A. 2001. The NBER patent citations data file: Lessons, insights and methodological tools. Working Paper 8498. Cambridge, MA: National Bureau of Economic Research.
- Harhoff, D., Schere, F., and Vopel, K. 2003. Citations, family size, opposition and the value of patent rights. Research Policy 32:1343–63.
- Hidalgo, C., and Hausmann, R. 2009. The building blocks of economic complexity. Proceedings of the National Academy of Sciences 106:10570–5.
- Hidalgo, C., Klinger, B., Barabasi, A., and Hausmann, R. 2007. The product space conditions the development of nations. Science 317:482–87.
- Howells, J. R. 2002. Tacit knowledge, innovation and economic geography. Urban Studies 39: 871–84.
- Jaffe, A., Trajtenberg, M., and Henderson, R. 1993. Geographic localization of knowledge spillovers as evidenced by patent citations. Quarterly Journal of Economics 108:577–98.
- Jaffe, A. B. 1986. Technological opportunity and spillovers of R&D: Evidence from firms’ patents, profits and market value. Working Paper 1815. Cambridge, MA: National Bureau of Economic Research.
- Jaffe, A. B., and Trajtenberg, M. 2002. Patents, citations, and innovations: A window on the knowledge economy. Cambridge, MA: MIT Press.
- Kauffman, S. 1993. The origins of order: Self-organization and selection in evolution. New York: Oxford University Press.
- Kelley, D., Ali, A., and Zahra, S. 2013. Where do breakthroughs come from? Characteristics of high-potential inventions. Journal of Product Innovation Management 30:1212–26.
- Kogler, D., Rigby, D., and Tucker, I. 2013. Mapping knowledge space and technological relatedness in U.S. cities. European Planning Studies 21:1374–91.
- Kogut, B., and Zander, U. 1992. Knowledge of the firm, combinative capabilities, and the replication of technology. Organization Science 3:383–97.
- Lanjouw, J., and Schankerman, M. 2004. Patent quality and research productivity: Measuring innovation with multiple indicators. Economic Journal 114:441–65.
- Lawson, C., and Lorenz, E. 1999. Collective learning, tacit knowledge and regional innovative capacity. Regional Studies 33:305–17.
- Lundvall, B.-Å.1988. Innovation as an interactive process—From user-producer interaction to national systems of innovation. In Technical change and economic theory, ed. G. Dosi, C. Freeman, R. Nelson, G. Silverberg, and L. L. G. Soete, 349–67. London: Pinter.
- Lundvall, B., and Johnson, B. 1994. The learning economy. Journal of Industry Studies 1:23–42.
- Markusen, A. 1996. Sticky places in slippery space: A typology of industrial districts. Economic Geography 72:293–313.
- Marshall, A. 1920. Principles of economics. London: Macmillan.
- Maskell, P., and Malmberg, A. 1999. The competitiveness of firms and regions: ‘Ubiquitification’ and the importance of localized learning. European Urban and Regional Studies 6:9–25.
- Neffke, F. 2009. Productive places: The influence of technical change and relatedness on agglomeration externalities. PhD diss., Utrecht University.
- Nelson, R., and Winter, S. 1982. An evolutionary theory of economic change. Cambridge, MA: Harvard University Press.
- Nickerson, J., Silverman, B., and Zenger, T. 2007. The ‘problem’ of creating and capturing value. Strategic Organization 5:211–25.
- OECD. 2013. Supporting investment in knowledge capital, growth and innovation. Paris: OECD Publishing.
- Opsahl, T. 2013. Triadic closure in two-mode networks: Redefining the global and local clustering coefficients. Social Networks 35:159–67.
- Pavitt, K. 1982. R&D, patenting and innovative activities: A statistical exploration. Research Policy 11:33–51.
- Polanyi, M. 1966. The tacit dimension. New York: Doubleday.
- Quatraro, F. 2010. Knowledge coherence, variety and economic growth: Manufacturing evidence from Italian regions. Research Policy 39:1289–302.
- Rigby, D. 2015. Technological relatedness and knowledge space: Entry and exit of US cities from patent classes. Regional Studies 49:1922–37.
- Rigby, D., and Essletzbichler, J. 1997. Evolution, process variety, and regional trajectories of technological change in U.S. manufacturing. Economic Geography 73:269–84.
- ———. 2006. Technological variety, technological change and a geography of production techniques. Journal of Economic Geography 6:45–70.
- Robins, G., and Alexander, M. 2004. Small worlds among interlocking directors: Network structure and distance in bipartite graphs. Computational & Mathematical Organization Theory 10:69–94.
- Romer, P. 1990. Endogenous technological change. Journal of Political Economy 98:S71–S102.
- Sahal, D. 1981. Patterns of technological innovation. Reading, MA: Addison Wesley.
- Saxenian, A. 1994. Regional advantage: Culture and competition in Silicon Valley and Route 128. Cambridge, MA: Harvard University Press.
- Schoenmakers, W., and Duysters, G. 2010. The technological origins of radical inventions. Research Policy 39:1051–59.
- Schumpeter, J. 1942. Capitalism, socialism, and democracy. New York: Harper and Row.
- Scott, A. 1996. Regional motors of the global economy. Futures 28:391–411.
- Simon, H. 1962. The architecture of complexity. Proceedings of the American Philosophical Society 106:467–82.
- Solow, R. 1956. A contribution to the theory of economic growth. Quarterly Journal of Economics 70:65–94.
- Sorenson, O. 2005. Social networks, informational complexity and industrial geography. In The role of labour mobility and informal networks for knowledge transfer, ed. D. Audretsch, D. Fornahl, and C. Zellner, 79–95. New York: Springer.
- Sorenson, O., Rivkin, J., and Fleming, L. 2006. Complexity, networks and knowledge flow. Research Policy 35:994–1017.
- Storper, M. 1993. Regional “worlds” of production: Learning and innovation in the technology districts of France, Italy and the USA. Regional Studies 27:433–55.
- ———. 1995. The resurgence of regional economies, ten years later: The region as a nexus of untraded interdependencies. European Urban and Regional Studies 2:191–221.
- ———. 1997. The regional world: Territorial development in a global economy. New York: Guilford.
- Strumsky, D., Lobo, J., and van der Leeuw, S. 2012. Using patent technology codes to study technological change. Economics of Innovation and New Technology 21:267–86.
- Stuart, T., and Podolny, J. 1996. Local search and the evolution of technological capabilities. Strategic Management Journal 17:21–38.
- Tacchella, A., Cristelli, M., Caldarelli, G., Gabrielli, A., and Pietronero, L. 2012. A new metrics for countries’ fitness and products’ complexity. Nature Scientific Reports 2:1–7.
- Tallman, S., Jenkins, M., Henry, N., and Pinch, S. 2004. Knowledge clusters and competitive advantage. Academy of Management Review 29:258–71.
- Teece, D., Rumelt, R., Dosi, G., and Winter, S. 1994. Understanding corporate coherence: Theory and evidence. Journal of Economic Behavior & Organization 23:1–30.
- Tolstoy, L. [1910] 1997. A calendar of wisdom: Daily thoughts to nourish the soul. Edited by P. Sekirin. New York: Charles Scribner.
- Trajtenberg, M. 1990. A penny for your quotes: Patent citations and the value of innovations. RAND Journal of Economics 21:172–87.
- Verspagen, B. 2007. Mapping technological trajectories as patent citation networks: A study on the history of fuel cell research. Advances in Complex Systems 10:93–115.