
abstract
This article investigates the role of key enabling technologies (KETs) in regional branching. Taking into account the general purpose properties of these technologies, and referring to recombinant innovation theories, we argue that KETs knowledge could attenuate the effect that regional branching ascribes to technological relatedness, giving regions more scope for their technological diversification strategies. Furthermore, we claim that regions could benefit from this KETs effect, even if they are followers in their development, thanks to interregional spillovers from closer KETs leaders. Combining regional patent and economic data from a thirty-year panel (1980–2010) of twenty-six European countries, we actually find that KETs negatively moderate the role of technological relatedness for regional specialization in new technological fields, captured by a revealed technology advantage index. KETs knowledge also increases the number of new technological specializations. This positive effect more than compensates the previous negative moderation effect, so that the net impact of KETs on regional branching is positive. Supportive evidence is also found for KETs cross-regional spillovers. Overall, the results provide scientific support for the recent European Commission recommendation to plug KETs into the policy toolbox for smart specialization strategies inspired by regional branching.
This article deals with the dynamics of regional branching, according to which new industries and technologies emerge more easily in regions when they are related to preexisting ones (Frenken and Boschma Citation2007; Boschma and Frenken Citation2011a). Since this thesis entered the economic geography debate with its recent evolutionary turn (Boschma and Frenken Citation2006; Boschma and Martin Citation2007), it has rapidly gained attention and stimulated intensive work at the theoretical and the empirical level. In both respects, important advances have been achieved, and the thesis has found supportive evidence in different geographic contexts (e.g., Neffke, Henning, and Boschma Citation2011; Boschma, Minondo, and Navarro Citation2013).
These results have contributed to making regional branching the scientific background of the latest wave of European regional policies based on the concept of smart specialization strategies (S3) (Boschma Citation2014; Boschma and Giannelle Citation2014). These are bottom-up processes of entrepreneurial discovery of what a region is best at doing in terms of research and development (R&D) and innovation by applying them to its existing specialization patterns (Foray, David, and Hall Citation2009). In addition to regional branching, the concept of smart specialization is based on another important element, but on which research has instead lagged behind: the role of general-purpose technologies (GPTs). Originally devised as part of the “logical framework […] of Smart Specialisation” (ibid., 3), GPTs were deemed able to foster S3 through the co-invention of new applications for existing technologies related to them. Since then, the role of GPTs has always remained in the background. Only recently has it reemerged more explicitly, thanks to the European Commission’s (EC’s) recommendations to build regional strategies of smart specialization (e.g,. in regional operational plans) on the so-called key enabling technologies (KETs) (Sörvik, Rakhmatullin, and Palazuelos Martínez Citation2014): six GPTs aimed at “ensuring the competitiveness of European industries in the knowledge economy” (EC Citation2014, 31; see also EC Citation2009, Citation2012a, Citation2012b, Citation2012c, Citation2013a).
This awakening of policy attention to GPTs with respect to regional diversification has been mainly factual, and it has occurred in the absence of a clear theoretical foundation. In particular, the way in which KETs could relate to regional branching, as the other ingredient of smart specialization, has been left unexplored. This, for us, is doubly unfortunate. First, this analysis could enhance our understanding of the technological mechanisms that drive regional branching. Second, it could help European regions to find a more precise space for KETs in their policy toolbox for S3.
The present article aims at filling this gap by investigating the role that KETs can perform in regional branching.
From a theoretical point of view, we look at the implications of the GPT properties of KETs for the recombinant innovation theories previously placed at the basis of regional branching (Colombelli, Krafft, and Quatraro Citation2014; Castaldi, Frenken, and Los Citation2015). In this regard, we argue that available KETs knowledge could boost regional branching and, above all, attenuate the effect that regional branching ascribes to technological relatedness, giving regions more scope for technological diversification. From a methodological point of view, we test this argument by extending an econometric model previously developed to investigate the effect exerted on new regional specializations by their relatedness to preexisting ones in the technological space (Hidalgo et al. Citation2007). In particular, we extend this methodology in three respects. First, we focus on regional branching at the extensive margin, by looking at the region’s capacity to acquire a set of related (to previous ones) new technologies, with respect to that at the intensive margin, which is generally considered by the literature in regard to specific individual technologies. Second, we plug KETs knowledge, proxied by regional patents in coherent technological classes, among the regressors of this model, and allow KETs to play a moderating role on the effect of technological relatedness. Third, we integrate the standard estimations of the model with a spatial econometric robustness check (Quatraro Citation2010; Essletzbichler Citation2015), which allows KETs to spread their effects across closer regions. This is a crucial aspect in light of the smart specialization logic of considering the presence of core and peripheral regions also in the development of KETs.
Crossing regional patent and economic data, the model is applied to a large sample of regions, belonging to twenty-six European countries observed over thirty years (1980–2010). KETs are found to negatively moderate the role of technological relatedness for regional specialization in new technological fields. KETs knowledge also increases the number of new technological specializations, to an extent that more than compensates the previous negative moderation, so that the net effect of KETs on regional branching is positive. Overall, evidence emerges that KETs could enable regions to explore away from the existing technological base and to specialize more distantly from what they know: a result quite in line with the S3. Furthermore, the evidence on interregional spillovers suggests that KETs could be beneficial also to follower regions in their development, provided that they are geographically closer to leader regions: another smart specialization–friendly insight that does not force regions to invent themselves as KETs developers from scratch.
The rest of the article is organized as follows. The next section illustrates the theoretical background of the article. This is followed by a section that presents the empirical application, the data, and the econometric strategy through which it was performed, referring to the appendixes for their details. The penultimate section discusses the main results. The final section concludes and illustrates the policy implications.
Theoretical and Policy Background
The logic of regional branching and its relevance to economic geography is quite straightforward (Tanner Citation2014). The preexisting industry structure is a crucial determinant of the development path that a region embraces and the economic growth from which it can benefit (Boschma and Frenken Citation2011a, Citation2011b). In particular, the emergence of new industries in a region can be facilitated by the presence of industries that are technologically related to them (Neffke, Henning, and Boschma Citation2011; Essletzbichler Citation2015).Footnote1
Several cases of regional branching have been documented in different geographic contexts, especially in technological terms, by looking at the role of related (and unrelated) variety in the dynamics of scientific knowledge and technological innovations in local areas (Kogler, Rigby, and Tucker Citation2013; Boschma, Heimeriks, and Balland Citation2014; Colombelli, Krafft, and Quatraro Citation2014; Tanner Citation2014; Backman and Lööf Citation2015; Boschma, Balland, and Kogler Citation2015; Castaldi, Frenken, and Los Citation2015; Rigby Citation2015).Footnote2 The reference to journal articles and patent data, in fact, makes this kind of branching easier to map in empirical terms. On the other hand, the theoretical mechanisms of this kind of regional branching have not yet received much attention. In particular, the role that GPTs, like KETs, can play in the same respect has been unfortunately neglected. Its recovery represents the main novelty of our article.
As Castaldi, Frenken, and Los (Citation2015) duly point out, the way in which relatedness spurs regional technological branching can be explained by referring to Schumpeter’s seminal insight of newly recombining existing ideas (Becker, Knudsen, and Swedberg Citation2012). In these terms, the notion of recombinant innovation defined by Weitzman (Citation1998) and its regional declination appears crucial for the theoretical foundation of regional branching (Quatraro Citation2010; Castaldi, Frenken, and Los Citation2015). On the one hand, the local variety of regions in terms of industries affects the diversity of their knowledge base and favors, per se, a cross-fertilization of ideas that generates Jacobsian spillovers (Jacobs Citation1969) and recombinant innovations in their boundaries. On the other hand, the relatedness degree of these heterogeneous activities, expressed by the commonalities in the knowledge base that different industries can share, makes it easier to innovate by recombining ideas and technologies at the regional level.
An apparently missing piece in this story is the role that GPTs, like our focal KETs, can play in the unfolding of recombinant regional innovations.
As well known, the “rare properties” (Foray Citation2009, 21) of these technologies are their horizontal application throughout the knowledge base of a national/regional economy (e.g., the widespread industrial use of nanotechnologies) and the complementarity between inventions and applications in their development (e.g., the application of a newly invented biotechnology to a new maritime resources exploitation) (Bresnahan Citation2010). These two properties attribute to GPTs an important, though hitherto unrecognized, function in the technological transition that recombinant innovations drive at the regional level through branching processes (van den Bergh Citation2008; Frenken, Izquierdo, and Zeppini Citation2012). First, by moving the general technological frontier of the region ahead, GPT inventions may attenuate the limits that its ruling technological paradigm previously imposed on the combinatory process of existing ideas (Olsson and Frey Citation2002). KETs’ knowledge could in fact provide an extra buffer of ideas recombination at the local level. In so doing, KETs could increase regional branching at the extensive margin, so to speak, by augmenting the number of new technologies that the region is able to master by exploiting their relatedness to the existing ones. A similar role for KETs could be expected also with respect to the region’s capacity to acquire a certain new technology rather than another one by referring to regional branching at the intensive margin, as the extant literature, in fact, does. However, given the horizontal propagation of GPTs, we maintain that the highest KETs potential should be sought at the extensive margin.Footnote3
The second distinguishing property of GPTs entails an additional role for KETs in regional branching. As we said, the development of GPTs is marked by a typical co-invention/application pattern through which the extant applicative path can be linked to a new inventive path, yielding recombinations that the simple branching of the former would not have made possible. These are innovations of a really recombinant nature, rather than softer branching innovations occurring when the recombination takes place along a certain (and related) technological path (Frenken, Izquierdo, and Zeppini Citation2012).Footnote4 At the regional level, this argument leads us to expect that the local availability of KETs’ knowledge makes the role of technological relatedness less binding for regional branching.Footnote5 Not only do KETs provide regions with an extra buffer of recombining existing ideas, but they also allow regions to obtain new recombinations that are less technologically closer to the extant ones.
This last argument is consistent with the recently proposed idea of application relatedness (Tanner Citation2014).Footnote6 However, in our view, it is the invention, along with the application, of GPTs, rather than of any other technologies in use, to determine this kind of relatedness, above all in light of their rare horizontal nature. Furthermore, we maintain that this argument holds true well beyond the strategic decision of firms to diversify and applies to all the regional stakeholders following the idea of smart specialization.
The policy implications of the previous arguments for the undertaking of S3 are immediate. These strategies are meant to foster entrepreneurs’ ability to discover new learning opportunities for the region by drawing on previously accumulated knowledge (McCann and Ortega-Argilés (Citation2015): in short, by regional branching (Boschma and Giannelle Citation2014). Furthermore, the EC expects S3 to spur entrepreneurial processes that prioritize KETs, given their contribution to the general spectrum of regional technological activities and given their horizontal nature (Sörvik, Rakhmatullin, and Palazuelos Martínez Citation2014; Foray Citation2015; Pattinson et al. Citation2015).
The six KETs identified by the EC—industrial biotechnology, nanotechnology, micro- and nanoelectronics, photonics, advanced materials, and advanced manufacturing technologies—represent a new generation of GPTs acting as building blocks for a wide array of products and industrial processes in today’s economies. Of course, although sharing the GPT properties that we have identified, the six technologies are inherently diverse, for example, in terms of stage of their life cycle and industries/countries of main diffusion. However, we do not have grounds to assume that these heterogeneous characteristics would entail differences in our reinterpretation of regional branching. Accordingly, we leave it to the empirical application to reveal if this is actually the case and postpone the issue to our future research. For the time being, the GPT nature of these KETs and our research questions about the KETs’ functions for regional branching could be useful to address important policy issues such as the following: Do KETs increase the regional capacity for smart specialization? Do KETs enable regions to specialize more distantly from what they know?
In addressing these questions, we should consider that, as Foray, David, and Hall (Citation2009) point out, regions differ in their capacity to develop GPTs. In the original formulation of the concept, this fact was not deemed problematic. Provided that "leader," “follower,” and “laggard” regions differently modulate the balance between their inventions and application potential, all of them can benefit from GPTs (Foray Citation2009, 21). To this argument we add that a focal region does not branch its activities in isolation from other regions. As has been widely shown by the literature on interregional spillovers (e.g., Maurseth and Verspagen Citation2002; Bottazzi and Peri Citation2003; Kalapouti and Varsakelis Citation2015), spatial proximity allows knowledge to flow from one region to another in different ways (e.g., through technology transfer, research collaboration, and labor mobility). Cross-regional spillovers may concern, above all, KETs, especially if we consider the explicit nature of their knowledge base. Accordingly, we can expect that the benefits that KETs have for regional branching could be gained even by regions that lag behind in their development—typically, peripheral regions—provided that they are closer to leader regions in the same respect—typically, core regions. On this basis, given that the prioritization of KETs does not necessarily require from-scratch investments, and that it can be conversely activated also by combining interregional knowledge flows with their absorptive capacity, it could be feasible also for KETs’ lagging regions and fully consistent with the smart specialization idea.
Empirical Application
Data
The empirical application of the article is based on a regional data set of twenty-six EU countries (the EU 28, minus Greece and Croatia) over the period 1981 to 2010: an ideal sample for investigation, given the policy importance of smart specialization in the EU2020 strategy.
The data set was obtained by merging regional patent data at the NUTS2 level, drawn from the Organization for Economic Cooperation and Development (OECD) Reg Pat data set (July 2014), with those of the European Regional Database maintained by Cambridge EconometricsFootnote7 at the same territorial level of analysis.
Following the extant literature, patent data were first of all used to proxy the region’s capacity to branch into new technologies by looking at its technological specializations (see “Variables”). Using a “technology diffusion approach” (EC 2011, 21), patent data were also used to identify the presence of KETs’ knowledge in the regions and investigate their role in regional branching. In particular, we looked at the number of regional patent applications in KETs-mapped International Patent Classification (IPC) classes, using the latest version of the conversion table put forward by the EC Feasibility Study on KETs (see Vezzani et al. Citation2014). Finally, patent data were also used to measure the technological relatedness between the new and the existing technologies, and other technological determinants of regional branching (see “Variables”).
The European Regional Database was the reference to proxy for other economic determinants of regional branching and to obtain some regional controls necessary for its analysis. Because they are absent from this database, data on regional R&D were taken from EUROSTAT regional statistics. However, given the much lower number of observations with respect to Cambridge statistics, rather than opting for a further merge of data sets, data on R&D were drawn separately from EUROSTAT and used only limitedly in some specifications of the empirical analysis.
Variables
Consistent with the literature on the emergence of new activities in regional contexts (see, e.g., Boschma, Minondo, and Navarro Citation2013; Colombelli, Krafft, and Quatraro Citation2014), our focal dependent variable was built by looking at region i’s acquisition of a new technological specialization s at time t: that is, a technological specialization that the region did not have at time t–k. If we identify a generic technological specialization with a standard patent-based indicator of revealed technological advantages, RTAist, its newness can be characterized by a dichotomic variable, New_RTAist, taking value 1 if such an advantage is new and 0 otherwise (see Appendix A.1). New_RTAist is thus linked to the emergence of a revealed technological advantage, but it should be interpreted differently from RTAist. In particular, a nil value for it may denote both the absence of specialization in technology s, as for RTAist, and a technological specialization in s that the region keeps from the previous period: although different, both the situations fall outside the realm of regional branching.
The extant literature has generally focused on this technology-region level of analysis, by looking at New_RTAist and addressing the role of technology s’s relatedness to the preexisting ones of the region i in its unfolding. As we said in “Theoretical and Policy Background,” our focus on KETs makes it more important to look at the extension of new technological specializations that the region acquires in a related manner. Accordingly, we instead based our analysis on an aggregate variable, New_RTAit, which simply counts the number of new technological specializations of region i at time t. More precisely, since our focus was on the role of KETs in the dynamics of new technological activities, in order to mitigate the risk of spurious relationships between the dependent variable and the KETs’ focal regressors, New_RTAit was calculated for each of the new regional technologies except those classified as KETs, in moving from t–k to t (Appendix A.1).Footnote8 For the sake of comparison with the extant literature, however, the results of the estimations carried out at the region-technology level are also reported as a robustness check (Appendix A.3).
In order to account for a regional branching process, the dynamics of New_RTAit were first regressed against the technological space that local agents had managed to command in the past, that is, by the lagged value of the dependent variable, New_RTAit-k. In the literature (e.g., Boschma, Minondo, and Navarro Citation2013; Colombelli, Krafft, and Quatraro Citation2014), this first regressor has been retained to account for the path dependency of technological specialization at the regional level, at which different patterns of hysteresis can emerge, like the typical success breeds success one. In spite of the complexity that it introduces into the econometric strategy (see “Econometric Strategy”), its inclusion is thus essential in order to distinguish the extent to which the acquisition of new technologies is the result of a relatedness rather than experience driven kind of branching.
The core regressor of our regional branching analysis was represented by the relatedness of the newly acquired technologies, as measured by New_RTAis, to the existing ones of the region. Drawing on the manifold notion of proximity in economic geography (Boschma Citation2005), and on the idea of technological/cognitive proximity in particular, substantial research efforts have been made to find a relatedness measurement suited to this purpose (e.g., Kogler, Rigby, and Tucker Citation2013; Colombelli, Krafft, and Quatraro Citation2014; Essletzbichler Citation2015; Rigby Citation2015). Among the available alternatives, we referred to Hidalgo et al. (Citation2007) and adapted their representation of the product space of a country to the technology space of a region. In particular, we first looked at regional patent applications in technological fields pairwise. This was made in order to identify concurrent patenting that could reveal a proximity linkage between each new regional technology s at time t and each and every one of those technologies (out of the remaining m ≠ s) in which it was specialized at time t–k. All of the individual proximity linkages to technology s were then grouped together through a density indicator for the same technology, and an average density was finally calculated with respect to all the new technologies of region i. The resulting variable, Av_Densit, was our proxy for the technological relatedness between the set of new and existing technologies of the region, and indeed the one on which we focus to ascertain the occurrence of regional branching at the extensive margin (see Appendix A.1 for details). As we said, a regional branching process would be suggested by a positive correlation between Av_Densit and our dependent variable, pointing to the accumulation of technological competences in close or complementary technologies for the development of new ones.
The list of independent variables of our regional branching approach is completed by the inclusion of a number of regional controls. First of all, we controlled for the technological drivers of new regional specializations with two variables: the (lagged log of the) R&D intensity of the focal region, R&Dit-k, defined as the ratio between its R&D expenditure and its gross value added; and the number of IPC codes in which a region had registered patent applications, CountIPCit-k. In spite of the regional pervasiveness of their role, mainly due to their direct—through innovation and internal knowledge—and indirect—through imitation and external knowledge sourcing—effects on regional growth (Grillitsch, Tödtling, and Höglinger Citation2015; Vogel Citation2015), these are typical variables of regions following a so-called science–technology–innovation (STI) mode (see Jensen et al. Citation2007). However, data availability prevented us from considering other controls, which could also have accounted for an alternative and possibly more widespread doing–interacting–using (DUI) mode of innovating among regions, based on more informal technological drivers. Given the dramatic loss of observations entailed by the use of R&D with the data at hand (see ), in our benchmark estimations (see "Econometric Strategy") we mainly used CountIPC and referred to both only for the sake of a robustness check. Indeed, their simultaneous inclusion could be motivated by the fact that, although they are both size-related variables, they are different in nature because CountIPCit-k also accounts for the degrees of freedom that the region has available in exploring new technological advantages over time.
Table 1 Variables Definition
Table 2 Descriptive Statistics
As for the other controls, we included in the estimated model the (lagged logarithm of) regional gross value added, GVAit-k, and the (lagged logarithm of) regional employment, Employmentit-k.
In order to plug KETs into the model and test our arguments about their role in regional branching, we referred again to the notion of RTA (see Appendix A.1) and first counted the number of cases in which region i had obtained a technological specialization in a KETs-related IPC class, irrespective of the specific KETs in which this had occurred. KETs_RTAit-k was thus a proxy for the generic KETs knowledge that the region is able to master. The same indicator was then replicated by referring to the number of IPC classes pertaining to each of the six KETs separately considered. As we said, this could help us detect possible heterogeneity among KETs in their regional branching role (Appendix A.1). In both cases, the KETs variable was considered in additive terms and as a moderating variable of that proxying for the role of technological relatedness, that is Av_Densit (see “Econometric Strategy”).
summarizes the variables used in the study, how they were defined, and the data sources upon which they build. As illustrated in Appendix A.1, a value of k = 1 has been adopted for the lag in the estimations, requiring a transformation of some variables (the RTA based) to account for their volatility and will be referred to hereafter.
In order to avoid problems of multicollinearity, following a common econometric practice, each variable was first centered around its mean. Hence, both the centered indexes and their interactions were included in the econometric specifications of our model (see “Econometric Strategy”). reports the main descriptive statistics of these variables, although shows the pairwise correlations among all of them. As can be observed, although some correlations are significant, the variance inflation factor (VIF) tests reported for each model in and excluded problems of collinearity in all of the cases.Footnote9
Table 3 Correlation Matrix
Table 4 Spatial Autocorrelation Statistics
Table 5 Acquisition of New Revealed Technological Advantages (New_RTAit) and Regional Specialization in KETs (KETs_RTAit-1)—GMM System Estimator
Table 6 Net Impact of KETs_RTAit-1 on New_RTAit: Overall and by KETs Type
Table 7 Acquisition of New Revealed Technological Advantages (New_RTAit) and Regional Specialization in Different KETs (KETsj_RTAit-1)—GMM System Estimator
Econometric Strategy
The model that we used to test our research arguments is implicitly defined as follows:
where, besides the above-defined variables, z is the vector of our structural regional controls; dtime and dregion are year and regional dummies, respectively; and ε is an error term with standard properties.
In addition to the role of KETs_RTAit in affecting the scope for regional branching (New_RTAit), the focal feature of this model is the presence of an interaction term between KETs themselves and the technological relatedness of the new technologies to the preexisting ones, Av_Densit. Indeed, consistently with our theoretical arguments in “Theoretical and Policy Background,” our expectation is that not only do KETs positively affect New_RTAit, but they also negatively moderate the positive effect that, according to the branching hypothesis, Av_Densit should have on New_RTAit.Footnote10
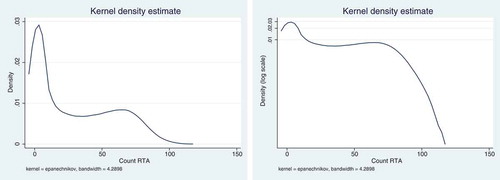
The nature of the dependent variable, New_RTAit, which is a count one with a nonnormal distribution (see ), would require the implementation of count-data models in a panel setting to estimate the model.
Figure 1. Kernel density distribution of New_RTAit.
Deviance goodness-of-fit = 29388.91, Prob > chi2(5921) = 0.0000.
Pearson goodness-of-fit = 27248.95, Prob > chi2(5921) = 0.0000.
However, we should also consider that the model regresses the dependent variable at time t against its lagged value. This introduces an intrinsic element of dynamics, which calls for an econometric strategy able to minimize the possible bias in the estimations, such as a generalized method of moments (GMM) model. Accordingly, we used this model by making some changes to our own dependent variable that could prevent problematic issues in its application to count data (see Appendix A.2).
A further requirement of the econometric strategy to estimate our focal model derived from the fact that the construction of regional technological advantages on which it focused may be affected by the KETs efforts of geographically closer regions. In particular, the technological effects that KETs can exert in the regional knowledge base (see “Theoretical and Policy Background”) may extend beyond a region’s geographic boundaries and make the KETs knowledge/specialization of that region significant for the development of new technological specializations in neighboring ones.
As well known, in regard to possible spatial dependence phenomena of this kind, traditional econometric models may yield biased results. Spatial econometrics should be preferred as more reliable.
In this respect, suggests that the phenomenon concerned could actually have an important spatial specification across the regions of our sample.
Figure 2. Spatial distribution of NEW_RTA and RTA_KET (average values 1996–2001).
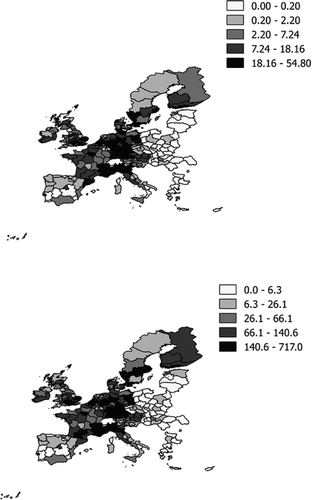
The spatial distribution of the average values of New_RTAit in 2006 (upper part of the map) provides evidence of a marked geographic concentration of that variable whereby Central EU regions appear to be characterized by higher values, although the emergence of new technological specialization in peripheral regions seems to be a much weaker phenomenon. The distribution of the count of KETs in which the region developed a technological specialization in 2006 (lower part of the map) also suggests that its highest values are concentrated in Central EU regions. Overall, there seem to be traces of an idiosyncratic geographic distribution of the phenomenon, which somehow mimics that of other more standard economic indicators. This suggests its apparent neutrality with respect to the need to favor regional convergence across Europe: an issue that we postpone to our future research agenda.
The insights of this visual inspection are confirmed by the results of the tests for spatial autocorrelation. Using the robust Lagrangian multiplier (LM) tests for error and lag forms of spatial dependence for panel data (Elhorst Citation2014a), suggests a preference for the lag model. This implies that autocorrelation actually stems from the economic interdependence of the creation of new technological specializations across neighboring regions.
On the basis of the previous evidence, in a robustness check (see “Robustness Checks: A Closer Look at Spatial Aspects”), we integrated the standard estimates of our model with those obtained by running a spatial model suitable for our research question. This should be one able to appreciate both the effects of the spatially lagged dependent variable, New_RTA, and of a spatially lagged regressor, KETs_RTA, like a spatial Durbin model (SDM) (see Appendix A.2). Also in this case, the application of the estimator to panel data required some transformations in the dependent variable so as to solve the problems due to its nonnegative and discrete nature (see Appendix A.2).
Results
Let us now consider the results of the estimates, starting with those on the role of KETs in aggregate terms. reports different estimations of that role in its nine columns by using different combinations of the relevant regional controls (see “Variables”). Before discussing the results, it is worth stressing again that the VIF tests across the different models—reported at the bottom of the relevant table—suggested that we can exclude that multicollinearity as an issue in our empirical strategy. All of the variables actually showed VIF values below ten, which is the critical value generally used in the literature.
First, as expected, previous gains of new technological advantages (New_RTAit-1) contribute positively to further gains of them in the following period. Having entered new technological fields in the past, regions develop the capacity to do so persistently, confirming the evidence of hysteresis already found by some previous studies (e.g., Boschma, Minondo, and Navarro Citation2013; Colombelli, Krafft, and Quatraro Citation2014). However, it should be noted that, although statistically different from zero, the relative coefficient is lower than one. This implies a dynamic process in which the opportunities to develop new technological specializations are likely to become exhausted in the long run, preventing an implausible exponential growth of them over time.
Although it is linked to the region’s experience, the construction of new RTA also shows the distinguishing feature of a regional branching process. Consistent with the extant literature, our relatedness variable (Av_Densit) has a significant and positive coefficient. Not only does related variety help regions in diversifying their technological base at the intensive margin (Frenken, Van Oort, and Verburg Citation2007)—a result that our robustness checks confirm (Appendix A.3)—but it also increases their capacity to branch at the extensive margin by augmenting the set of newly acquired technologies.
Turning to the control variables, CountIPCit-1 shows a positive and significant coefficient. When, at the price of an important loss of observations, a more standard proxy for innovation efforts at the regional level is also included, R&Dit-1 also proves to be significant and positive in the specifications from columns (4) to (9). These results suggest that, consistent with expectations, more innovation-intensive regions are likely to develop technological competencies in new fields with respect to their existing knowledge base: a result that seems to suggest a STI mode of innovating across the sampled regions, which however needs to be confirmed by using also DUI-related variables in future research. Finally, in spite of the negative sign of Employmentt-1, in two of the nine specifications, when the economic dimension of the regions is considered through their GVAt-1, this shows positive and significant coefficients, pointing to a technological branching advantage of both larger and richer regions. Along with that obtained with respect to R&D, these results are extremely important. At first sight, they seem to suggest that the more peripheral regions, which have also been found to rely on less informal and non-R&D based modes of innovating, could be disfavored in a process of technological diversification from which they should instead benefit the most. In order to be more solidly confirmed, this insight would require us to consider the degree of entrepreneurial development of the regions at stake, about which longitudinal data consistent with our application are unfortunately still missing. However, some confirmative evidence is found when, in columns (7) to (9) of , we plug among the regressors the Regional Entrepreneurship and Develoment Index (REDI): a synthetic indicator released by the EC to rank European regions in terms of entrepreneurial attitudes, abilities, and aspirations with respect to the temporal window 2007–2011.Footnote11 Although time invariant, this index actually allows us to control for the effect of different entrepreneurial dimensions on the emergence of new technological specializations. Consistent with the evidence of the baseline specifications in columns (1) to (8), the coefficient of the variable is positive and significant, suggesting that the entry in new technological fields is actually more probable in more entrepreneurially developed regions.
In light of all of the previous results, the role that KETs can play in different regions, above all through spillover mechanisms between leader and follower regions, becomes of absolute importance: an aspect to which we will return in “Robustness Checks: A Closer Look at Spatial Aspects.”
As regards our focal KETs regressors, a first finding is that the availability of generic KETs knowledge in the region increases its capacity to acquire new technological specializations: KETs_RTAit-1 is significant and positive across all the models. In line with our expectations, the horizontal GPT nature of these technologies provides regions with an extra buffer of recombining existing ideas into new ones. With the help of KETs, the capacity of regions to benefit from recombinant innovations increases by their being provided with a margin of branching into new technologies additional to that guaranteed by their experience and technological relatedness.
Again in line with our expectations, KETs_RTAit-1 performs a significant moderating role of the impact of Av_Densit on New_RTAit, and the sign of the interaction is negative. In other words, KETs make the role of technological relatedness less important for the acquisition of new technological advances and implicitly enable regions to access technologies that are relatively less close to the existing ones. This is consistent with our argument concerning the capacity of KETs to enable regions to implement really recombinant, rather than simply branching, innovations, given their co-invention/application pattern through which the extant applicative path can be linked to a new inventive path.
Although both of the previous results are confirmative of our theoretical arguments, from an empirical point of view, their combined reading may still yield a counteractive result. Because KETs_RTAit-1 is significantly positive, but its interaction with Av_Densit-1 is significantly negative, a basic question arises: do KETs exert a positive net effect on the region’s capacity to develop new technological specializations?
In this regard, it can be useful to evaluate the marginal effects at means of the variables in the model. Indeed, having transformed all variables using an inverse sine operation, which is equivalent to a log transformation (see Appendix A.2), the coefficients of can be read as elasticities and informing us about the extent to which the differential value of the dependent variable changes for any one unit change in the predictor variable, all other things being equal. Accordingly, the net impact of KETs can be directly calculated.
The first row of provides the results of the calculation, along with a z-test indicating if the overall effect is statistically different from zero.
The net impact of KETs on regional branching, obtained by considering both the buffer effect that they offer in terms of variety and the dampening effect that they exert on the impact of technological relatedness, appears to be positive and significant. An increase of 1 percent in the specialization that regions acquire in KETs enables them a more than proportional increase (roughly of 1.23 percent) in the number of new technological specializations they manage to gain. This is of course a reassuring result, which makes KETs an actual and unambiguous enabler of the region’s capacity to enter into new technological domains.
The second battery of results concerns the estimates of the same model as above but with separate consideration of the regional specialization in each and every of the six technologies j (with j = BIOTECH, NANOTECH, NANOELECT, PHOTO, ADVMAT, and ADVTECH).Footnote12 Given the robustness of the aggregated results to the inclusion of R&D, in order to keep a satisfactory number of observations, we will limit this part of the analysis to the benchmark specifications of , by including CountIPCit-1 and excluding the regional R&D intensity from the regressors.Footnote13
As shows, the basic mechanisms underlying the construction of new RTA are confirmed when each of the six KETs is individually considered. For each and every one of them, a regional specialization positively affects regional branching at the extensive margin and negatively moderates the positive impact that, following the branching argument, the technological relatedness to the existing technologies has on the acquisition of new ones.
This is an interesting confirmation of our theoretical arguments. Furthermore, it can also be seen as a reassuring result on the functional boundaries of the KETs club identified by the EC. Whether these same features are not shown by other non-KETs technologies, thus representing an actual boundary with respect to the former is instead an open issue, which we postpone to our future research agenda.
To conclude, similar to what we have done for RTA_KETs, we can evaluate the net contribution of each KET to the creation of new technological specializations. Rows (2) to (7) of provide the results of the calculations using the margins at means. First of all, one observes that an enabling role (additive and moderating) in developing new technological advantages, which we already singled out with our model in aggregate terms, also applies to all of the six subclasses of KETs. However, the net effect of the significant KETs is quite heterogeneous: ADVMAT shows the highest effect (2.9 percent), followed by NANOELECT (2.1 percent). At a smaller order of magnitude (around 1.8 percent) we find BIOTECH and NANOTECH, and further behind (around 0.8 percent) PHOTO and ADVTECH. The possibility that these six KETs exert different degrees of enabling power on regional branching and smart specialization is by now a simple suggestion, which requires further scrutiny of their knowledge bases and applications in future research.
Robustness Checks: A Closer Look at Spatial Aspects
The evidence discussed so far provides sound support for the role of KETs in enabling the emergence of new technological specializations in regional contexts, although some important differences are apparent among the specific subclasses of these technologies. In this section we present a further battery of additional estimations conducted to check whether our previous results were robust to a more explicit consideration of spatial aspects. As we said, although nonspatially related, an additional robustness check is involved by the implementation of our previous estimations at the technology-region level, for the sake of comparison with the extant literature (Boschma, Minondo, and Navarro Citation2013; Colombelli, Krafft, and Quatraro Citation2014). The results are reported in Appendix A.3 (Table A3.1) and are consistent both with the other estimates provided in this article and with the extant literature.
Returning to the spatial aspects of the analysis, a first robustness check concerned the sensitivity of our estimates to the distinction between core and peripheral regions (Foray, David, and Hall Citation2009). In fact, this is important in order better to appreciate the apparent disadvantage that our main estimates seem to attribute to the latter in the capacity of regional branching (see “Empirical Application”). Given the importance that the literature has granted to entrepreneurship for the policy implications of regional branching, as we said in regard to smart specialization (see Foray Citation2015), we tried to distinguish core from peripheral regions by looking at data about their relative competitiveness that also include aspects in the entrepreneurial realm. In particular, we referred to the EC Regional Competitiveness Index (RCI) at the regional level and, given its reference to entrepreneurial-related aspects (e.g., technological readiness, business sophistication, and innovation), we focused on the 2013 innovation subindex (released in 2014). On its basis, we split our regional sample into more (RCI = 1) and less (RCI = 0) competitive regions, depending on the normalization of RCI to be larger or smaller than zero, respectively (the RCI provides the deviation of each European region from the EU28 average). The results of the estimates of our model for the two samples are reported in (as in , columns from (2) to (4) include different sets of size control variables).
Table 8 Acquisition of New Revealed Technological Advantages (New_RTAit) and Regional Specialization in KETs (KETs_RTAit-1)—GMM System Estimator. Leader vs. Follower Regions (2013)
The results are quite stable across the different models, with some apparently counterintuitive ones that require clarification. In particular, peripheral regions show a higher effect of CountIPC than core ones, possibly in the light of their higher share of still unexplored technologies. Related to that is the higher effect that gross value added (GVA) also shows in peripheral regions than in core ones, pointing to a possible convergence advantage of the former in gaining new technologies. Finally, the larger effect of R&D in peripheral than core regions could suggest that, in acquiring new technologies, developing a regional absorptive capacity through R&D to acquire external knowledge—as typically occurs in the former—could be more effective than investing internally for that to happen—as in the case of the latter.
Focusing on our focal regressors, let us notice that Av_Densit and KETs_RTAit-1 still yield positive and significant coefficients, although the interaction between the two shows a negative and significant coefficient in both the cases.Footnote14 Overall, the mechanisms that we have identified in relation to the regional branching role of KETs appear rather invariant with respect to the competitiveness degree of the regions, at least in rough terms. To be sure, an important difference emerges with respect to the impact of Av_Densit, which appears to be higher for less competitive (peripheral) (RCI = 0) than more competitive (core) regions (RCI = 1), in most of the models. Conversely, the magnitude of the coefficient of KETs_RTAit-1, is instead systematically higher for core (competitive) regions. The evidence would therefore suggest that more competitive regions are somehow less constrained by their past specializations in the search for new technological advantages and at the same time that KETs play a stronger role in these contexts than in less competitive regions. Very speculatively, one might conclude that the learning dynamics that we investigate make innovating agents in highly competitive regions better able to command recombinant capabilities to gain the control of new and previously untried technological domains, drawing upon the enabling features of KETs.
The last set of results refers to the spatial econometric analysis of the relationship between KETs and regional branching ().
Table 9 Acquisition of New Revealed Technological Advantages (New_RTAit) and Regional Specialization in KETs (KETs_RTAit-1)—Spatial Durbin Model
At the outset, let us notice that the results of the two postestimation tests (Test 1 and Test 2; see Appendix A.2) that we have reported at the bottom of , suggest that the SDM is actually the most appropriate choice. The upper part of table shows the point estimates of the SDM, obtained by using a row-normalized inverse distance-weighting matrix, with respect to the latitude and longitude coordinates of the relevant regions. In particular, the odd columns report the estimations including only time-fixed effects, although even ones include both time and region fixed effects.
Focusing on our focal regressors, we observe that Av_Densit appears still characterized by a persistent positive and significant coefficient, although the interaction term Av_Densit*KETs_RTAit-1 still shows a negative and significant coefficient. So far, therefore, the results are consistent with our benchmark estimations.
As for the spatially lagged regressors, they all show positive and significant coefficients in all of the models. This is also in line with expectations. Indeed, because we used an inverse distance weighting matrix, a positive coefficient means that a region’s capacity to enter new technological specializations is favored by the introduction of new technological specializations in neighboring regions. Second, the spatially lagged KETs_RTAit-1 variable exhibits a positive and significant coefficient in most of the models (the result is persistent across even columns), thereby suggesting that the technological relationships, which KETs have the potential to engender, are actually transmitted through interregional spillovers.
Because exclusive reference to coefficients may not be reliable in ascertaining the existence of spatial spillovers (Le Sage and Pace Citation2009), following Elhorst (Citation2014b), in the lower part of , we look at the effects that a change in our explanatory variables in a particular region have on the dependent variable in both that region (direct effect) and on closer regions (indirect effect) as well as on their sum (total effect).
Although the direct effects resemble the results of the point estimates, the indirect effects, which can be more properly understood as cross-regional spillovers, are consistent with expectations and persist across all of the models for all of our variables of interest. In particular, Av_Densit and KETs_RTAit-1 show a positive and significant effect, although the interaction term is characterized by a negative and significant one. The same applies to total effects reported at the end of .
In synthesis, we can conclude that significant geographic spillovers can be detected in the analysis of the emergence of new technological specializations when the role of KETs is considered. In other words, spatial proximity to KETs-specialized regions adds to the role of cognitive proximity to previously acquired technologies in the region as a driver of regional branching: an extremely important result that should be considered among the implications of the article to which we turn in the last section.
Conclusions
The recent identification by the European policy makers of KETs, and their recommendations to plug them into the regional policy toolbox, furnish an interesting opportunity to reconcile, after some time of divergence, the two original driving mechanisms of the smart specialization concept, that is, related diversification, and GPTs. Furthermore, this can be done in a theoretically consistent way by looking at the role of KETs in the growing body of economic geography analysis of regional branching. Last but not least, with the help of spatial econometrics, this analysis can be enriched with inspection of possible cross-regional spillovers in the impact of KETs.
By combining patent and economic data for European regions in a longitudinal setting, in this article we have taken a first step in exploitation of this research opportunity. In particular, we have theoretically identified and empirically tested a number of arguments concerning the characteristics of KETs, which make them crucial in the processes of recombinant innovations at the basis of regional branching phenomena.
The results that we have obtained are quite interesting. Irrespective of their specificities, the six KETs enable European regions to increase their portfolios of new technologies over time, confirming their theoretical role in providing regions with an extra buffer of branching capacity at the extensive margin. All of the six KETs also attenuate the impact that relatedness to preexisting technologies has on the acquisition of new ones, confirming the theoretical arguments about their role in a more exploratory extension of the regional knowledge base. In all the cases, this latter effect, which is a negative one of KETs on new technological specializations, is more than compensated by their positive impact on the region’s recombinant innovation processes. In brief, KETs guarantee regions a higher capacity to master new technological advantages by combining with the role of regional experience and technological relatedness in the same respect. However, their net impact on regional technological specialization is different, pointing to KETs specificities that will have to be addressed in future research. Finally, our spatial econometric analysis suggests that interregional spillovers are in place with respect to KETs and that the branching process of a certain region can be helped by the KETs’ knowledge developed by closer ones.
These results are quite helpful in reinforcing and refining the not yet evident reasons for plugging KETs into the regional policy toolbox for S3. First, our article show that KETs seem to have an extra enabling role with respect to that foreseen by the EC, and precisely in the S3 realm: that of increasing the capacity of regions to branch into a wider set of new technologies by retaining the relatedness to their preexisting ones. Second, KETs also seem to make regional branching less dependent on the role of technological relatedness, providing regions with the opportunity to make it more exploratory and to span the boundaries of the regions’ related variety still consistent with the S3 rationale. Third, cross-regional spillovers in the diffusion of the KETs enable regions to exploit a strategy alternative or possibly complementary to the regional development of KETs for the sake of their technological diversification: that of absorbing their knowledge from the outside through mechanisms like interregional technology transfer and cooperation agreements. Indeed, this could be a way for KETs’ follower regions (typically peripheral) to benefit from closer KETs’ leader (core) ones in pursuing their S3. On the other hand, some preliminary evidence from our study seems to suggest that the mechanisms that we have identified in relation to the regional branching role of KETs appear invariant with respect to the level of entrepreneurial/competitive capacity of regions. This is an insight to whose analysis we will devote our future research, which will have to consider regional heterogeneity more directly than we have done so far. In particular, access to new and alternative data will need to be explored in order to extend the insights that this article has obtained by implicitly focusing on an STI mode at the regional level, to an alternative DUI mode of innovating quite pervasive among European regions (Cooke Citation2013).
Acknowledgments
Preliminary versions of the article have been presented in 2014, 2015, and 2016 in the seminar series of the following institutions: JRC-IPTS, European Commission, Seville; DEAMS Department of Economics, Business, Mathematics and Statistics, University of Trieste; Department of Economics of the University of Trento; Kore Business and Economics, University Kore of Enna; Department of Economics, University of Patras; Department of Economics and Statistics, University of Torino; Department of Economics, University of Roma Tre. The article has also been accepted and presented at the following conferences: November 30, 2016, Spanish National Research Council, Institute of Public Goods and Policies (IPP), Madrid (ES); October 22–24, 2015, 56th Annual Meeting of Italian Economists Society (Società Italiana degli Economisti SIE), University of Naples; September 10–11, 2015,12th European Network on the Economics of the Firm (ENEF) meeting, University of Toulouse; DRUID 2015 Summer Conference, Rome; 2015 Annual Conference of the Regional Studies Association, Piacenza; European Meeting on Applied Evolutionary Economics (EMAEE) 2015 Conference, Maastricht; 2014 Annual Meeting of the Italian Economics Society, Trento.
The authors wish to thank attendees and discussants at these events for insightful comments that contributed to improving the quality of the article. Furthermore, the authors are extremely grateful to the editor and to four anonymous reviewers for their fundamental recommendations and suggestions. The usual disclaimer applies. Francesco Quatraro acknowledges funding from the Collegio Carlo Alberto.
Notes
1 Other mechanisms, which are not addressed in the article, concern the role of technological relatedness in reducing the chances that existing industries disappear from the region in the future and in increasing its technological cohesion over time.
2 The emergence of new regional industries can be also followed in economic terms by considering, for example, the relatedness of sector employment growth (Bishop Citation2012), the evolution of product exports (Boschma, Minondo, and Navarro Citation2013), and the changes in the product portfolio of industry plants (Neffke, Henning, and Boschma Citation2011). On the mechanisms underlying this kind of regional branching, see the recent work by Tanner (Citation2014).
3 To provide an example, the nanotechnology advantages that a region has been able to gain in the production of carbon nanotubes may induce it to acquire a new technological specialization in polymer films or microfibers. Indeed, all of these applications draw on a core of nanotechnology knowledge and on the region’s capacity to extend it to different fields.
4 Castaldi, Frenken, and Los (Citation2015) do not draw this distinction, and instead contrast recombinant innovations in the presence of related rather than unrelated variety, attributing to the latter (the former) a larger weight in radical (incremental) breakthroughs in regions: an issue, however, that falls outside the scope of this article.
5 For example, the combination of (KETs) microelectronics with more traditional home technologies embodied in the region (e.g., wood and plastics assembling technologies) may make the latter less binding on the region’s capacity to obtain new specializations in the field, as in the case of smart domotics.
6 According to Tanner (Citation2014), the “principle of technological relatedness” in regional branching fades away when “firms diversify by incorporating new technologies into their product portfolios” (ibid., 423).
8 We wish to thank an anonymous reviewer for his/her suggestions on refinement of the dependent variable.
9 It is worth noting that CountIPC shows a correlation coefficient with KETs_RTA of about 0.85. Although the VIF tests reassured us, we nonetheless run a battery of estimations excluding the variable CountIPC from the list of regressors. The results are consistent with those shown in and , and are available from the authors upon request. However, because they were more easily interpretable and guaranteed a more pervasive convergence among the different models that we used, we decided to retain CountIPC in discussing our results.
10 As said, the model in question is used in the article to address regional branching at the extensive margin. The analysis at the intensive margin was instead carried out for the sake of a robustness check (as reported in Appendix A.3), by using New_RTAist rather than New_RTAit as dependent variable, and by rescaling the relevant regressors at the region-technology level of analysis.
11 These are the three subindices that the REDI superindex integrates, each of which is made up of several pillars—for example, start-up skills (for attitudes), technology adoption (for abilities), and financing (for aspirations)—in turn consisting of an institutional and an individual variable each—for example, for start-up skills, skill perception, and quality of education, respectively. For details, see EC (Citation2013b).
12 The six strings into brackets refer for the six KETs identified by the EC, that is, respectively, industrial biotechnology, nanotechnology, micro- and nanoelectronics, photonics, advanced materials, and advanced manufacturing technologies.
13 As we said, the mean VIF values reported at the bottom of suggests that multicollinearity is not an issue in this case either.
14 To be sure, two exceptions can be found, that is, the results for less competitive regions in model (1), where Av_Densit is not significant, and the very same result in models (3) and (4) for high competitive regions.
1 Different and longer lag specifications were tried, and the results were fairly consistent.
2 GMM estimators for dynamic count data models are still in their inception phase, and as yet there is no convergence on a standard approach. Cameron and Trivedi (Citation2005, Citation2010), for example, propose a set of possible alternatives to estimate Poisson-like just identified and overidentified models by using the Stata software. However, the relative routine does not allow implementing the test on the moment conditions that are necessary to validate the model. Windmeijer (Citation2002) has developed a routine working with the Gauss software, to run estimates drawing upon Chamberlain and Wooldridge moment conditions, which instead reports the full set of validation tests. However, one main issue is that these estimators are appropriate for dependent variables that are Poisson distributed, which is not our case. For this reason, although we ran also these alternative estimations by using both Stata and Gauss routines, obtaining consistent results for our focal regressor and satisfactory validation tests (available on request), we opted to implement a different modeling strategy, as explained in the main text.
3 The standard estimator that Lambert, Brown, and Florax (Citation2010) propose to deal with this issue is not appropriate in this context for two main reasons. First, it has proved to work well with cross-sectional data only. Second, it is conditional on spatial count models based on a Poisson distribution, although our dependent variable is clearly overdispersed.
References
- Arellano, M., and Bond, S. R. 1991. Some tests of specification for panel data: Monte Carlo evidence and an application to employment equations. Review of Economic Studies 58 (2): 277–97. doi:10.2307/2297968.
- Arellano, M., and Bover, O. 1995. Another look at the instrumental variable estimation of error-components models. Journal of Econometrics 68 (1): 29–51. doi:10.1016/0304-4076(94)01642-D.
- Backman, M., and Lööf, H. 2015. The geography of innovation and entrepreneurship: Introduction to the special issue. Annals of Regional Science 55 (1): 1–6. doi:10.1007/s00168-015-0713-x.
- Becker, M. C., Knudsen, T., and Swedberg, R. 2012. Schumpeter’s theory of economic development: 100 years of development. Journal of Evolutionary Economics 22 (5): 917–33. doi:10.1007/s00191-012-0297-x.
- Belotti, F., Hughes, G., and Piano Mortari, A. 2016. Spatial panel data models using Stata. CEIS Working Paper 373. Rome: University of Rome Tor Vergata.
- Bishop, P. 2012. Knowledge, diversity and entrepreneurship: A spatial analysis of new firm formation in Great Britain. Entrepreneurship & Regional Development 24 (7–8): 641–60. doi:10.1080/08985626.2011.617786.
- Blundell, R. W., and Bond, S. R. 1998. Initial conditions and moment restrictions in dynamic panel data models. Journal of Econometrics 87 (1): 115–43. doi:10.1016/S0304-4076(98)00009-8.
- Bonaccorsi, A., Colombo, M. G., Guerini, M., and Rossi-Lamastra, C. 2013. University specialization and new firm creation across industries. Small Business Economics 41 (4): 837–63. doi:10.1007/s11187-013-9509-5.
- Boschma, R. 2005. Proximity and innovation: A critical assessment. Regional Studies 39 (1): 61–74. doi:10.1080/0034340052000320887.
- Boschma, R.. 2014. Constructing regional advantage and smart specialisation: Comparison of two european policy concepts. Scienze Regionali 13 (1): 51–68. doi:10.3280/SCRE2014-001004.
- Boschma, R., Balland, P., and Kogler, D. F. 2015. Relatedness and technological change in cities: The rise and fall of technological knowledge in US metropolitan areas from 1981 to 2010. Industrial and Corporate Change 24 (1): 223–50. doi:10.1093/icc/dtu012.
- Boschma, R., and Giannelle, C. 2014. Regional branching and smart specialisation policy. S3 Policy Brief Series 06/2014. Seville: European Commission.
- Boschma, R., Heimeriks, G., and Balland, P.-A. P.-A. 2014. Scientific knowledge dynamics and relatedness in biotech cities. Research Policy 43 (1): 107–14. doi:10.1016/j.respol.2013.07.009.
- Boschma, R., Minondo, A., and Navarro, M. 2013. The emergence of new industries at the regional level in Spain: A proximity approach based on product relatedness. Economic Geography 89 (1): 29–51. doi:10.1111/ecge.2013.89.issue-1.
- Boschma, R. A., and Frenken, K. 2006. Why is economic geography not an evolutionary science? Towards an evolutionary economic geography. Journal of Economic Geography 6 (3): 273–302. doi:10.1093/jeg/lbi022.
- Boschma, R. A., and Frenken, K.. 2011a. Technological relatedness and regional branching. In Dynamic geographies of knowledge creation and innovation, ed. H. Bathelt, M. P. Feldman, and D. F. Kogler, 64–81. London: Routledge, Taylor and Francis.
- Boschma, R. A., and Frenken, K.. 2011b. Technological relatedness, related variety and economic geography. In The handbook on regional innovation and growth, ed. P. Cooke, B. Asheim, R. Boschma, R. Martin, D. Schwartz, and F. Todtling, 187–97. Cheltenham, UK: Edward Elgar.
- Boschma, R. A., and Martin, R. 2007. Constructing an evolutionary economic geography. Journal of Economic Geography 7 (5): 537–48. doi:10.1093/jeg/lbm021.
- Bottazzi, L., and Peri, G. 2003. Innovation and spillovers in regions: Evidence from European patent data. European Economic Review 47 (4): 687–710. doi:10.1016/S0014-2921(02)00307-0.
- Bresnahan, T. 2010. General purpose technologies. In Handbook of the economics of innovation, Vol. 2, ed. B. H. Hall, and N. Rosenberg, 761–91. Amsterdam, the Netherlands: Elsevier.
- Burbidge, J. B., Magee, L., and Robb, A. L. 1988. Alternative transformations to handle extreme values of the dependent variable. Journal of the American Statistical Association 83 (401): 123–27. doi:10.1080/01621459.1988.10478575.
- Cameron, A. C., and Trivedi, P. K. 2005. Microeconometrics: Methods and applications. Cambridge: Cambridge University Press.
- Cameron, A. C., and Trivedi, P. K.. 2010. Microeconometrics using Stata. Revised version. College Station, TX: Stata Press.
- Castaldi, C., Frenken, K., and Los, B. 2015. Related variety, unrelated variety and technological breakthroughs: An analysis of US state-level patenting. Regional Studies 49 (5): 767–81. doi:10.1080/00343404.2014.940305.
- Colombelli, A., Krafft, J., and Quatraro, F. 2014. The emergence of new technology-based sectors in European regions: A proximity-based analysis of nanotechnology. Research Policy 43 (10): 1681–96. doi:10.1016/j.respol.2014.07.008.
- Cooke, P. 2013. Towards DUI regional innovation systems. Papers in Evolutionary Economic Geography 13.21. Utrecht, the Netherlands: Utrecht University, Urban and Regional Research Centre.
- Elhorst, J. P. 2014a. Matlab software for spatial panels. International Regional Science Review 37 (3): 389–405. doi:10.1177/0160017612452429.
- Elhorst, J. P.. 2014b. Spatial econometrics. From cross-sectional data to spatial panels. Berlin, Germany: Springer.
- Essletzbichler, J. 2015. Relatedness, industrial branching and technological cohesion in US metropolitan areas. Regional Studies 49 (5): 752–66. doi:10.1080/00343404.2013.806793.
- European Commission. 2009. Preparing for our future: Developing a common strategy for key enabling technologies in the EU. Communication from the Commission to the European Parliament COM (2009)-512. Brussels, Belgium: European Commission.
- European Commission. 2012a. A European strategy for key enabling technologies—A bridge to growth and jobs. Final communication from the commission to the European Parliament, the Council, the European Economic and Social Committee and the Committee of the Regions. COM (2012)-341. Brussels, Belgium: European Commission.
- European Commission. 2012b. Feasibility study for an EU monitoring mechanism on key enabling technologies. Brussels, Belgium: European Commission.
- European Commission. 2012c. A European strategy for key enabling technologies—A bridge to growth and jobs. Communication adopted on June 26, 2012. Brussels, Belgium: European Commission.
- European Commission. 2013a. High-level expert group on key enabling technologies: Status implementation report. Brussels, Belgium: European Commission.
- European Commission. 2013b. REDI: The regional entrepreneurship and development index—Measuring regional entrepreneurship. Final report. Directorate-General for Regional and Urban policy. Brussels, Belgium: European Commission.
- European Commission. 2014. The digital agenda toolbox. Brussels, Belgium: European Commission.
- Foray, D. 2009. Understanding ‘smart specialisation’. In The question of R&D specialisation: Perspectives and policy implications JRC-IPTS, ed. D. Pontikakis, D. Kyriakou, and R. Van Bavel, 14–27. Seville, Spain: European Commission.
- Foray, D.. 2015. Smart specialisation opportunities and challenges for regional innovation policy. New York: Routledge.
- Foray, D., David, P. A., and Hall, B. H. 2009. Smart specialisation—The concept. Knowledge Economists Policy Brief. Brussels, Belgium: European Commission. http://ec.europa.eu/invest-in-research/pdf/download_en/kfg_policy_brief_no9.pdf.
- Frenken, K., and Boschma, R. A. 2007. A theoretical framework for evolutionary economic geography: Industrial dynamics and urban growth as a branching process. Journal of Economic Geography 7 (5): 635–49. doi:10.1093/jeg/lbm018.
- Frenken, K., Izquierdo, L., and Zeppini, P. 2012. Branching innovation, recombinant innovation and endogenous technological transitions. Environmental Innovation and Societal Transitions 4 (4): 25–35. doi:10.1016/j.eist.2012.06.001.
- Frenken, K., Van Oort, F. G., and Verburg, T. 2007. Related variety, unrelated variety and regional economic growth. Regional Studies 41 (5): 685–97. doi:10.1080/00343400601120296.
- Grillitsch, M., Tödtling, F., and Höglinger, C. 2015. Variety in knowledge sourcing, geography and innovation: Evidence from the ICT sector in Austria. Papers in Regional Science 94 (1): 25֪–43.
- Hidalgo, C. A., Klinger, B., Barabasi, A.-L. A.-L., and Hausmann, R. 2007. The product space conditions the development of nations. Science 317 (5837): 482–87. doi:10.1126/science.1144581.
- Jacobs, J. 1969. The economy of cities. New York: Vintage.
- Jensen, M. B., Johnson, B., Lorenz, E., and Lundvall, B. Å. 2007. Forms of knowledge and modes of innovation. Research Policy 36 (5): 680–93. doi:10.1016/j.respol.2007.01.006.
- Kalapouti, K., and Varsakelis, N. C. 2015. Intra and inter: Regional knowledge spillovers in European Union. Journal of Technology Transfer 40 (5): 760–81. doi:10.1007/s10961-014-9356-9.
- Kogler, D. F., Rigby, D. L., and Tucker, I. 2013. Mapping knowledge space and technological relatedness in US cities. European Planning Studies 21 (9): 1374–91. doi:10.1080/09654313.2012.755832.
- Lambert, D. M., Brown, J. P., and Florax, R. J. G. M. R. J. 2010. A two-step estimator for a spatial lag model of counts: Theory, small sample performance and an application. Regional Science and Urban Economics 40 (4): 241–52. doi:10.1016/j.regsciurbeco.2010.04.001.
- Le Sage, J. P., and Pace, R. K. 2009. Introduction to spatial econometrics. Boca Raton, FL: CRC Press.
- Maurseth, P. B., and Verspagen, B. 2002. Knowledge spillovers in Europe: A patent citations analysis. Scandinavian Journal of Economics. 104 (4): 531–45. doi:10.1111/sjoe.2002.104.issue-4.
- McCann, P., and Ortega-Argilés, R. 2015. Smart specialization, regional growth and applications to European Union cohesion policy. Regional Studies 49 (8): 1291–1302. doi:10.1080/00343404.2013.799769.
- Neffke, F., Henning, M., and Boschma, R. 2011. How do regions diversify over time? Industry relatedness and the development of new growth paths in regions. Economic Geography 87 (3): 237–65. doi:10.1111/ecge.2011.87.issue-3.
- Olsson, O., and Frey, B. S. 2002. Entrepreneurship as recombinant growth. Small Business Economics 19 (2): 69–80. doi:10.1023/A:1016261420372.
- Pattinson, M., Messaoudi, A., Avigdor, G., Gauders, N., and Brighton, R. 2015. Analysis of smart specialisation strategies in nanotechnologies, advanced manufacturing and process technologies. Final report, Directorate-General for Research and Innovation, European Commission. http://ec.europa.eu/research/industrial_technologies/pdf/analysis_of_RIS3_in_NMP.pdf.
- Quatraro, F. 2009. The diffusion of regional innovation capabilities: Evidence from Italian patent data. Regional Studies 43 (10): 1333–48. doi:10.1080/00343400802195162.
- Quatraro, F.. 2010. Knowledge coherence, variety and economic growth: Manufacturing evidence from Italian regions. Research Policy 39 (10): 1289–302. doi:10.1016/j.respol.2010.09.005.
- Quatraro, F.. 2016. Co-evolutionary patterns in regional knowledge bases and economic structure: Evidence from European regions. Regional Studies 50 (3): 513–39. doi:10.1080/00343404.2014.927952.
- Rigby, D. 2015. Technological relatedness and knowledge space: Entry and exit of US cities from patent classes. Regional Studies 49 (11): 1922–37. doi:10.1080/00343404.2013.854878.
- Soete, L. 1987. The impact of technological innovation on international trade patterns: The evidence reconsidered. Research Policy 16 (2–4): 101–30. doi:10.1016/0048-7333(87)90026-6.
- Sörvik, J., Rakhmatullin, R., and Palazuelos Martínez, M. 2014. Preliminary report on KETs priorities declared by regions in the context of their work on research and innovation strategies for smart specialisation (RIS3). JRC Technical Report 2013. Seville, Spain: European Commission. http://publications.jrc.ec.europa.eu/repository/bitstream/JRC84659/preliminary%20report%20on%20kets_js.pdf.
- Tanner, A. N. 2014. Regional branching reconsidered: Emergence of the fuel cell industry in European regions. Economic Geography 90 (4): 403–27. doi:10.1111/ecge.2014.90.issue-4.
- van den Bergh, J. 2008. Optimal diversity: Increasing returns versus recombinant innovation. Journal of Economic Behavior & Organization 68 (3–4): 565–80. doi:10.1016/j.jebo.2008.09.003.
- Vezzani, A., Montobbio, F., Montresor, S., and Tarasconi, G. 2014. The patenting activity of the top IRI scoreboard companies: An introductory note. JRC Technical Report 2014. Seville, Spain: European Commission.
- Vogel, J. 2015. The two faces of R&D and human capital: Evidence from Western European regions. Papers in Regional Science 94 (3): 525–51. doi:10.1111/pirs.v94.3.
- Weitzman, M. L. 1998. Recombinant growth. Quarterly Journal of Economics 113 (2): 331–60. doi:10.1162/003355398555595.
- Windmeijer, F. 2002. ExpEnd, a Gauss programme for non-linear GMM estimation of exponential models with endogenous regressors for cross section and panel data. Working Paper. London: Institute for Fiscal Studies.
Appendix A.1: Variables Construction
—Dependent variable: New_RTAit
In analytical terms, our dependent variable can be synthetically defined as
Where New_RTAist = 1 if RTAist > 1 and 0 < RTAist-k < 1; 0, otherwise, and where RTAist denotes the Revealed Technological Advantage (RTA) of region i (out of n) in technology s (out of m) at time t. This is in turn captured with a standard Balassa indicator for trade specialization, redefined in terms of number of patents filed in the corresponding IPC class (PATist) (Soete Citation1987):
In our sample, m = 632 and n = 235. According to the standard interpretation of the Balassa index, a region has a technological specialization in s when RTAist is greater than 1, although it does not have such a specialization if the indicator is in-between 0 and 1.
In building New_RTAit, the absence of conclusive recommendations about its specification induced us to use a lag of 1 year (k = 1) for the emergence of a new RTA.Footnote1 This choice may suffer from the inherent volatility of patent statistics, because the emergence of a new RTA in one year may be artificially due to a small number of applications in that specific field the year before. In order to attenuate this source of distortions, a five-year moving average was used in the construction of the dependent variable. Although arbitrary to a certain extent, a five-year period of time can be reasonably thought long enough to smooth the erratic trend of the flow of patents.
—Technological relatedness: Av_Densit
We first calculate a proximity measure (φ) between two technologies, s and z, which is defined as the minimum of the pairwise conditional probability of a region having RTA in a technology s, given that it has a RTA in another technology z, that is
Where
The idea is that the higher is the number of places in which two different technological fields jointly appear as technological specializations, the higher the technological relatedness between the two. The rationale for this measure lies in the cognitive mechanisms behind the generation of technological knowledge in regional contexts (Quatraro Citation2009, Citation2010). The fact that two technological fields are frequently observed as distinctive advantages across regions may imply that they rely on similar or complementary capabilities and competences.
For each focal technology z, we then calculate the (weighted) average proximity with respect to it of the different s technologies in which region i has gained a new revealed technological advantage at time t, as follows
Finally, for each and every region i, we calculate the regional average (or average density) of these z-specific distances at time t-1, by weighting them with the (relative) revealed technological advantages that the region has gained in z at time t, that is
Av_Densit is thus a proxy for the extent to which the new technological advantages that a region gains at time t are, all together (that is, on average), close (in the sense specified above) to those in which it had gained an advantage in the previous period t-1. In brief, it is a proxy for the idea of related variety. Also in this case, it should be noted that working with the one-year lag of a technological specialization index in the construction of this variable may make it suffer from the erratic trend of the flow of patents over time. Once again, we tried to accommodate this problem by making use of five-year moving averages of the transformed Balassa index (i.e., New_RTA) that enters the construction of Av_Dens.
Specialization in KETs: RTA_KETsit-1 and RTA_KETsjit-1
Again referring to the idea of revealed technological advantage, its formula (Eq. A2) is calculated by considering regional patents in any of the KETs-mapped IPC classes (RTA_KETsit-1) and in those that pertain to each KETs j of the six (RTA_KETsjit-1). In both cases, for the same reasons as discussed with respect to the dependent variable, a five-year moving average was considered.
Appendix A.2: Econometric Strategy
The GMM model that we implemented is the GMM estimator originally proposed by Arellano and Bond (Citation1991), which obtains asymptotically efficient estimators in the presence of arbitrary heteroscedasticity, taking into account the structure of residuals to generate consistent estimates. More precisely, we used the GMM System (GMM-SYS) estimator in order to increase the efficiency of the estimates (Arellano and Bover Citation1995; Blundell and Bond Citation1998). Indeed, this estimator instruments the variables in levels with lagged first-differenced terms to obtain a dramatic improvement in the relative performance of the system estimator as compared to the usual first-difference GMM estimator.
Because the direct application of this estimator to our original dependent variable, which was a count (i.e., discrete and nonnegative) one, raised some problematic issues,Footnote2 we followed Bonaccorsi et al. (Citation2013) and used as a dependent variable for the GMM estimations the inverse hyperbolic sine transformation of the number of new revealed technological specializations. Put briefly, this transformation can be interpreted as a logarithmic transformation, but it is more appropriate when the dependent variable assumes value zero for some observations (Burbidge, Magee, and Robb Citation1988).
Table A3.1 New Revealed Technological Advantages at Technology Level (New_RTAist) and Regional Specialization in KETs (KETs_RTAit-1)
As regards the choice of the spatial Durbin model (SDM), its selection was consistent with the recent appreciation in the literature of its superior performance with respect to other spatial models. This is well summarized in Elhorst’s (2014) classic book, which concludes the survey as follows: “Originally, the central focus of spatial econometrics has been on the spatial lag model (SAR) and on the spatial error model (SEM) with one type of interaction effect. The results shown in this chapter make clear that this approach is too limited and that the focus should shift to the spatial durbin model (SDM)” (ibid., 33).
In order to get further support for our choice, we follow Belotti, Hughes, Piano Mortari (Citation2016, 15) and run two postestimation estimation tests, which allow us to check whether the SDM is an appropriate choice, as compared to SAR and SEM, and whether the spatial structure of the error is relevant. Test 1 is a linear hypothesis test, in which the null hypothesis is that the coefficient of the spatially lagged regressor is equal to zero. Test 2 is a nonlinear hypothesis, in which the null is that the coefficient of the spatially lagged regressor is equal to the product between the coefficient of the not spatially lagged same regressor and the coefficient of the spatially lagged dependent variable. The results are reported at the bottom of , and confirm that our econometric strategy is actually the most appropriate.
As for the problems due to the application of SDM to panel data,Footnote3 we used the same transformation that was implemented to run the GMM estimations.