
 ?Mathematical formulae have been encoded as MathML and are displayed in this HTML version using MathJax in order to improve their display. Uncheck the box to turn MathJax off. This feature requires Javascript. Click on a formula to zoom.
abstract
This article examines which economic domains regional policy makers aim to develop in regional innovation strategies, focusing in particular on the complexity of those economic domains and their relatedness to other economic domains in the region. We build on the economic geography literature that advises policy makers to target related and complex economic domains, and assess the extent to which regions actually do this. The article draws on data from the smart specialization strategies of 128 NUTS-2 regions across Europe. While regions are more likely to select complex economic domains related to their current economic domain portfolio, complexity and relatedness figure independently, rather than in combination, in choosing priorities. We also find that regions in the same country tend to select the same priorities, contrary to the idea of a division of labor across regions that smart specialization implies. Overall, these findings suggest that smart specialization may be considerably less place based in practice than it is in theory. There is a need to develop better tools to inform regions’ priority choices, given the importance of priority selection in smart specialization strategies and regional innovation policy more broadly.
In recent years, smart specialization has become the dominant approach to regional innovation policy in Europe. Smart specialization is a place-based approach to economic development policy, characterized by the identification of strategic areas for intervention and based on an analysis of the strengths and potential of a regional economy (Tödtling and Trippl Citation2005; Foray, David, and Hall Citation2011; Foray Citation2015; Asheim, Grillitsch, and Trippl Citation2016; Rodríguez-Pose and Wilkie Citation2016; Balland et al. Citation2018a). This identification of priorities should target economic domains where regions have the greatest potential to develop competitive advantage. Thus, smart specialization seeks to ensure the focus on those sectors or economic domains embedded in the region and related to its existing strengths.
For higher-level authorities, this helps to avoid unnecessary duplication across regions within their territories (Foray, David, and Hall Citation2011; Hassink and Gong Citation2019). Indeed, early evaluations show much heterogeneity across regions in their priorities, potentially reflecting the achievement of this aim (McCann and Ortega-Argilés Citation2016). Furthermore, contrary to what its name might suggest, smart specialization is not about promoting further specialization in existing clusters, but rather a policy to promote diversification into new economic domains.
Of course, assessing the potential of a region to succeed in developing a new economic domain is a difficult task. However, the regional studies literature widely acknowledges that relatedness and complexity may provide a useful basis for the design of smart specialization policies (Boschma Citation2014; Boschma and Gianelle Citation2014; McCann and Ortega-Argilés Citation2015; Balland et al. Citation2018a). Following the related diversification literature, the likelihood of success is higher in economic domains closely related to the existing economic structure of the region (Neffke, Henning, and Boschma Citation2011; Essletzbichler Citation2015). Meanwhile, competition from other regions is lower in more complex economic domains where succeeding is comparatively more difficult (Hausmann, Hwang, and Rodrik Citation2007). While an abundance of papers advises policy makers to target related and/or complex economic domains (Frenken, Van Oort, and Verburg Citation2007; Boschma and Iammarino Citation2009; Boschma, Minondo, and Navarro Citation2013; Diodato and Weterings Citation2015; Balland and Rigby Citation2017; Frenken Citation2017), we know little about whether policy makers are actually doing this—specifically, to what extent complexity and relatedness are already factors in regions’ selection of priority areas.
However, a recent article concludes that regional strategies are detached from the economic conditions of the region and tend to mimic neighboring regions’ strategies (Di Cataldo, Monastiriotis, and Rodríguez‐Pose Citation2021). Although the benefits of relatedness and complexity in regional diversification processes were already fairly well established at the start of the first programming period for smart specialization (2014–20), much of the theoretical and empirical literature had not yet been developed. However, regions were meant to identify areas where they had unique potential to develop competitive advantage. Hence, examining whether they targeted economic domains consistent with the overall policy aim of diversification is of interest. This requires comparing the regions’ actual priorities to the priorities that state-of-the-art research on diversification processes would recommend.
Assessing relatedness and complexity is a demanding task, likely to exceed many regions’ policy capacity (Wu, Ramesh, and Howlett Citation2015). When smart specialization was first implemented, few tools were available to assist regions. Therefore, very few used formal tools such as product space modeling or value-chain analysis. Instead, most regions relied on informal methods, such as regional profiling, strengths, weaknesses, opportunities, and threats (SWOT) analysis, and focus groups, to analyze the regional context (Griniece et al. Citation2017a). Hence, the extent to which regions can identify the areas in which they have the most potential is unclear. The inability to do so would limit smart specialization’s potential to work in practical policy making.
To analyze the extent to which regions tend to select areas where they have the potential to develop competitive advantage, we examine which economic domains they prioritize in their smart specialization strategies. A limited body of research has examined why regions select the priorities they do. We find that regions are more likely to select as priorities economic domains that closely relate to the region’s economic structure or represent highly complex economic domains. However, regions tend to select economic domains that are either related or complex; they do not combine the two dimensions. Hence, they do not incorporate the advice to select complex economic domains that are also related to their economic structure. Furthermore, even when controlling for regional characteristics, we find that regions in the same country tend to select the same priorities. Contrary to the place-based ideals of smart specialization, fashionable national policy may strongly influence what strategies actually emerge.
The remainder of the article is structured as follows. The next section provides an overview of the debate on smart specialization and insights into the existing empirical evidence for how regions should and actually do prioritize. This is followed by a section that explains the empirical data and methods. The penultimate section presents and discusses the results, while the last section concludes the article.
Smart Specialization as a Policy Approach
Since 2014, smart specialization has been the central concept in the EU’s approach to both regional innovation policy and cohesion policy. Under the 2014–20 program for the European Structural and Investment Funds, access to EU funding became conditional on the region having a smart specialization strategy (so-called ex-ante conditionality). As a result, “[o]ver the past five years, more than 120 Smart Specialization Strategies have been developed across Europe,” and more than €67 billion ($80 billion) have been made available to support them (Gómez Prieto, Demblans, and Palazuelos Martínez Citation2019, 5). The EU’s aim was for the application of smart specialization to lead to the launch of 15,000 new products to market, 140,000 new start-ups, and 350,000 new jobs by 2020 (Gómez Prieto, Demblans, and Palazuelos Martínez Citation2019, 5).
However, several scholars have raised doubts concerning the operationalization of smart specialization, accusing it of being undertheorized (Foray, David, and Hall Citation2011; Boschma Citation2014), lacking an empirical base (Morgan Citation2015; Iacobucci and Guzzini Citation2016; Santoalha Citation2019), poorly implemented, and ineffective in peripheral regions (McCann and Ortega-Argilés Citation2015). While building on laudable ideas, the rush to implement smart specialization meant that many regions simply did not have time to go through the extensive process that developing a proper strategy would require (Fitjar, Benneworth, and Asheim Citation2019). Rather than developing place-based policies tailored to their economic conditions, many regions—especially those with low-quality government—simply copied neighboring regions’ strategies (Di Cataldo, Monastiriotis, and Rodríguez‐Pose Citation2021).
Some scholars also highlight the term smart specialization itself as challenging. Many local actors had difficulties understanding the concept (McCann and Ortega-Argilés Citation2015; Capello and Kroll Citation2016; Griniece et al. Citation2017b; Foray Citation2019; Gianelle, Guzzo, and Mieszkowski Citation2019). In this context, specialization does not imply a cluster policy in the Porterian tradition (Asheim, Grillitsch, and Trippl Citation2017) but, rather, indicates ‘diversified’ specialization (Hassink and Gong Citation2019). Hence, regions should identify economic domains in which they can potentially develop a competitive advantage and aim to diversify into those domains (Marrocu et al. Citation2020). However, the word specialization led some policy makers to believe that they should mainly prioritize existing specializations in line with traditional cluster policy. This discrepancy in understandings can lead to wholly divergent implementations and ultimately divergent results (Hassink and Gong Citation2019).
While smart specialization does provide an important counterweight to previous top-down approaches, the lack of a robust and well-founded evidence base on which to build the concept created difficulties for the regions (Morgan Citation2015). Its operationalization made this most evident, prompting criticism that it was a “perfect example of policy running ahead of theory” (Foray, David, and Hall Citation2011, 1). Given the ambitious goals of the concept and its centrality in the EU’s innovation and cohesion policy framework, this lack of a clear evidence base is worrying. Smart specialization must be based on diagnoses of the regional economy that identify potential sources of competitive advantage (Crescenzi, de Blasio, and Giua Citation2020). The significant challenge of how best to operationalize the concept has led to a flurry of research aiming to inform regions on how they should select priorities (Foray, David, and Hall Citation2011; Balland et al. Citation2018a; Gianelle, Guzzo, and Mieszkowski Citation2019; Whittle Citation2020). However, most of this evidence did not exist when EU regions first developed smart specialization strategies in 2014. Hence, very few regions used tools to analyze the regional context, which would have allowed them to identify priority areas in accordance with the policy recommendations of this research (Griniece et al. Citation2017a).
Smart Specialization, Relatedness and Complexity
The successful development of smart specialization relies on evidence on how regions can sustain competitive advantage over time and upgrade their economic basis. The literature on related diversification addresses precisely these issues (Boschma Citation2017). Hence, this literature has considerable potential for informing smart specialization policies. Balland et al. (Citation2018a) argue that smart specialization requires a combination of relatedness (Hidalgo et al. Citation2007; Neffke, Henning, and Boschma Citation2011) and complexity (Hidalgo and Hausmann Citation2009), and therefore, these factors should influence the choice of economic domains for regional policy to prioritize.
The literature on related diversification emphasizes the role of relatedness in shaping path-dependent regional development (Boschma and Iammarino Citation2009; Frenken Citation2017). A primary determinant of regions’ ability to enter new activities (e.g., products, technologies, industries) is the presence of related activities in the region (Neffke, Henning, and Boschma Citation2011; Essletzbichler Citation2015). Relatedness is defined by two activities requiring similar knowledge or inputs (Hidalgo et al. Citation2018). The probability of a region entering or exiting an economic domain can be translated into a risk assessment of diversification-oriented policies. In this context, regions will be more likely to fail if they try to diversify into economic domains unrelated to their current portfolio. A pertinent question for policy is whether relatedness involves a market failure that requires intervention (Mewes and Broekel Citation2020). Notably, in addition to opening comparatively easy paths of diversification, relatedness also constrains quick transformations into economic domains in which regions lack competence.
However, the complexity of the economic domain also matters in diversification. While diversifying into simple economic domains is relatively easy, diversifying into complex ones is much harder. However, this also implies greater potential value in complex economic domains, with less competitive pressure. Much of the recent research on complexity builds on the seminal works of Fleming and Sorenson (Citation2001), Sorenson, Rivkin, and Fleming (Citation2006), and Hidalgo and Hausmann (Citation2009). Notably, Hidalgo and Hausmann (Citation2009) propose that the ability to create and utilize complex knowledge forms the basis of competitive advantage. Balland et al. (Citation2018a) point to complex knowledge bases functioning like conventional balances of supply and demand: “Technologies that are simple to copy, and which can be moved easily over space, tend to be of little value and thus do not provide a source of long-run rents. Technologies that are more complex and difficult to imitate are more sticky in space” (Balland et al. Citation2018a, 1254). These sticky and complex technologies tend to offer particular and, indeed, unique benefits, corresponding to the idea of smart specialization to support the emergence of unique (regional) competitive advantages.
Hence, we must combine the two dimensions to assess a region’s potential for diversifying into a new economic domain (Hidalgo et al. Citation2007; Asheim, Moodysson, and Tödtling Citation2011; Neffke, Henning, and Boschma Citation2011; Balland et al. Citation2018a, Citation2018b; Asheim Citation2019). The smart specialization framework by Balland et al. (Citation2018a) in can help in designing or evaluating smart specialization policies in general and guiding the choice of priority areas in particular. This framework advises regions to aim at activities (e.g., technologies and sectors) that closely relate to their existing competencies and are complex, as these have low risk (high relatedness) and high potential benefits (high complexity). If regions seek to minimize risks and maximize benefits, most priority areas that they choose should fall into this category.
Figure 1. Framework for smart specialization
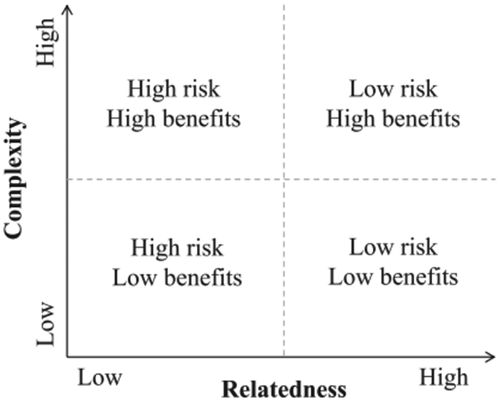
Using both relatedness and complexity in this assessment is fundamental, as the two dimensions also interact. The development of complex economic domains is inherently more difficult. Hence, relatedness is more important for diversification into complex economic domains than for diversification into simple ones. Whilst complex economic domains do offer advantages, selecting them as priorities requires that they be rooted in activities related to the current regional economic profile. Otherwise, regions are unlikely to succeed with no existing competence on which to build. Conversely, developing the capabilities for relatively simple economic domains will be easier. Hence, the presence in the region of related economic domains may not matter very much for such processes.
On this basis, we formulate three hypotheses. We do not intend them as predictions for how regions will actually develop smart specialization strategies. Indeed, most of the evidence suggests that regions do not systematically assess economic domain relatedness or complexity (Griniece et al. Citation2017b; Di Cataldo, Monastiriotis, and Rodríguez‐Pose Citation2021). Rather, we present these hypotheses as policy recommendations from the diversification literature, against which we can evaluate the priorities that regions have actually chosen. This allows an examination of the extent to which the implementation of smart specialization in regional strategies corresponds to the overall policy aims of promoting diversification.
H1: The relatedness of an economic domain to the region’s existing economic domains increases the probability of it being chosen as a priority in regions’ smart specialization policies.
H2: The complexity of an economic domain increases the probability of it being chosen as a priority in regions’ smart specialization policies.
H3: The impact of relatedness on the probability of a domain being chosen as a priority in regions’ smart specialization policies is higher for more complex economic domains.
Other Influences on Policy
Identifying and prioritizing economic domains that are both complex and related to regions’ economic profiles is not a straightforward process. Even scientists lack a common definition or measure of complexity. This becomes even more challenging when also identifying what are often rarities in regional economic structures. That is, domains that are place specific, difficult to replicate, and that may be difficult to develop organically. Naturally, this involves comparing the focal region to others, requiring substantial capacities for data access, analysis, and evaluation. Although peer review between regions has formed a central component of the monitoring process of smart specialization since the early stages of its implementation (Midtkandal and Rakhmatullin Citation2014), it does not necessarily help regions to identify related and complex economic domains. This challenging task requires particular skills that many regions are unlikely to possess.
Hence, various factors other than relatedness and complexity are likely to shape regions’ choices of priorities. The development of smart specialization policy has perhaps not adequately considered policies as the result of a political process rather than a technocratic exercise that always selects the optimal policies. To understand how regions implement smart specialization, we also must consider how political factors influence the selection of economic domains to prioritize. We highlight the influence of two such factors: large incumbent economic domains and neighboring regions.
As argued above, the idea behind smart specialization is to promote diversification. However, the name—specifically referring to specialization—can confuse policy makers, leading them to interpret it as a policy to promote further specialization in existing strengths (Capello and Kroll Citation2016; Gianelle, Guzzo, and Mieszkowski Citation2019; Hassink and Gong Citation2019). Therefore, we could expect many regions to target large incumbent economic domains as priority areas. Such economic domains are also more visible in the region and, thus, may serve as focal points in discussing potential priorities. Large incumbent economic domains also have resources for lobbying policy makers to prioritize their economic domain, and they employ a large number of voters. Hence, the current size of an economic domain may influence the likelihood of its selection as a priority.
Furthermore, in addition to intraregional factors, external influences shape policy. The literature on policy mobility and policy diffusion emphasizes that policies tend to move across regions, as governments try to learn from best practices in neighboring jurisdictions (Shipan and Volden Citation2008; Cochrane and Ward Citation2012). This is also common when selecting economic domain priorities and is part of the reason for the emergence of Silicon Somewheres (Hospers Citation2006) and other one-size-fits-all approaches to regional development (Tödtling and Trippl Citation2005), precisely what smart specialization tries to avoid. Nonetheless, evidence of spillovers from neighboring regions also applies to smart specialization strategies. Regions tend to replicate neighboring regions’ strategies, to secure funds or save time when meeting the deadlines that rapid implementation of the policy may impose (Di Cataldo, Monastiriotis, and Rodríguez‐Pose Citation2021). To examine the importance of policy mobility in the selection of economic domain priority choices, we must consider how regional priorities correspond to those of neighboring regions or other regions in the same country. The similarity in priorities across neighboring regions may reflect either similar economic structures across several regions or learning or copying from nearby practices. The national political context also likely inspires and restricts regional choices.
Data and Methods
Relatedness, Complexity, and Economic Domain Priorities in EU Regions
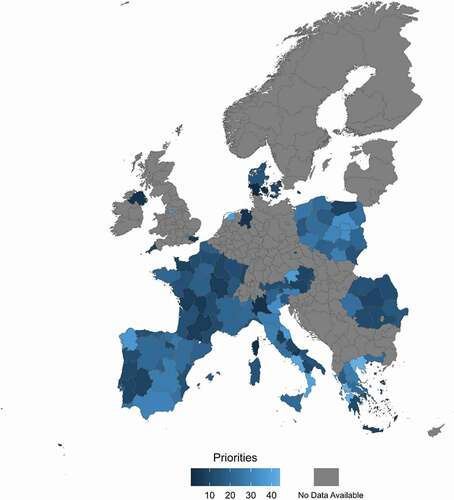
To study how the relatedness and complexity of economic domains shape the likelihood of their selection as priority economic domains within regions’ smart specialization strategies, we collected regional data on industrial structures and smart specialization strategies at the NUTS-2 level. The data set includes 128 regions across Europe for which we have data on the selection of economic domains at the regional level. These NUTS-2 regions have developed smart specialization strategies,Footnote1 and they include most regions in France, Spain, Portugal, Italy, Denmark, Poland, Greece, and Romania, as well as some regions in the Netherlands and the UK. provides a full overview of the spatial distribution of these regions. Economic domains are differentiated at the two-digit NACE industry level, implying the division of regional economies into sixty-six industries. The data covers 2012–18.
Figure 2. Number of priorities selected by NUTS 2 regions
The central variable is whether a region has selected a particular economic domain as a priority in its smart specialization strategy. We extract information on the selected economic priorities from regions’ smart specialization strategy documents, coded by the European Commission’s Joint Research Centre (European Commission Citation2021). Accordingly, the dependent variable, ECONOMIC DOMAIN PRIORITY CHOICE, is based on data the European Commission makes available through its Smart Specialization Platform. This is coded dichotomously, with the value of 1 indicating an economic domain’s selection as a priority and 0 otherwise.
The central explanatory variables are RELATEDNESS and COMPLEXITY. We compute relatedness between economic domains based on co-occurrence at the regional level, following established practice in the literature (Boschma and Gianelle Citation2014; Boschma, Balland, and Kogler Citation2015; Marrocu et al. Citation2020). Accordingly, we compute location quotients (LQ) based on employment data from the Structural Business Statistics (SBS) data set (Eurostat Citation2020). LQ exceeding 1 (i.e., the region is more specialized in this economic domain than the average European NUTS-2 region) implies that the region has a revealed comparative advantage (RCA) in this economic domain. Subsequently, we count the frequency of economic domains’ RCA coinciding in regions and normalize this number, as Van Eck and Waltman (Citation2009) suggest. On this basis, we calculate the normalized relatedness density for each economic domain and region (for details, see Boschma, Balland, and Kogler Citation2015).Footnote2 High values of this variable indicate that a region has a comparative advantage in many other economic domains related to the focal economic domain.
As of today, there is no common approach to calculate the complexity of economic domains. Frequently, the so-called Economic Complexity Index is used (Hidalgo and Hausmann Citation2009), but it is a rather indirect measure of complexity, and applying it to European data has many problems (for a discussion, see Broekel Citation2019). Fortunately, the labor economics literature offers an interesting alternative that the geography of innovation literature has also picked up recently (Lo Turco and Maggioni Citation2020). More precisely, we rely on the idea of (occupational) skill complexity from Caines, Hoffmann, and Kambourov (Citation2017), which defines a complex occupational task as one that requires certain higher-order skills. These include the “ability to abstract, solve problems, make decisions, or communicate effectively” (Caines, Hoffmann, and Kambourov Citation2017, 1). In total, Caines, Hoffmann, and Kambourov (Citation2017) use the importance of 34 tasks to calculate the complexity of 968 different occupations in the US O*NET survey database, by means of the normalized loadings of the first component of a principal component analysis. Large values imply that the occupation requires a higher ability to abstract, solve problems, communicate, and make decisions. The highest value is observed for physicists and astronomers and the lowest for vehicle cleaners. As Caines, Hoffmann, and Kambourov (Citation2017) show, this variable positively correlates with wage levels and growth, underlining the economic benefits of more complex occupations. We use the 2019 Standard Occupational Classification to International Standard Classification of Occupations (SOC-to-ISCO) crosswalk to connect the 968 SOC occupations to 424 four-digit ISCO occupations and make the measure compatible with European data. In a further step, we use the shares of the 424 occupations in each two-digit NACE industry in Europe to aggregate the information into the final variable COMPLEXITY. That is, we estimate the weighted mean complexity of each two-digit NACE industry based on its composition of 424 ISCO occupations.
To highlight the dispersion of economic priorities, presents an overview of the distribution of economic domains (either selected or not selected as priorities) across all regions. The lighter, yellow-colored dots show economic domains that were not chosen as priorities, while darker blue dots are those chosen as priorities. The Y-axis represents complexity as expressed by deviation from the respective national average and the X-axis represents relatedness similarly by its deviation from the corresponding national average. We use the national instead of the European average as benchmarks, to account for the substantial variation in countries’ relatedness and complexity values.
Figure 3. Relatedness and complexity of economic domains in EU regions and the selection of priority economic domains
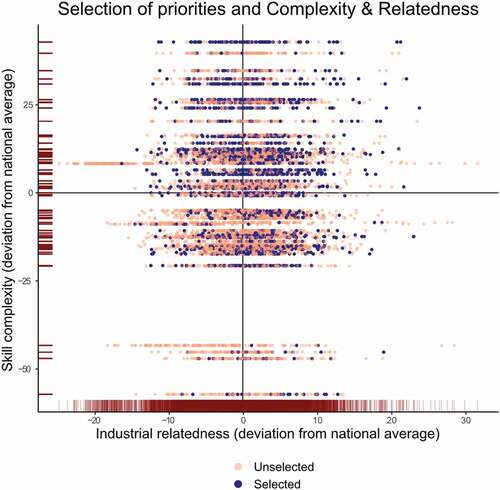
The figure indicates no clear pattern in the selection of domains, in terms of their RELATEDNESS and COMPLEXITY.Footnote3 Regions do select some domains that are both complex and related, but they also frequently select complex domains that are not related to their existing economic strengths. Many regions also select rather simple domains. Notably, we observe a large number of priorities that are below average in both complexity and relatedness. The previously presented framework shows few reasons to prioritize these as domains for future development.
summarizes the distribution of selected priorities by their level of relatedness and complexity, again using national averages as benchmarks. The combination of above (national) average relatedness and above (national) average complexity is the most frequent configuration of selected priorities, which supports the idea that the design of smart specialization strategies at the regional level was relatively successful in targeting economic domains in which the regions had the potential to develop competitive advantage.
Table 1 Number of Prioritized Economic Domains, by Relatedness and Complexity
Empirical Approach
The dependent variable is binary, calling for the application of a logistic regression approach. As the decision on priorities occurs only once for each region during the observation period, we opt for a cross-sectional choice model, despite the availability of all other variables for multiple years. Moreover, to approximate the socioeconomic situation at the time the decision was made, that is, when regions wrote their smart specialization strategy documents, we exclusively consider the variables’ mean values for the five years prior to the year in which the region adopted its smart specialization strategy.
Unfortunately, we have very little information about the decision-making process for selecting priorities in regional smart specialization strategies. From an empirical point of view, it particularly matters if the decision about an individual economic domain i is made independently of considerations regarding other economic domains. Put differently: Is each choice made independently of other alternatives, or does it depend on whether the region prioritizes other economic domains? If the choice is independent, an unconditional binary choice model can apply. If it depends on other choices, we should instead use a conditional binary choice model. Besides the assumption of independent choices, the two approaches have other important differences. Notably, in the conditional choice model, the design of the model fully accounts for region-level factors that do not vary across choice alternatives, substantially reducing the potential for omitted variable bias. However, it also precludes the inclusion of variables at this level, a major drawback. As both approaches have good arguments in their favor, we estimate both models and compare their results.
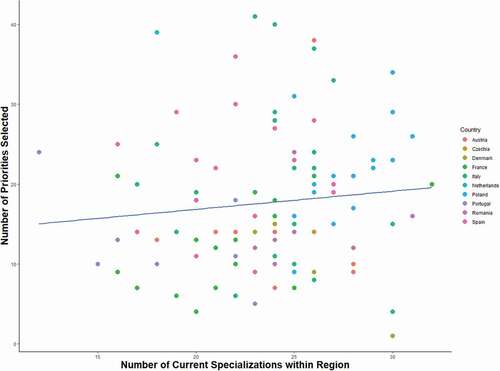
An initial look at the data reveals that the number of priorities selected varies greatly across regions (), from a minimum of three to a maximum of forty unique economic domains.Footnote4 The number of priorities only weakly correlates to the population size of the region. For instance, the second largest region has selected four priorities, while the smallest has selected almost thirty. It is also not related to the number of economic domains in which the region currently has a comparative advantage (LQ > 1). Hence, we find no clear pattern that can account for variation in the number of priorities that regions select (). Put differently, the number of chosen priorities does not seem to correspond to a particular strategy or follow obvious systematic patterns that reflect certain regional characteristics, contrary to what would have been expected with nonindependent decisions.
Figure 4. Number of economic domain priorities selected by region
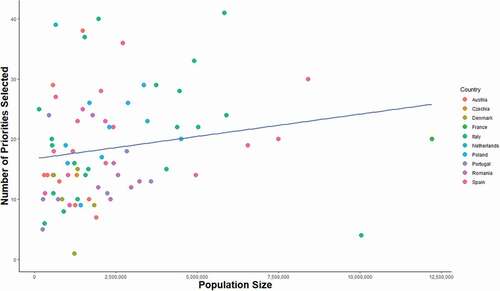
Figure 5. Number of selected priorities and current specializations
In both modeling approaches (conditional and unconditional), the dependent variables represent the likelihood that a region has selected an economic domain as a priority.
The unconditional logit model takes the following form:
The conditional logit model follows broadly the same structure, except that the regions simultaneously evaluate all economic domains as potential priorities. However, the conditional logit framework does not allow for the inclusion of variables that do not vary within the region. Hence, the conditional model does not include the controls for development and the number of priorities.Footnote5
In both models, we examine whether the probability of selecting an economic domain as a priority economic domain is a function of its relatedness to other economic domains in the region and its complexity. We also test whether regions will more likely select complex economic domains related to their existing economic structure—following the smart specialization framework recommendations—by including an interaction term between RELATEDNESS and COMPLEXITY in the regression models.
To isolate the relationships between these variables and the priority selection, we control for three main confounding influences: first, the region’s general development level, measured by regional gross domestic product (GDP) per capita and the number of patent applications per million capita; second, the size of the economic domain in the region, measured as the relevant NACE two-digit industry’s share of regional employment; and finally, external influences from other regions, measured by whether a neighboring region or any other region in the same country has selected the same economic domain as a priority, to account for policy mobility. In addition, we control for the number of other priorities that the region has selected. Appendix shows descriptive statistics for all variables included in the model.
Given that the observations are grouped by economic domain and region, we use multiway clustered standard errors at these two levels in all estimations. Using fixed effects in the unconditional model leads to overspecification issues. Therefore, we use fixed effects at the country level as a second-best option and support this choice by comparing the results with those of the conditional model. Both models yield very similar results, with only minor differences in the coefficients and levels of statistical significance. Consequently, we consider the results of both models jointly to discuss the findings.
The Dispersion of Economic Priorities
shows the results of the unconditional logistic regression analysis and those of the conditional model, using odds ratios. Appendix and additionally show the same results, displaying regression coefficients.
Table 2 Unconditional Choice Model
Table 3 Conditional Choice Model
The coefficient for RELATEDNESS is positive and highly significant in all models. RELATEDNESS has a considerable impact on the likelihood of a domain being chosen as a priority. The coefficient varies between 1.02 and 1.05 in the unconditional model, and between 1.06 and 1.08 in the conditional model. This implies that an increase of one unit in the relatedness of an economic domain to other economic domains in the region increases the odds of it being chosen as a priority by between 2 percent and 8 percent, depending on the model. Hence, regions are more likely to select priority areas when they have related capacities in other economic domains. This confirms H1. Notably, the observed relations between RELATEDNESS and priority selection are stronger than those reported by Marrocu et al. (Citation2020).
The coefficient for COMPLEXITY is also positive and significant at all levels, although generally at somewhat lower levels of significance. In particular, the significance level of the coefficient drops when we control for whether another region in the same country has chosen an economic domain as a priority (NAT.PRIO). The effect size is also notably lower than that of RELATEDNESS. In both models, a one-unit increase in the complexity of an economic domain is associated with an increase of between 1 percent and 2 percent in the odds of it being selected as a priority.Footnote6 These findings support H2. Accordingly, both dimensions of the smart specialization framework (Balland et al. Citation2018a), RELATEDNESS and COMPLEXITY, whether by accident or design,Footnote7 influence the decision of whether an economic domain is chosen as a priority in regions’ smart specialization strategies.
However, the smart specialization framework also proposes an interaction between these two variables, that is, that regions should mainly select complex economic domains related to their current portfolio. To address this, we include an interaction between the two variables in the regression. The results do not show any evidence of an interaction between RELATEDNESS and COMPLEXITY. The interaction term is not significant, and if anything, it tends to be negative. Hence, regions are not more likely to prioritize complex economic domains that are related to their other economic domains than those that are not. While RELATEDNESS and COMPLEXITY individually are useful in predicting the likelihood of a domain being chosen as a priority, there is no positive interaction between the two. Regions tend to prioritize economic domains that are complex regardless of their relatedness, which reflects a tendency to pick winners regardless of the regional economic landscape—quite opposite to the aims of smart specialization (Fedeli et al. Citation2020). This aligns with the findings of Crescenzi, de Blasio, and Giua (Citation2020) that some regions may select priority areas that are too advanced and, therefore, unrelated to their production system. They also tend to prioritize related economic domains regardless of their levels of complexity. Accordingly, in many instances, the chosen priority is unlikely to contribute to upgrading their economic basis—again, contrary to the aims of smart specialization. Accordingly, H3 is rejected.
Notably, the unconditional and the conditional models yield very similar results, both for the main and the control variables. No formal test determines whether the conditional model is more appropriate. Nonetheless, this suggests that the unconditional model fits the data well, with the conditional model providing little additional value. Substantially, this supports the idea that regions indeed evaluate each domain as a potential priority, independently of other domains, rather than taking a portfolio approach to the selection of priorities.
Most of the control variables—in particular, GDP and PATENTS—remain nonsignificant. The nonsignificant coefficients also imply that we do not find evidence that more developed regions with a presumably larger capacity—as more innovation output or larger economies reflect—select a larger number of priorities. This is consistent with the findings of Di Cataldo, Monastiriotis, and Rodríguez‐Pose (Citation2021).
We also do not find the employment share of the focal economic domain to have a significant coefficient in any models, although the direction tends to be positive. Hence, we cannot establish whether regions mainly employ smart specialization strategies to promote diversification or to further strengthen existing specializations.
The controls for the priorities of neighboring regions (NEIGH.PRIO) and other regions in the same country (NAT.PRIO) capture the influence of policy mobility. Only NAT.PRIO has a significant coefficient. The significance is robust in all model specifications and holds in both the unconditional and conditional models. Hence, regions in the same country tend to select the same priority areas. When at least one other region in the country has also selected an economic domain, the odds that an economic domain is selected increase by 4 percent.
Finally, in the unconditional model (), we also control for the general propensity to select priorities, as approximated by the total number of other priorities a region has chosen (PRIORITY). Obviously, the coefficient is significantly positive. In regions that tend to choose a larger number of priorities, each economic domain has a greater likelihood of selection.
Conclusion
This article examines whether the selection of economic domain priorities in regional smart specialization strategies corresponds to the recommendations of the related diversification literature. We find that regions tend to prioritize domains related to their current specializations or that are complex. However, we do not find an interaction between the two dimensions, that is, relatedness does not matter more for the selection of complex economic domains as priorities than for the selection of simple ones.
These findings open broader discussions surrounding the role of policy actors and institutions, and how they select priorities. The process for identifying smart specialization priorities often lacks solid data and tools to guide the selection of domains, and the identification of priorities is based on intuition and anecdotal evidence (Iacobucci and Guzzini Citation2016). A key question for smart specialization is why relatedness does not matter more when regions select complex economic domains. Regions seem to aim for related diversification without considering the attractiveness of the economic domains into which they are diversifying. This may support activities that are likely to take place anyway and may fail to stimulate new, otherwise unrealized domains. Alternatively, they tend to chase after fashionable domains, regardless of whether they have the requisite competencies to succeed in these areas. Neither approach is consistent with the types of selections that smart specialization seeks to encourage.
Of course, relatedness and complexity are not the be-all and end-all of smart specialization. It is entirely possible that in some cases, the entrepreneurial discovery process may identify entirely new combinations of economic domains that nobody thought would be related and, therefore, that the relatedness framework cannot capture. It may also develop ideas that could make hitherto simple economic domains more complex. However, this is unlikely to account for a general tendency across regions to consider relatedness and complexity independently of each other.
This raises the question of whether smart specialization can deliver on its objectives to promote diversification and upgrading of regional economies in Europe. Thus, we provide further support for the contention of Di Cataldo, Monastiriotis, and Rodríguez‐Pose (Citation2021, 16) that “S3 strategies may be individually ‘smart,’ but collectively sub-optimal.” These findings are consistent with earlier literature highlighting the difficulties of translating the complex smart specialization policy concept into practical implementation (Marques and Morgan Citation2018; Gianelle, Guzzo, and Mieszkowski Citation2019; Hassink and Gong Citation2019). Developing tools that can support the selection of regional priorities and ensure that they are consistent with the aims of smart specialization requires more work.
Related to this point is another insight from the empirical analysis. The similarity in the results of the conditional and unconditional regression models adds some empirical support for the view that policy makers are likely to assess potential priorities one by one, rather than jointly. Put differently, regions seem to evaluate each economic domain independently, rather than relative to other domains. In addition to its relevance for the empirical modeling of such choices, this finding also suggests that no strategic or portfolio approach applies to the selection of priorities. With this approach, regions are unlikely to exploit potential complementarities between targets and adopt a coherent intersectoral regional strategy. However, testing this more explicitly requires more empirical research.
The analysis has limitations that must be duly acknowledged. We do not know whether the strategies were successful or unsuccessful in promoting diversification, only whether the priorities were consistent with the recommendations of the diversification literature. We also do not have insights into the processes by which regions developed their strategies, nor do we know whether the tendency for regions in the same country to select similar priorities reflects policy mobility or similar underlying conditions. This calls for further research on additional factors that shape regions’ priorities. Alongside this, there are various alternative measures of complexity besides the one used in this article, and the use of another indicator might have yielded different results. However, Broekel (Citation2019) discusses in detail the frequently used approach by Hidalgo and Hausmann (Citation2009) that produces generally unhelpful results for European regions. In contrast, the complexity indicator in this article is based on insights into occupational tasks and remains widely accepted in labor economics. Nonetheless, future studies could employ alternative measures of complexity.
This article contributes to what is already a spawning literature that seeks to evaluate the effectiveness of smart specialization, indeed, to better understand “how ‘smart’ smart specialization truly is” (Di Cataldo, Monastiriotis, and Rodríguez‐Pose Citation2021, 3). As the first phase of smart specialization (2014–20) comes to an end, this article can help further an understanding of the challenges remaining for operationalizing smart specialization. It points to the need for a clearer policy logic and more easily accessible tools to inform regions’ priority choices. The improved identification and selection of economic domains that a region should prioritize could achieve this, with the selection of priorities an important component of the effectiveness of smart specialization strategies in the future. Future research can also benefit from the large swaths of data that will become available with the release of the outcomes of the 2014–20 period.
Acknowledgments
Earlier versions of this article have been presented at the European Policies Research Centre at the University of Strathclyde and at the Rethinking Clusters conference 2020 in Valencia. The authors would like to thank participants at these events, as well as the editor and three anonymous reviewers at Economic Geography, for their valuable advice, which helped to improve the article. The authors would also like to thank the Centre for Innovation Research at the University of Stavanger for financial and academic support that made this work possible.
Notes
1 In other countries, NUTS-1 or NUTS-3 regions developed the smart specialization strategies. These are not included in the analysis.
2 We use the EconGeo package in R (Balland Citation2017) to do this.
3 For a more extensive discussion of these domains in the context of the framework for smart specialization in , see Asheim (Citation2019).
4 These numbers differ from those reported by Marrocu et al. (Citation2020), who find a variation from two to fifteen priority areas in smart specialization strategies. The difference stems from the fact that Marrocu et al. (Citation2020) use the priority descriptions as the basis for the analysis, while we use the distinct economic domains mentioned within those descriptions.
5 We use the region as a grouping variable and apply the conditional logit model in a common panel regression set-up.
6 The generally lower levels of significance and impact of COMPLEXITY may partly be due to it being a variable that does not vary across regions, just across economic domains, in contrast to the industry-region-specific nature of RELATEDNESS.
7 As discussed above, regions did not have formal tools at their disposal to allow them to analyze the relatedness or complexity of different priority areas directly (Griniece et al. 2017). Nonetheless, more informal methods, such as focus groups or SWOT analyses, could also lead to the identification of priorities related to the region’s existing strengths, and/or which would represent an upgrade to more complex economic domains.
References
- Asheim, B. T., Grillitsch, M., and Trippl, M. 2016. Regional innovation systems: Past—Present—Future. In Handbook on the geographies of innovation, ed. R. Shearmur, C. Carrincazeaux, and D. Doloreux, 45–62. Cheltenham, UK: Edward Elgar.
- Asheim, B. T. 2019. Smart specialization, innovation policy and regional innovation systems: What about new path development in less innovative regions? Innovation 32 (1): 8–25. doi:https://doi.org/10.1080/13511610.2018.1491001.
- Asheim, B. T., Moodysson, J., and Tödtling, T. 2011. Constructing regional advantage: Towards state-of-the-art regional innovation system policies in Europe? European Planning Studies 19 (7): 1133–39. doi:https://doi.org/10.1080/09654313.2011.573127.
- _____. 2017. Smart specialization as an innovation-driven strategy for economic diversification: Examples from Scandinavian regions. In Advances in the theory and practice of smart specialization, ed. S. Radosevic, A. Curaj, R. Gheorgiu, L. Andreescu, and I. Wade, 73–97. Cambridge, MA: Academic Press. doi:https://doi.org/10.1016/B978-0-12-804137-6.00004-8.
- Balland, P. A. 2017. Economic geography in R: Introduction to the EconGeo package. Papers in Evolutionary Economic Geography 17 (09): 1–75.
- Balland, P. A., Boschma, R., Crespo, J., and Rigby, D. L. 2018a. Smart specialization policy in the European Union: Relatedness, knowledge complexity and regional diversification. Regional Studies 3404:1–17. doi:https://doi.org/10.1080/00343404.2018.1437900.
- Balland, P. A., Jara-Figueroa, C., Petralia, S., Steijn, M., Rigby, D. L., and Hidalgo, C. A. 2018b. Complex economic activities concentrate in large cities. SSRN Electronic Journal 1–10. doi:https://doi.org/10.2139/ssrn.3219155.
- Balland, P. A., and Rigby, D. L. 2017. The geography of complex knowledge. Economic Geography 93 (1): 1–23. doi:https://doi.org/10.1080/00130095.2016.1205947.
- Boschma, R. 2014. Constructing regional advantage and smart specialization: Comparison of two European policy concepts. Scienze Regionali 1:51–68. doi:https://doi.org/10.3280/scre2014-001004.
- Boschma, R., Balland, P. A., and Kogler, D. F. 2015. Relatedness and technological change in cities: The rise and fall of technological knowledge in US metropolitan areas from 1981 to 2010. Industrial and Corporate Change 24 (1): 223–50. doi:https://doi.org/10.1093/icc/dtu012.
- Boschma, R., and Gianelle, C. 2014. Regional branching and smart specialization policy. S3 Policy Brief Series 06/2014. Luxembourg: Publications Office of the European Union
- Boschma, R., and Iammarino, S. 2009. Related variety, trade linkages, and regional growth in Italy. Economic Geography 85 (3): 289–311. doi:https://doi.org/10.1111/j.1944-8287.2009.01034.x.
- Boschma, R., Minondo, A., and Navarro, M. 2013. The emergence of new industries at the regional level in Spain: A proximity approach based on product relatedness. Economic Geography 89 (1): 29–51. doi:https://doi.org/10.1111/j.1944-8287.2012.01170.x.
- _____. 2017. Relatedness as driver of regional diversification: A research agenda. Regional Studies 51 (3): 351–64. doi:https://doi.org/10.1080/00343404.2016.1254767.
- Broekel, T. 2019. Using structural diversity to measure the complexity of technologies. PLoS ONE 14 (5): 10–15. doi:https://doi.org/10.1371/journal.pone.0216856.
- Caines, C., Hoffmann, F., and Kambourov, G. 2017. Complex-task biased technological change and the labor market. Review of Economic Dynamics 25:298–319. doi:https://doi.org/10.1016/j.red.2017.01.008.
- Capello, R., and Kroll, H. 2016. From theory to practice in smart specialization strategy: Emerging limits and possible future trajectories. European Planning Studies 24 (8): 1393–406. doi:https://doi.org/10.1080/09654313.2016.1156058.
- Cochrane, A., and Ward, K. 2012. Researching the geographies of policy mobility: Confronting the methodological challenges. Environment and Planning A 44 (1): 5–12. doi:https://doi.org/10.1068/a44176.
- Crescenzi, R., de Blasio, G., and Giua, M. 2020. Cohesion policy incentives for collaborative industrial research: Evaluating of a smart specialisation forerunner programme. Regional Studies 54 (10): 1341–53. doi:https://doi.org/10.1080/00343404.2018.1502422.
- Di Cataldo, M., Monastiriotis, V., and Rodríguez‐Pose, A. 2021. How “smart” are smart specialization strategies? Journal of Common Market Studies. doi:https://doi.org/10.1111/jcms.13156.
- Diodato, D., and Weterings, A. B. R. 2015. The resilience of regional labour markets to economic shocks: Exploring the role of interactions among firms and workers. Journal of Economic Geography 15 (4): 723–42. doi:https://doi.org/10.1093/jeg/lbu030.
- Essletzbichler, J. 2015. Relatedness, industrial branching and technological cohesion in US metropolitan areas. Regional Studies 49 (5): 752–66. doi:https://doi.org/10.1080/00343404.2013.806793.
- European Commission. 2021. Eye@RIS3—Smart specialization platform. S3platform.jrc.ec.europa.eu.https://s3platform.jrc.ec.europa.eu/map
- Eurostat. 2020. SBS Data by NUTS 2 Regions and NACE Rev. 2 (From 2008 Onwards). European Union. https://ec.europa.eu/eurostat/web/products-datasets/product?code=sbs_r_nuts06_r2.
- Fedeli, V., Lenzi, C., Briata, B., and Pedrazzini, L. 2020. EU regional and urban policy: Innovations and experiences from the 2014–2020 programming period. Cham, Switzerland: Springer International. doi:https://doi.org/10.1007/978-3-030-34575-4.
- Fitjar, R. D., Benneworth, P., and Asheim, B. T. 2019. Towards regional responsible research and innovation? Integrating RRI and RIS3 in European innovation policy. Science and Public Policy 46 (5): 772–83. doi:https://doi.org/10.1093/scipol/scz029.
- Fleming, L., and Sorenson, O. 2001. Technology as a complex adaptive system: Evidence from patent data. Research Policy 30 (7): 1019–39. doi:https://doi.org/10.1016/S0048-7333(00)00135-9.
- Foray, D. 2015. Smart specialization: Opportunities and challenges for regional innovation policy. 1st ed. Oxford: Routledge.
- Foray, D., David, P. A., and Hall, B. 2011. Smart specialization. From academic idea to political instrument, the surprising career of a concept and the difficulties involved in its implementation. MTEI Working Paper 2011-001. Switzerland: Management of Technology and Entrepreneurship Institute, École Polytechnique Féderale de Lausanne.
- _____. 2019. In response to “six critical questions about smart specialisation.” European Planning Studies 27 (10): 2066–78. doi:https://doi.org/10.1080/09654313.2019.1664037.
- Frenken, K. 2017. A complexity-theoretic perspective on innovation policy. Complexity, Governance and Networks 3 (1): 35–47. doi:https://doi.org/10.20377/cgn-41.
- Frenken, K., Van Oort, F., and Verburg, T. 2007. Related variety, unrelated variety and regional economic growth. Regional Studies 41 (5): 685–97. doi:https://doi.org/10.1080/00343400601120296.
- Gianelle, C., Guzzo, F., and Mieszkowski, K. 2019. Smart specialization: What gets lost in translation from concept to practice? Regional Studies 54 (10): 1377–88. doi:https://doi.org/10.1080/00343404.2019.1607970.
- Gómez Prieto, J., Demblans, A., and Palazuelos Martínez, M. 2019. Smart specialization in the world, an EU policy approach helping to discover innovation globally. JRC117005. Luxembourg: Publications Office of the European Union. doi: https://doi.org/10.2760/962643.
- Griniece, E., Panori, A., Kakderi, C., Komninos, A., and Reid, A. 2017a. Methodologies for smart specialization strategies: A view across the EU regions. In Proceedings of the 10th International Conference for Entrepreneurship, Innovation and Regional Development (ICEIRD 2017), ed. P. Ketikidis, and A. Solomon, 321–30. Thessaloniki, Greece.
- Griniece, E., Rivera León, L., Reid, A., Kominos, N., and Panori, A. 2017b. State of the art report on methodologies and online tools for smart specialization strategies. Report produced in the framework of Horizon 2020 project Online S3: ONLINE platform for smart specialization policy advice. http://www.onlines3.eu/wp-content/uploads/deliverables/ONLINES3_WP1_D_1_2_State_of_the_art_report_on_RIS3_methodologies.pdf.
- Hassink, R., and Gong, H. 2019. Six critical questions about smart specialization. European Planning Studies 27 (10): 2049–65. doi:https://doi.org/10.1080/09654313.2019.1650898.
- Hausmann, R., Hwang, J., and Rodrik, D. 2007. What you export matters. Journal of Economic Growth 12 (1): 1–25. doi:https://doi.org/10.1007/s10887-006-9009-4.
- Hidalgo, C. A., Balland, P. A., Boschma, R., Delgado, M., Feldman, M., Frenken, K., Glaeser, E., He, C., Kogler, D. F., Morrison, A., Neffke, F., Rigby, D., Stern, S., Zheng, S., and Zhu, S. 2018. The principle of relatedness. In Unifying themes in complex systems IX. ICCS 2018. Springer proceedings in complexity, ed. A. Morales., C. Gershenson., D. Braha., A. Minai, and Y. Bar-Yam, 451–57. New York: Springer. doi:https://doi.org/10.1007/978-3-319-96661-8_46.
- Hidalgo, C. A., and Hausmann, R. 2009. The building blocks of economic complexity. Proceedings of the National Academy of Sciences of the United States of America 106 (26): 10570–75. doi:https://doi.org/10.1073/pnas.0900943106.
- Hidalgo, C. A., Winger, A. B., Barabási, A. L., and Hausmann, R. 2007. The product space conditions the development of nations. Science 317 (5837): 482–87. doi:https://doi.org/10.1126/science.1144581.
- Hospers, G. J. 2006. Silicon somewhere? Assessing the usefulness of best practices in regional policy. Policy Studies 27 (1): 1–15. doi:https://doi.org/10.1080/01442870500499934.
- Iacobucci, D., and Guzzini, E. 2016. Relatedness and connectivity in technological domains: Missing links in S3 design and implementation. European Planning Studies 24 (8): 1511–26. doi:https://doi.org/10.1080/09654313.2016.1170108.
- Lo Turco, A., and Maggioni, D. 2020. The knowledge and skill content of production complexity. Research Policy 104059. doi:https://doi.org/10.1016/j.respol.2020.104059.
- Marques, P., and Morgan, K. 2018. The heroic assumptions of smart specialization: A sympathetic critique of regional innovation policy. In New avenues for regional innovation systems—Theoretical advances, empirical cases and policy lessons, ed. A. Isaksen., R. Martin, and M. Trippl, 275–93. New York: Springer International. doi:https://doi.org/10.1007/978-3-319-71661-9_14.
- Marrocu, E., Paci, R., Usai, S., and Rigby, D. 2020. Smart specialization strategy: Any relatedness between theory and practice? Working Paper CRENoS 2020/04. Cagliari, IT: Center for North South Economic Research.
- McCann, P., and Ortega-Argilés, R. 2015. Smart specialization, regional growth and applications to European Union cohesion policy. Regional Studies 49 (8): 1291–302. doi:https://doi.org/10.1080/00343404.2013.799769.
- _____. 2016. The early experience of smart specialization implementation in EU cohesion policy. European Planning Studies 24 (8): 1407–27. doi:https://doi.org/10.1080/09654313.2016.1166177.
- Mewes, L., and Broekel, T. 2020. Subsidized to change? The impact of R&D policy on regional technological diversification. Annals of Regional Science 65: 221–52. doi:https://doi.org/10.1007/s00168-020-00981-9.
- Midtkandal, I., and Rakhmatullin, R. 2014. The S3 platform peer review methodology. S3 Working Paper Series no. 02/2014. Luxembourg: Publications Office of the European Union. doi: https://doi.org/10.2791/34946.
- Morgan, K. 2015. Smart specialization: Opportunities and challenges for regional innovation policy. Regional Studies 49 (3): 480–82. doi:https://doi.org/10.1080/00343404.2015.1007572.
- Neffke, F., Henning, M., and Boschma, R. 2011. How do regions diversify over time? Industry relatedness and the development of new growth paths in regions. Economic Geography 87 (3): 237–65. doi:https://doi.org/10.1111/j.1944-8287.2011.01121.x.
- Rodríguez-Pose, A., and Wilkie, C. 2016. Institutions and the entrepreneurial discovery process for smart specialization. In Governing smart specialization, ed. D. Kyriakou, M. P. Martínez, I. Periáñez-Forte, and A. Rainoldi, 34–48. London: Routledge.
- Santoalha, A. 2019. New indicators of related diversification applied to smart specialization in European regions. Spatial Economic Analysis 14 (4): 404–24. doi:https://doi.org/10.1080/17421772.2019.1584328.
- Shipan, C. R., and Volden, C. 2008. The mechanisms of policy diffusion. American Journal of Political Science 52 (4): 840–57. doi:https://doi.org/10.1111/j.1540-5907.2008.00346.x.
- Sorenson, O., Rivkin, J. W., and Fleming, L. 2006. Complexity, networks and knowledge flow. Research Policy 35 (7): 994–1017. doi:https://doi.org/10.1016/j.respol.2006.05.002.
- Tödtling, F., and Trippl, M. 2005. One size fits all? Towards a differentiated regional innovation policy approach. Research Policy 34 (8): 1203–19. doi:https://doi.org/10.1016/j.respol.2005.01.018.
- Van Eck, N. J., and Waltman, L. 2009. How to normalize co-occurrence data? An analysis of some well-known similarity measures. Journal of the American Society for Information Science and Technology 60 (8): 1635–51. doi:https://doi.org/10.1002/asi.21075.
- Whittle, A. 2020. Operationalizing the knowledge space: Theory, methods and insights for smart specialization. Regional Studies, Regional Science 7 (1): 27–34. doi:https://doi.org/10.1080/21681376.2019.1703795.
- Wu, X., Ramesh, M., and Howlett, M. 2015. Policy capacity: A conceptual framework for understanding policy competences and capabilities. Policy and Society 34 (3–4): 165–71. doi:https://doi.org/10.1016/j.polsoc.2015.09.001.
Appendix
Table A1 Descriptive Statistics
Table A2 Unconditional Choice Models with Coefficients
Table A3 Conditional Choice Models with Coefficients