
abstract
We conduct an analysis of cross-border financial sector mergers and acquisitions (M&As) between 2000 and 2017 to explore the changing landscape of international financial centers (IFCs) and the spatial concentration of decision-making power in the Global Financial Network (GFN). Our analysis starts with time zones, showing a slow rise of IFCs in the Asia-Pacific, decline in Europe, the Middle East, and Africa, and resilience in the Americas. We then identify which IFCs are net targets and net acquirers in M&As before and after the global financial crisis as well as which IFCs switch position between net target and net acquirer. Homing in on key groups of IFCs in the GFN, we show the persistent high profile of the New York and London axis of global finance, the important roles of Singapore and Hong Kong as mid-shore IFCs in Asia, and the continued significance of Gulf and offshore IFCs. These findings not only showcase M&A data as valuable analytical tools in exploring the geographies of finance but address a persistent theoretical gap concerning how power moves, concentrates, and is exercised as part of the GFN.
Defined as cities with concentrations of financial firms, which engage in cross-border deals (Cassis Citation2010), international financial centers (IFCs) perform key functions in the world economy and are at the heart of the Global Financial Network (GFN). The GFN refers to a conceptual framework first developed by Coe, Lai, and Wójcik (Citation2014), which maps the global financial sector through the interlocking structures and agencies of financial centers, offshore jurisdictions, financial and business services, and world governments (Haberly and Wójcik Citation2021). The GFN helps us understand the relational ties between the actors and places that coconstitute the geographies of the financial sector, providing a framework to investigate the landscape of IFCs.
IFCs perform key decision-making functions in the global economy, but their status is not unconditional nor are their geographies fixed. While relational approaches are central to understanding how IFCs compete, adapt, and coevolve with one another (Derudder, Hoyler, and Taylor Citation2011; Lai et al. Citation2020), missing from this field is a clear understanding of where power is, how it moves between financial centers and why. A preoccupation with analyzing and comparing the attributes of IFCs has resulted in impoverished understandings of the actual mediums through which connectivity is cultivated in financial networks and the uneven power relations that emerge as a result. As there is always some degree of shift in decision-making power between acquirer and target companies (Zademach and Rodríguez-Pose Citation2009), mergers and acquisitions (M&As) present a novel analytical lens through which we can address this persistent theoretical gap in the literature.
Drawing from a sample of 5,357 cross-border deals, each valued at over US$10 million, we conduct an analysis of financial sector M&As between 2000 and 2017. We start by analyzing trends in M&A activity across time zones, before identifying which IFCs are net targets and net acquirers, and how these positions change following the financial crisis. This is supported by the development of IFC M&A profile statements, which indicate the number and value of cross-border acquisitions and targets for selected cities as well as their percentage share in the global M&A market.
In the broadest sense, we reveal a decline in both the number and value of cross-border financial M&A deals following the financial crisis. Importantly, this decline is geographically uneven. Through the analysis of time zones we reveal the weakening of Europe, the Middle East, and Africa (EMEA), the resilience of the Americas, and the growth of Asia-Pacific. Homing in on key axes of influence in the GFN, our findings highlight the persistent high profile of New York and London (NY-LON), the importance of Hong Kong and Singapore as midshore IFCs (Haberly and Wójcik Citation2021), and the continued significance of Middle Eastern and offshore IFCs in the GFN.
These findings allow us to make a novel theoretical contribution surrounding the uneven power geometries of the GFN. Above and beyond providing fresh empirical insights into the changing landscape of IFCs in the twenty-first century, M&A analysis allows us to reveal how power moves, concentrates, and is exercised throughout financial networks. Our findings identify which cities coordinate financial networks (net acquirers), which cities are enrolled into them (net targets), and which cities are overlooked entirely. Far from a few dominant cities controlling the rest, or acquirer centers growing at the expense of target centers, our findings expose the symbiotic nature of financial center development, as power is mutually exercised between interdependent financial centers. This allows us to move away from inherently competitive and hierarchical interpretations of IFCs and present a more nuanced and fluid conceptualization of power as part of the GFN.
The remainder of this article is structured as follows. The next section presents a critical review of the literature on the GFN and cross-border M&As. This is followed by a section that outlines the data and methodology. The fourth section analyzes net acquisitions and targets by time zones before being followed by a section that highlights the top net acquirers, net targets, and switchers between these positions. The following sections focus on NY-LON, Singapore and Hong Kong, and the Middle Eastern and offshore IFCs in the GFN. Conclusions are reached in the ninth section where we elaborate further on the GFN and cross-border M&A analysis as important ways of understanding the geography of global finance.
The Role of M&As in the Changing Landscape of IFCs
The GFN conceptual framework identifies the actors, places, and networks that underpin the global financial system (Haberly and Wójcik Citation2021). Developed first by Coe, Lai, and Wójcik (Citation2014) as a way of integrating financial geography into the study of global production networks, the framework conceptualizes the multiscalar forms of agency and structure that constitute the spatial interconnectedness of financial centers, actors, and instruments. Drawing from an interdisciplinary body of ideas, the GFN outlines the economic, political, and social linkages of global finance through four key building blocks: financial centers, offshore jurisdictions, financial and advanced business services, and world governments.
Integral to our analysis, financial centers are cities that host agglomerations of financial firms, markets, and institutions, acting as key nodes of decision-making power in the GFN (Cassis Citation2018). Offshore jurisdictions, sometimes more narrowly defined as offshore financial centers or tax havens, are specialized territories that provide regulatory freedom to bypass legal constraints in the home countries of financial firms and assets (Wójcik Citation2013). Financial and Advanced Business Services (FABS) are firms operating in the finance, insurance, real estate, and business consultancy sectors. Seen as the master weavers of the GFN, they connect the actors and places of the GFN through cross-border financial transactions and flows of talent, money, and ideas (Haberly and Wójcik Citation2021). Finally, world governments refer to both national and supranational state authorities, including the governments of economic and political superpowers and leading central banks, which create and govern the formal institutional structures of global finance, enforce regulations, and provide sovereign protection to the monetary system.
When combined with M&A analysis, the GFN provides a powerful framework for exploring the relational ties of financial centers through a focus on connectivity, complementarity, and functionality, moving away from an overt focus on competition and top-down hierarchical structures that preoccupy much of the world city research (Jones Citation2002; Allen Citation2010). Importantly, no studies have applied the GFN with cross-border M&As to investigate the changing landscape of IFCs. This is a significant omission given that M&As play a central role in constituting the global and networked characteristics of the GFN. At the moment, research on IFCs focuses on their attributes (Global Financial Centers Index), connections as part of office networks (Globalization and World Cities), links through collaborative deals among financial firms (Bassens et al. Citation2021), and offshore finance (Haberly and Wójcik Citation2021). Given the preponderance of M&As over greenfield investments in the financial sector, they are a major yet overlooked mode of development for IFCs that stimulate growth, forge connections between IFCs, and bring together the four building blocks of the GFN.
Cross-border M&As are therefore central to the expansion and internationalization of FABS (Focarelli and Pozzolo Citation2008). Under contemporary globalization and financialization, they allow firms to grow their market share, capture financial synergies, optimize the allocation of resources, access new knowledge, and generate shareholder value (Rompotis Citation2015). This can lead to changes in both the acquirer and target city in terms of where assets, personnel, and control functions might be located and spatially reorganized (Green Citation2018). M&As provide a mechanism for IFCs to enrich the breadth and depth of their financial sector (as either target or acquirer) through accessing new markets, skills, and investment, subsequently bringing them closer to other groups of IFCs in the GFN.
M&As can be categorized as horizontal, vertical, or conglomerate (Motis Citation2007; Green Citation2018). Horizontal mergers occur when both companies operate in the same industry and market; vertical mergers refer to one company buying another in the same supply chain or production process (e.g., a manufacturer acquiring a distributor); conglomerate mergers involve companies operating in entirely different industries or sectors (Green Citation2018).
M&As can be driven by a wide range of motivations, typically classified as market, efficiency, and technology seeking (Motis Citation2007). Let us consider what M&As imply for the displacement of decision-making power in the financial sector. In all cases there is some degree of shift in corporate control and decision-making power (Zademach and Rodríguez-Pose Citation2009). Considering IFCs, power can shift from centers hosting the headquarters of target companies to those hosting the headquarters of acquiring companies. However, this depends on both the type and motivation behind the M&A deal. Market-seeking deals occur when companies want to either access new markets or grow existing market share (Lee Citation2017). The shift of power here depends on the relative size and significance of the market being sought (Green Citation2018). In efficiency-seeking deals, when the primary motivation is cost savings (Lee Citation2017), power is most likely to shift to the acquirer, since it would be unlikely for back- and midoffice functions to play a leading role in the governance of the merged company (Hashimoto and Wójcik Citation2020). Technology-seeking deals allow companies to obtain resources to bolster innovation, with evidence showing that companies often acquire firms to mitigate the risks attached to internally produced technology (Lee Citation2017). Here, the target may retain power and even a degree of independence, but it depends on the centrality of the technology to the merged company and the size of the target.
Upon acknowledging these distinctions, we can consider what it means for an IFC to be a net acquirer or net target, based on the balance of acquisitions and targets headquartered in that IFC. Net acquirers typically gain power and consolidate their position in the GFN. FABS firms in these cities have the resources to acquire foreign firms and shape the spatial connections of the GFN. However, this is not guaranteed, since deals can go wrong for a myriad of reasons. This is most evident in M&A deals driven by manager hubris and empire building, reflecting the principal agent problem (Jensen and Meckling Citation1976). Given that power is sticky in the GFN and that the landscape of IFCs is characterized by inertia (Cassis Citation2018), net acquirers are likely to be IFCs with the most sophisticated FABS complex such as New York, London, Hong Kong, and Singapore (Meyer Citation2015; Haberly and Wójcik Citation2021).
The position of a net target is even more complicated. These IFCs might lose independence through M&As, although the degree of loss depends on circumstances and the type of deal. Being a net target among competitors could therefore be seen as a weakness but in other circumstances may also be a sign of strength, since it means the city is an attractive location to do business. For IFCs in developing and emerging markets, being a net target brings several benefits, since foreign institutions buying local firms will increase inward investment and present opportunities to develop the financial ecosystem (Hendrikse, van Meeteren, and Bassens Citation2020), though again such outcomes are not guaranteed. Given the spatial distribution of mid- to back-office functions in global finance, as well as the growing importance of financial technology (FinTech), the geography of net targets is likely to be extensive and diverse.
These distinctions, framed through the GFN, help us move away from a narrow, deterministic, and hierarchical understanding of the global financial sector, whereby a small number of leading cities dominate the rest of the world (Jones Citation2002). Rather than there being a zero-sum game with some cities dominating others, our approach relies on conceptualizing power as “a medium that enables cities to hold networks together and bridge connections” (Allen Citation2010, 2895). Net acquirers do not control or subjugate net targets, but rather have the resources to shape and coordinate the spatial connections of the GFN. In this sense, they manage the GFN and “exercise power with rather than over others,” developing key axes of influence that are reproduced through M&As and other cross-border connections (Allen Citation2010, 2895). In light of the above, and appreciating the nuanced, contingent, and context-specific nature of M&As and their implications, it is important to consider the gross and net number and value of deals in our analysis. Interpreted through the GFN, this will provide novel insight into the functions, positions, relational ties, and geographies of IFCs.
Methodology
We analyze all cross-border M&A deals valued at or above US$10 million (in 2010 prices) involving financial services and insurance firms (North American Industry Classification System 52) on both sides of the transaction during the period 2000–17. This covers banks, insurance firms, and other financial institutions, such as brokers and asset managers, but excludes private equity and real estate companies. Cross-border deals constitute international activity and translate directly into the international position of IFCs, which cannot be said of domestic transactions. This helps us be more precise in our focus on IFCs and the spatial structures of the GFN. The data covers a total of 5,357 deals, and was collected using Dealogic, a preeminent proprietary source of M&A and other financial data. Sourcing data from Dealogic was complemented with a painstaking process of geocoding, which involved locating the headquarters of both target and acquirer firms, using data from Bureau van Dijk OrbisFootnote1 alongside corporate websites. Manual geocoding was necessary, and this meant placing a minimum threshold of US$10 million on deals was necessary, as a larger sample would have made geocoding an impossibly large task. While this means that our analysis excludes smaller deals and could miss transactions involving small and medium-sized enterprises and emerging FinTech firms, it supports our theoretical priority concerning the movement of power throughout the GFN. M&A deals valued at or above this threshold reflect substantial shifts in corporate control and the spatial distribution of economic decision-making power. This means that our analysis exclusively captures notable changes to the concentration of decision-making power in the GFN.
Once all transactions were geocoded, we began analyzing the data at the city level. This meant calculating the net positions of each IFC based on comparing the total number and value of the IFCs' acquisitions and targets. This enabled us to develop an understanding of which IFCs were coordinating networks, being enrolled into them and being excluded entirely. With each city assigned to a country, continent, and time zone, we could then combine the net positions of IFCs to work out the status of wider geographic contexts.
In order to demonstrate changes over time, this process was repeated over two time periods: 2000–8 and 2009–17. Splitting the time series in this way provides symmetry around the global financial crisis, by far the most important event in the period (Cassis and Wójcik Citation2018), enabling us to inquire whether, and in what ways, the financial crisis has catalyzed a geographic shift in the global financial sector (Aalbers Citation2009; Derudder, Hoyler, and Taylor Citation2011).
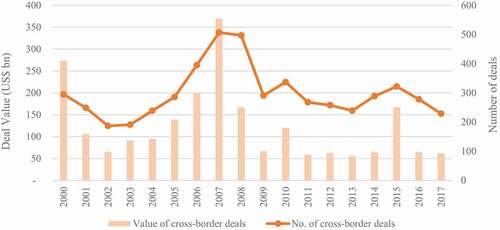
With 5,357 cross-border M&As valued at US$2.226 trillion, the average deal value for the period was over US$400 million. As shows, the number of deals is similar between the two periods (2,846 and 2,511). The total value of deals, however, halved in the second period, down from approximately US$1.5 trillion to US$720 billion. This resulted in a much smaller average deal size, down from approximately US$527 million in 2000–8 to US$286 million in 2009–17. This stagnation in the number and decline in the value of cross-border M&A deals may be attributed to a slowdown in financial globalization emanating from the financial crisis and emerging economic nationalism. Falling deal value may also be a result of the lower valuations of banks and other financial firms following the crisis.
Figure 1. Global cross-border M&A deal count and value (2000–17).
Acquisitions and Targets by Time Zone
Our analysis begins with the global scale and then focuses on specific groups of IFCs. This helps identify macrolevel trends in the GFN, which provide context for microlevel changes over time. A suitable means of analyzing these macrolevel trends is through three regional time zones: Europe, the Middle East, and Africa (EMEA); the Americas; and Asia-Pacific. This is the most popular macrolevel regionalization used by the financial sector itself, with each time zone representing approximately one-third of the world’s gross domestic product.
identify the number and value of cross-border financial sector M&As within and across time zones. Importantly, these figures show us that whether we focus on number or value, the message is consistent. While value is important and reflects the size of M&A deals, prioritizing the number of deals ensures that geographic trends, which we are trying to uncover here, are not overinfluenced by large one-off deals with high values. Slight differences in net number and net value scores are inevitable; however, these variables rarely tell contradictory stories.
Figure 2. Number of cross-border financial sector M&As within and across time zones (2000–17).
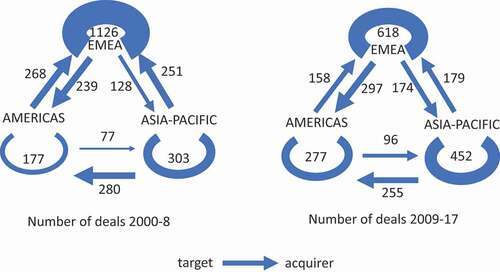
Figure 3. Value of cross-border financial sector M&As within and across time zones (2000–17).
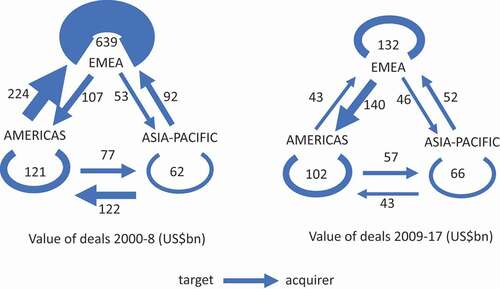
Results show the shrinking role of EMEA, in particular in Europe, with less intrazone activity and a shift from the position of main acquirer to main target. Intrazone deals within EMEA made up 40 percent of the global total before the financial crisis but only 25 percent afterward. Across time zones, EMEA experienced a net position of +152 deals and +US$156 billion in value precrisis, compared with a net position of −134 deals and −US$91 billion in value postcrisis. In relative terms and across time zones, EMEA acquisitions accounted for 18 percent of all deals before the crisis and only 13 percent after the crisis.
This can be explained through several factors. First, high rates of intrazone M&As in EMEA during the precrisis period were driven by processes of European financial market integration, starting with EU directives in the 1980s and accelerated by the introduction of the euro. Second, the repeal of the Glass-Steagall Act and wider deregulation of US finance opened up the US market for acquisition by EMEA financial firms. Germany’s Deutsche Bank’s acquisition of New York–based Bankers Trust in 1998, set a trend that saw European banks buying a foothold in US investment banking as well as mortgage credit companies (Aalbers Citation2009). Another notable example of trans-Atlantic transactions was Credit Suisse’s acquisition of DLJ, while the Royal Bank of Scotland’s acquisition of the Dutch ABN Amro marked the largest intra-European deal. The financial crisis halted and reversed this trend, as postcrisis deals by EMEA companies became fewer in number and smaller in value. The US subprime crisis, and the subsequent eurozone crisis, reduced opportunities for already highly leveraged European financial firms to expand, simultaneously making them more vulnerable to acquisition as a result of lower valuations (Erel, Liao, and Weisbach Citation2012).
In the Americas, intrazone activity increased by number (+100) and declined slightly in value (−US$19 billion) following the financial crisis. As a share of the global total, intrazone deals in the Americas nearly doubled from 6 percent to 11 percent following the crisis. Across time zones, acquisitions by the Americas accounted for 18 percent of all deals before the crisis and 22 percent afterward. Most striking for the Americas, however, is the reversal in relations with EMEA. The Americas experienced a net position of −29 deals with EMEA precrisis, compared to +139 deals postcrisis. This resilience of the Americas emanates from a much quicker recovery from the crisis. While European finance was mired by the eurozone crisis, US financial firms began to take advantage of buying opportunities, and many Canadian banks, relatively unscathed by the crisis, were acquiring firms in the US. This change in role is perhaps best exemplified by Blackrock’s acquisition of BGI a deal that paved the way for Blackrock becoming the largest asset manager in the world (Haberly et al. Citation2019).
Asia-Pacific stands out by experiencing more growth than EMEA and the Americas in the postcrisis period. Internally, intrazone deals rose from 11 percent of the global total to 18 percent following the financial crisis, although average deal values were smaller than in the other time zones. Externally, and across time zones, Asia-Pacific experienced a net position of −326 deals and −US$84 billion in value precrisis, compared with −164 deals and +US$8 billion in value postcrisis. It grew its share of acquisition across time zones from 7 percent of the global total before the crisis to 11 percent afterward. This relative growth can also be explained by a smaller impact of the financial crisis. Financial institutions across the region, which had learned lessons from the 1997 Asian financial crisis, had developed resilience through addressing previous vulnerabilities and ensuring stronger balance sheets, including lower leverage (Keat Citation2009). They also benefited from being less connected to the core of the GFN and therefore further away from the epicenter of the crisis. This stronger position, alongside faster real economic growth in the region, bolstered confidence and made Asian financial firms more confident and outward looking in their acquisitions. Among other things, this helps explain why Asia-Pacific (US$103 billion) acquired more than EMEA (US$95 billion) in terms of value across time zones after the crisis.
Analyzing IFCs Based on Cross-border M&As
reveal the top twenty IFCs that were net acquirers in both 2008–8 and 2009–17, and the top twenty that were net targets in both periods. This is complemented by , presenting the top twenty IFCs switching between a net acquirer and net target position. These tables and figures are based on the number of deals but also include the net value position of each IFC.
Table 1 Consistent Net Acquirers Pre- and Postcrisis (Top Twenty by Net Number)
Table 2 Consistent Net Targets Pre- and Postcrisis (Top Twenty by Net Number)
Table 3 Switchers from Net Acquirer to Net Target (Top Ten by Net Change)
Table 4 Switchers from Net Target to Net Acquirer (Top Ten by Net Change)
shows us that net acquirers are linked to powerful world governments in the GFN. It shows that the historically preeminent (New York, Paris, London) and a growing number of newer IFCs (Singapore, Toronto, Washington) play leading roles in acquiring financial firms and shaping the spatial connections of the GFN. Perhaps the only surprise here is the presence of Munich rather than Frankfurt. This goes against the perceived wisdom of Frankfurt as one of Europe’s leading IFCs and highlights the success of Munich in attracting some of the world’s leading insurance firms (Zademach and Musil Citation2012). With the exception of Singapore, the Middle Eastern and offshore IFCs, which will be analyzed in “The Contrasting Profiles of Hong Kong and Singapore” and “Emerging Centers in the GFN,” all of the top twenty net acquirers are located in North America and Western Europe. This underscores the stickiness of power in the GFN, where established IFCs and the connections between them endure over time.
However, this historic durability to the core of the GFN does not suggest that change is impossible. reveals the significant impact of the financial crisis in reshaping the geographies of acquisitions. While deals from North American (40 percent) and European (33 percent) IFCs constitute the majority of net acquisitions in the top twenty, there is a much sharper decline in European acquisitions following the crisis. European IFCs experienced a 49 percent decline in net acquisitions postcrisis (403 to 208), whereas North American IFCs experienced a 7 percent rise (369 to 394). also highlights some inconsistencies in terms of value. While the majority of leading acquirers have positive balances, London (−US$14 billion and −US$46 billion) and Amsterdam (−US$75 billion and −US$3 billion) lose value across both periods. This negative balance for value suggests that some of the leading and most valuable FABS firms in these cities have been acquired from elsewhere and that some degree of decision-making power will have been lost.
shows that IFCs in emerging and developing markets are the largest net targets. With the exception of several Western European IFCs, including Dublin and Milan, which were severely impacted by the financial and eurozone crises (Donovan and Murphy Citation2013; Bull Citation2018), large net targets are found mostly in Asia, Latin America, and Eastern Europe. Trends in both the number and value of deals are consistent here, with Milan the only IFC with a positive balance in terms of value throughout the period. While “Acquisitions and Targets by Time Zone” explained the postcrisis growth of Asia-Pacific, the region remains the largest net target across the period, accounting for 49 percent of all net deals in the top twenty. Importantly, and as can be explained through India and China, the breadth and diversity of the geography of net targets results from differences in the types of M&As being undertaken.
Efficiency- and technology-seeking M&As are central to the net target status of Indian IFCs. Some of the largest net targets are located in India, with Mumbai, Chennai, and New Delhi all in the top twenty. India is an attractive location for efficiency-seeking M&As, since foreign firms are drawn to the availability of cheap and skilled labor to develop back- and midoffice financial services functions (Hashimoto and Wójcik Citation2020). Equally prevalent in India are technology-seeking M&As, which are underpinned by the growing strength of its technology sector. Bengaluru provides a pertinent example here, since it increased its net target position throughout the period due to the agglomeration and development of world-class information technology and knowledge-intensive firms in the city (Nisbett Citation2009). This underscores the importance of FinTech in shaping the emerging geographies of finance (Hendrikse, van Meeteren, and Bassens Citation2020).
In contrast, the consistent net target status of China’s largest IFCs, Shanghai and Beijing, can be understood as a result of market-seeking M&As. As explained by Pan et al. (Citation2018), Chinese financial institutions have expanded internationally, mainly by creating branches and subsidiaries abroad as opposed to acquiring foreign firms. Acquisitions have proven difficult, and, in many cases, have been blocked for political reasons. In this sense, M&A data may underestimate the overall international expansion of Chinese financial firms. Nevertheless, the net target position of its leading IFCs confirms the growing size and sophistication of Chinese financial markets. As a result, China is becoming increasingly open to market-seeking M&As as a key mechanism of internationalization (Lai Citation2012). With Hong Kong acting as a key broker (Martinus et al. Citation2019), as elaborated in “The Contrasting Profiles of Hong Kong and Singapore,” China’s net target status reflects a growing willingness for state and nonstate actors to become more closely aligned and integrated with the GFN (Haberly and Wójcik Citation2021). Ultimately, while net targets are mostly located in emerging and developing markets, this should not be mistaken for a homogenous and subordinate financial landscape. Remaining sensitive to the contingent nature of M&As, the geography of net targets remains rich and uneven because of the breadth of financial sectors being enrolled into the GFN and the diversity of different types of M&A deals being undertaken.
Finally, we can identify which IFCs switched between net acquirer and net target positions following the financial crisis. outlines the top ten IFCs that moved from net acquirer to net target, and outlines the top ten IFCs that moved from net target to net acquirer. IFCs are positioned in terms of the net change in the number of deals, with value also shown.
provides deeper insight into the changing fortunes of European IFCs following the financial crisis. While Vienna’s expansive precrisis position reflects acquisitions in Central and Eastern Europe in a drive to develop a regional financial center (Zademach and Musil Citation2012), the experience of Reykjavik can be explained through the excessive risk-taking and bankruptcy of its largest financial institutions (Kaupthing, Glitnir, Landsbanki), leading to the collapse of the Icelandic financial system (Nielsson and Torfason Citation2012). Athens switching position reflects the broader national experience, since Greece was the most badly affected economy during the eurozone crisis (Palaskas et al. Citation2015). Edinburgh’s decline is tied closely to the bail out of the Royal Bank of Scotland (Marshall Citation2013). Interestingly, we see Sydney and Melbourne switching in the same way, reflecting the growth and spatial expansion of nearby Asian IFCs. As to be expected, nearly all IFCs in experience a change in value from a positive to a negative balance, with the biggest shifts occurring in Madrid and Sydney.
underscores the growing role of Asia in terms of net acquisitions. Most notable has been the change in East Asian IFCs, with Tokyo, Taipei, and Tainan seeing some of the biggest shifts from net target to net acquirer. The most dramatic is in terms of Tokyo’s net value, moving from −US$61 billion to +US$63 billion. Substantial growth in these cities occurred because Japan and Taiwan were affected less than most other economies by the 2008 financial crisis. Scarred by earlier regional financial crises in 1991 and 1997–8, Japanese and Taiwanese firms benefited from being less leveraged and holding ample capital that could be deployed when opportunities arose after 2008, exemplified by Nomura acquiring the Asian operations of Lehman Brothers (Wójcik et al. Citation2018). In this sense, being further away from the core of the GFN and the epicenter of the financial crisis served these IFCs well.
Similarly, the changing position of Oslo can be explained by the Norwegian banking crisis in 1987–93. Tighter regulations and closer scrutiny of the financial sector limited the exposure of Norwegian financial firms to the US subprime markets (Juel Citation2011). This presented opportunities for growth after the 2008 financial crisis, since firms in neighboring IFCs were devalued. It allowed Oslo to expand and consolidate its regional position, with 87 percent of acquisitions in Europe and 29 percent in Scandinavia (Copenhagen and Stockholm).
In stark contrast to Madrid experiencing a substantive postcrisis decline in net acquisitions (+10 to −30), Barcelona moved in the opposite direction (−1 to +20). This trend was consistent in terms of value, with Madrid moving to a negative balance (+US$60 billion to −US$5 billion) and Barcelona increasing its positive balance (US$0.4 billion to +US$8 billion). This highlights the importance of analyzing the geographies of finance at the city level and reveals an unevenness in the experiences of the Spanish financial sector in the wake of the 2008 financial crisis.
Overall, the number of IFCs switching between net acquirer and net target remained very low throughout the period. This reflects inertia in the GFN, whereby existing geographic trends are not easily disrupted (Cassis and Wójcik Citation2018; Meyer Citation2020), a finding that will be revisited in “Conclusions.”
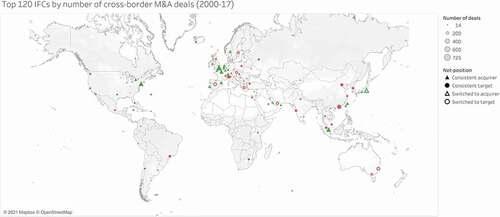
In overview, presents a map of the top 120 IFCs by the total number of M&A deals between 2000 and 2017, distinguishing between the four types of centers, as discussed earlier in this section. With the notable exceptions of Tokyo and Singapore, IFCs with the largest number of deals and consistent net acquirer positions are mostly located in North America and Western Europe. While we see growth in Asia-Pacific in terms of the number of deals, the prevalence of net targets is clear. also shows very little M&A activity across Africa. Aside from the emergence of Cairo, Casablanca, Johannesburg, and Nairobi as net targets, alongside Cape Town as the sole net acquirer, this finding reflects the low level of financial market integration between Africa and the rest of the world as well as within Africa.
Figure 4. Top 120 IFCs by number of cross-border M&A deals (2000–17).
The Persistent High Profile of NY-LON
Cross-border M&A data provides novel insight into the special relationship between NY-LON. The NY-LON axis has been at the center of the GFN for nearly a century, with both cities existing as key nodes in the global financial sector through the quality of their financial infrastructure, sophistication of their FABS firms, and deeply interwoven affiliations with leading world governments (Haberly and Wójcik Citation2021). As the driving force behind light touch financial regulation (French, Leyshon, and Thrift Citation2009), the fusion of NY-LON has been underpinned by “commonality, complementarity and connectivity,” with similarities in political economic, institutional, and regulatory conditions supporting the coevolution of both centers (Wójcik Citation2013, 2747). Their interconnected physical and digital infrastructures (Warf Citation2006) have supported transnational flows of capital, labor, and knowledge, which have strengthened their interdependencies as IFCs (Castells Citation2000). M&A data help reveal more about the nature and position of this axis in the GFN, with providing profile statements for both cities.
Table 5 New York Profile
Table 6 London Profile
While New York experienced a slight decline in net acquisitions following the financial crisis (+124 to +117), its share of global deals increased (7 percent to 8 percent). This was matched by significant postcrisis growth in net value, up from −US$27 billion to US$14 billion. Geographically, New York’s financial firms were acquiring and being acquired by companies all over the world. While this geographic diversity reflects its global influence, there were strong connections to the UK (15 percent of acquisitions) and Japan (12 percent). While the market for corporate control is not a zero-sum game in a broader economic or political sense, arithmetically it is. As New York has grown its share in both the total number and value of cross-border deals throughout the period, this confirms that New York has enhanced its position of influence in the GFN (Wójcik Citation2013).
The success of London as a leading IFC is often attributed to the Wimbledon effect. This analogy alludes that London’s financial sector mirrors the Wimbledon Tennis Championship in that both are globally renowned, yet neither exhibit strong domestic success stories. For M&As, as shown by , the Wimbledon analogy holds up in terms of the number of deals but less so in terms of value. While home to the biggest shots, London is also a home to hundreds of smaller financial firms that remain better at buying foreign firms than being bought. While this is evidenced by London’s postcrisis growth in the global share of acquisitions, from 8 percent to 9 percent, it also explains why average deal values decline over the same period. This vibrancy of small firms reflects the depth of London’s financial center ecosystem (Hendrikse, van Meeteren, and Bassens Citation2020), an attribute that becomes even clearer when observing the geography of deals. London is global in scope, buying and selling in all parts of the world, but it is also highly US oriented, with 14 percent of its acquisitions coming from the US.
While this data supports London’s position as a leading IFC, there are signs of its global influence weakening over time. This is evidenced by a postcrisis decline in net acquisitions (+97 to +16) and a growing negative balance in terms of net value (−US$14 billion to −US$46 billion). Unlike New York, which grew its influence, this net loss in value suggests that London is moving in the opposite direction. A gradual decline in London’s ability to shape cross-border connections can be explained by the global financial crisis and the slowdown in M&A activity but may also reflect the emerging impacts of Brexit, which are yet to be properly felt (Cassis and Wójcik Citation2018; Hall and Wójcik Citation2021). While far from conclusive, these growing signs of decline could suggest that Brexit is starting to disrupt the centralization of European finance and undermine the dominance of London (Dörry and Dymski Citation2021).
Overall, and as expected, our results confirm the leading role of the NY-LON axis in the GFN (Wójcik Citation2013). London (727) and New York (525) were the top two IFCs in terms of the total number of M&A deals, with New York second in terms of net acquisitions and London seventh. NY-LON was also the most active city pair throughout the period, with sixty-one deals made up of forty-two acquisitions from New York and nineteen acquisitions from London. M&As are often seen, and rightly so, as a mechanism of competition. Findings here, however, call us to modify this assumption, since M&As have clearly supported a close partnership thta has helped maintain their position at the center of the GFN. Considering that the 2008 financial crisis is understood as originating from New York and London (French, Leyshon, and Thrift Citation2009), both cities have remained largely unscathed by the crisis in their capacity as IFCs. Echoing earlier analysis, this finding underscores the stickiness of power in the GFN (Haberly and Wójcik Citation2021).
The Contrasting Profiles of Hong Kong and Singapore
Hong Kong and Singapore feature prominently in the financial geography literature and are widely accepted as the two leading IFCs in Asia (Meyer Citation2015). Playing host to the regional headquarters of the world’s largest financial institutions, both cities are seen as integral to the GFN through functioning as midshore IFCs that act as key gateways for European and American firms accessing Asian markets (Meyer Citation2015; Lai et al. Citation2020). Midshore refers to their capacity as smaller states to combine functions attributed to offshore and onshore jurisdictions, for example, greater regulatory flexibility and lower taxation alongside globally recognized and transparent legal frameworks (Haberly and Wójcik Citation2021). Important here is the concept of brokerage, wherein smaller states can perform functional roles for bigger states as intermediaries that control access to flows of trade, investment, and knowledge (Martinus et al. Citation2019). Our M&A data highlights the importance of Hong Kong and Singapore to the GFN through performing these functions but also suggests that their roles might be changing. provide the M&A profile statements for Hong Kong and Singapore.
Table 7 Hong Kong Profile
Table 8 Singapore Profile
Conspicuous by its absence so far has been Hong Kong in cross-border M&As. Hong Kong has a negative balance in both the number (−26) and value (−US$35 billion) of cross-border deals throughout the period. While the pace of this deficit slowed following the 2008 financial crisis, its share of global acquisitions declined slightly, with its share of targets increasing. Put simply, Hong Kong is a consistent net target. This is an important finding, considering the oft-assumed primacy of Hong Kong as the leading IFC in Asia (Meyer Citation2015).
On the one hand, Hong Kong’s position as a net target suggests the weakening of its FABS firms in terms of their ability to acquire foreign competitors. This points to declining global influence in terms of shaping the connections of the GFN. On the other hand, it suggests that Hong Kong remains an attractive place to do business despite the growing social unrest, gradual deterioration in the rule of law, and weakening of democratic values (Lui, Rowley, and Oh Citation2020). Often understood as China’s window to global capital (Meyer Citation2020), our data confirms Hong Kong’s role as a bridge to China, which mediates access to the domestic market (Martinus et al. Citation2019). However, Hong Kong functions as part of an interconnected network of Chinese IFCs (Beijing, Shanghai, Shenzhen) that complement each other by serving distinctive financial markets (Lai Citation2012). While these interactions are seen as complementary, rather than competitive (Lai et al. Citation2020), growth in M&A activity across these cities in mainland China highlights their aspirations to adopt more of an international role and become less reliant on Hong Kong for overseas expansion (Lai et al. Citation2020). Hong Kong’s gateway function and special status as the Berlin of the East may therefore be changing as Chinese IFCs become more open, accessible, and integrated as part of the GFN through market-seeking M&As (Lui, Rowley, and Oh Citation2020). Hong Kong is therefore becoming more closely connected with China but more as a gateway into the country rather than a gateway out of it.
This is consistent with trends in the M&A data. Hong Kong and Beijing were the second most active city pair behind NY-LON, with twenty-nine acquisitions from Hong Kong and twenty-four from Beijing. Moreover, 42 percent of Hong Kong’s acquisitions came from China, compared to only 13 percent of Singapore’s. This deepening relationship with China, combined with a decline in foreign investment due to geopolitical tensions over financial sovereignty, may further transform the nature of Hong Kong’s role as a broker of deals to China (Martinus et al. Citation2019).
In contrast, helps us understand the growing influence of Singapore in the GFN. In terms of acquisitions, Singapore has become the world leader, experiencing a 45 percent growth in net acquisitions following the financial crisis, even though net value declined by 31 percent in line with the global postcrisis slowdown in M&A activity. In terms of the geography of these deals, Singaporean firms acquired targets from all over the world, but there was a clear focus on Asia (219 deals, 57 percent) and more specifically China (52 deals, 14 percent). When compared with Hong Kong, the growing influence of Singapore becomes even clearer. Throughout the period, Singapore made up 6 percent of global acquisitions, whereas Hong Kong accounted for only 2 percent, with trends showing signs of further decline. Singapore also acquired twenty-three targets from Hong Kong, with only four acquisitions in the opposite direction.
Several factors, including the geopolitical tensions and civil unrest in Hong Kong (Lui, Rowley, and Oh Citation2020), can be attributed to the growth of Singapore as a net acquirer in the GFN. Perhaps most importantly, as documented elsewhere, has been the role of the state in actively transforming Singapore into a broad-based IFC (Lai and Samers Citation2017). Financial deregulation and liberalization, under a broader strategy of neoliberal developmentalism (Liow Citation2011), have revolutionized Singapore’s financial system. The gradual replacement of financial regulation with supervision has deepened the ties between Singapore and world-leading IFCs (Liow Citation2011), rendering its financial institutions more outward looking and simultaneously enhancing both the diversification and specialization of its financial sector (Woo Citation2016). Trends in M&A data highlight the success of these strategies, with Singapore as the leading Asian IFC in terms of the total number of deals and net acquisitions by both value and number.
Importantly, the growth and international influence of IFCs depends partly on retaining strong connections with the Western core of the GFN and the powerful world governments that shape global financial governance (Haberly and Wójcik Citation2021). Building on this assumption, the deeper the connections of Hong Kong and Singapore with NY-LON, the greater their level of influence. Throughout the period, Singapore was a net acquirer of NY-LON firms (twenty-six acquisitions, sixteen targets), compared with Hong Kong as a net target (fourteen acquisitions, sixteen targets). This suggests that Singapore is becoming more closely aligned with the world’s two leading IFCs and increasingly shaping the connections of the GFN.
Overall, the contrasting profiles of Singapore and Hong Kong point to a gradual transformation in the landscape of IFCs in Asia. This is not to say that Singapore is growing at the expense of Hong Kong, but it points to changing roles for both cities. M&As illustrate a clear trend toward greater convergence around Singapore as a global acquirer in the GFN, with Hong Kong as a net target, which increasingly mediates access to, rather than from, China. Regardless of the acquirer or target status, the consistently high levels of M&A activity in Hong Kong and Singapore highlight their central importance as midshore IFCs in the GFN. More generally, and supported by the postcrisis growth of M&As across Asia-Pacific, this does provide some evidence of finance moving East (Aalbers Citation2009).
Emerging Centers in the GFN
While “The Persistent High Profile of NY-LON” and “The Contrasting Profiles of Hong Kong and Singapore” analyzed four of the leading IFCs in the GFN, our data also uncovers the continued significance of two groups of IFCs, which highlight the growing importance of Islamic banking and offshore jurisdictions.
Islamic banking and finance refers to a diverse set of Sharia-compliant financial products, practices, and institutions shaped by principles from the Quran (Bassens, Derudder, and Wiltox Citation2010). Originating from the Gulf region, Islamic finance has become increasingly globalized over the last few decades, a transformation that has raised the profile of Middle Eastern IFCs and grown their global influence (Pollard and Samers Citation2007). Our M&A data captures this trend, with the four leading centers in the region (Doha, Kuwait City, Dubai, Abu Dhabi) shown to be strong international acquirers, with Doha and Kuwait City in the top twenty of net acquirers (see ). Outside of the top four, Dubai switched from a net acquirer to a net target following its domestic real estate crash in 2010 (Renaud Citation2012); however Muscat and Manama both switched in the opposite direction (see ).
The strengths of these IFCs highlights the growing importance of the Gulf region to the GFN (Bassens, Derudder, and Wiltox Citation2010). FABS firms in the Middle East have resources to acquire foreign firms, often through sovereign wealth funds (Haberly Citation2011). At the same time, government ownership and other restrictions in the region limit opportunities for acquisitions by foreign firms. These factors have not only accelerated the globalization of Islamic finance (Hanieh Citation2020) but helped position the Middle East more centrally in the GFN.
M&A data also highlights the importance of offshore jurisdictions to the GFN. Offshore jurisdictions provide greater levels of regulatory freedom and flexibility to the owners of financial assets (Haberly and Wójcik Citation2021). Including former British colonies and overseas territories, the offshore network functions as a diverse archipelago with close ties to the NY-LON axis (Haberly and Wójcik Citation2015). As shown by , Luxembourg, Hamilton, and Road Town are all in the top twenty of net acquirers. This challenges the assumption that offshore jurisdictions have become less prominent in the wake of the global financial crisis because of their falling rankings in the Global Financial Centers Index. As interpreted through the GFN, the strength of these IFCs reminds us that offshore jurisdictions are an inherent and permanent feature of the global financial landscape. While particular offshore jurisdictions may come and go, offshore jurisdictions as a function of the GFN will remain.
Aside from Road Town, reveals that Middle Eastern and offshore IFCs are strong net acquirers in terms of both number and value. While far from transforming the base of power in the GFN, this does highlight the growing importance of Islamic banking and the continued significance of offshore IFCs.
Table 9 Selected Middle Eastern and Offshore IFCs (2000–17)
Conclusions
The aim of this article was to explore the changing landscape of IFCs and the spatial concentration of decision-making power in the GFN. Through an analysis of cross-border financial sector M&As, we identified which IFCs are net acquirers; which are net targets; and how these positions, albeit rarely, can switch over time. Beyond generating fresh empirical insights into the evolution of the global financial landscape throughout the twenty-first century, this allowed us to advance a novel relational approach to IFCs that challenges the conventional conceptualization of power throughout existing studies.
In terms of key findings, we revealed that the majority of net acquirers are concentrated in Western Europe and North America, reflecting the durability of long-standing structures and the historic concentration of decision-making power in the GFN. The largest net targets were mostly found in emerging and developing markets, particularly Eastern Europe and Asia. While some IFCs were shown to move between acquirer and target positions, this was uncommon and occurred largely as a result of the global financial crisis. More specifically, our data highlighted the persistent high profile of NY-LON, the important roles of Singapore and Hong Kong as midshore IFCs, and the growing strength of Middle Eastern and offshore IFCs. Finally, and evidenced by the limited presence of Africa in our analysis, we found that certain regions on the periphery of the GFN were altogether bypassed by major networks of M&As. What our analysis makes clear is that in the decade following the financial crisis, there has only been moderate changes in the global landscape of IFCs. This central finding speaks to wider claims of inertia, consistency, and the stickiness of power in the GFN (Haberly and Wójcik Citation2021).
With these findings in mind, M&As have proven to be a powerful analytical tool in addressing a persistent theoretical gap in the literature concerning the uneven power geometries of the GFN. While other relational approaches to IFCs reveal the emerging geographies of the new financial landscape (Lai et al. Citation2020), the different roles and functions performed by cities on the network (Martinus et al. Citation2019), the changing fortunes of IFCs (Derudder, Hoyler, and Taylor Citation2011), and the theoretical and conceptual building blocks of the GFN (Haberly and Wójcik Citation2021), none have explored the intersecting power dynamics present throughout the GFN. We addressed this gap through our conceptualization of acquirers and targets, based on efficiency-, market-, and technology-seeking M&A deals, which allowed us to identify which cities coordinate financial networks, which are enrolled into them, and which are overlooked entirely. This not only revealed the scale and pace at which decision-making power is constantly shifting between IFCs but also the complex geographies and entrenched power relations that emerged as a result.
This provides a novel theoretical contribution by promoting a more fluid and dynamic conceptualization of power as part of the GFN. Instead of trying to ascertain which IFC is the biggest or the most dominant, M&A analysis encourages us to consider which IFCs are the most connected and what this means for the wider network. It challenges the idea that dominant centers exercise power over weaker centers and pushes us toward a more nuanced understanding of power wherein centers grow and networks evolve together. Acquirers do not dominate targets, but rather enroll them into wider axes of influence and promote mutual growth through the sharing of capital, labor, talent, and knowledge. This helps us move away from inherently competitive and hierarchical understandings of IFCs and devote more attention to mechanisms that increase connectivity and complementarity throughout the GFN.
In terms of avenues for future research, several questions remain unanswered. What patterns of uneven development will emerge as the spatial concentration of finance in Asia accelerates? Will we see the continued concentration of power in Western IFCs in the long term? How will these changes in global finance impact how the real economy is governed? While M&As cannot answer all of these questions, they will undoubtedly prove useful to researchers investigating how events, such as the COVID-19 crisis, Brexit, and the growing climate emergency, continue to reshape the spatial structures of the GFN. Building on our findings, the next step would be network analysis, mapping, and visualizing the intercity links outlined in this article. In addition, M&As could prove to be a valuable analytical tool in investigating the geographies of finance at the subnational level, providing fresh insight into how primary financial centers interact with secondary and peripheral centers within a national context. More broadly, this speaks to the wider need for more in-depth comparative research that zooms in on particular IFCs and their relational networks across space and time.
Supplemental Material
Download MS Word (34.2 KB)Acknowledgments
This research was supported by funding from the European Research Council (ERC) under the European Union’s Horizon 2020 research and innovation program (grant agreement No. 681337). All errors and omissions are the sole responsibility of the authors.
Supplementary Material
Supplemental data for this article can be accessed here.
Notes
1 Bureau van Dijk Orbis is a world-leading platform for company data, providing information on over 400 million companies collected through 170 research providers.
References
- Aalbers, M. 2009. Geographies of the financial crisis. Area 41 (1): 34–42. doi:https://doi.org/10.1111/j.1475-4762.2008.00877.x.
- Allen, J. 2010. Powerful city networks: More than connections, less than domination and control. Urban Studies 47 (13): 2895–911. doi:https://doi.org/10.1177/0042098010377364.
- Bassens, D., Derudder, B., and Wiltox, F. 2010. Searching for the Mecca of finance: Islamic financial services and the world city network. Area 42 (1): 35–46. doi:https://doi.org/10.1111/j.1475-4762.2009.00894.x.
- Bassens, D., Gutierrez, L., Hendrikse, R., Lambert, D., and Waiengnier, M. 2021. Unpacking the advanced producer services complex in world cities: Charting professional networks, localisation economies and markets. Urban Studies 58 (6): 1286–302. doi:https://doi.org/10.1177/0042098020908715.
- Bull, M. 2018. In the eye of the storm: The Italian economy and the eurozone crisis. South European Society & Politics 23 (1): 13–28. doi:https://doi.org/10.1080/13608746.2018.1433477.
- Cassis, Y. 2010. Capitals of capital: The rise and fall of international financial centres, 1780–2009. Cambridge: Cambridge University Press.
- Cassis, Y. 2018. Introduction. In International Financial centres after the global financial crisis and Brexit, ed. Y. Cassis and D. Wójcik, 1–15. Oxford: Oxford University Press.
- Cassis, Y., and Wójcik, D. 2018. International financial centres after the global financial crisis and Brexit. Oxford: Oxford University Press.
- Castells, M. 2000. The rise of the network society: The information age. Oxford: Blackwell.
- Coe, N., Lai, L., and Wójcik, D. 2014. Integrating finance into global production networks. Regional Studies 48 (5): 761–77. doi:https://doi.org/10.1080/00343404.2014.886772.
- Derudder, B., Hoyler, M., and Taylor, P. 2011. Goodbye Reykjavik: International banking centres and the global financial crisis. Area 43 (2): 173–82. doi:https://doi.org/10.1111/j.1475-4762.2010.00968.x.
- Donovan, D., and Murphy, A. 2013. The fall of the Celtic tiger. Oxford: Oxford University Press.
- Dörry, S., and Dymski, G. 2021. Will Brexit reverse the centralizing momentum of global finance? Geoforum I125 (October): 199–200. doi:https://doi.org/10.1016/j.geoforum.2018.02.003.
- Erel, I., Liao, R., and Weisbach, M. 2012. Determinants of cross-border mergers and acquisitions. Journal of Finance 67 (3): 1045–82. doi:https://doi.org/10.1111/j.1540-6261.2012.01741.x.
- Focarelli, D., and Pozzolo, A. F. 2008. Cross-border M&As in the financial sector: Is banking different from insurance?. Journal of Banking and Finance 32 (1): 15–29. doi:https://doi.org/10.1016/j.jbankfin.2007.09.002.
- French, S., Leyshon, A., and Thrift, N. 2009. A very geographical crisis: The making and breaking of the 2007–08 financial crisis. Cambridge Journal of Regions, Economy and Society 2 (2): 287–302.
- Green, M. 2018. Mergers and acquisitions. In The international encyclopaedia of geography, ed. D. Richardson, N. Castree, M. Goodchild, A. Kobayashi, W. Liu, and A. Marston, 1–9. Hoboken, NJ: John Wiley and Sons.
- Haberly, D. 2011. Strategic sovereign wealth fund investment and the new alliance capitalism: A network mapping investigation. EPA: Economy and Space 43 (8): 1833–52. doi:https://doi.org/10.1068/a43324.
- Haberly, D. 2021. Sticky power: Global financial networks in the world economy. Oxford: Oxford University Press.
- Haberly, D., MacDonald-Korth, D., Urban, M., and Wójcik, D. 2019. Asset management as a digital platform industry: A global financial network perspective. Geoforum 106 (November): 167–81. doi:https://doi.org/10.1016/j.geoforum.2019.08.009.
- Haberly, D., and Wójcik, D. 2015. Regional blocks and imperial legacies: Mapping the global offshore FDI network. Economic Geography 91 (3): 251–80. doi:https://doi.org/10.1111/ecge.12078.
- Hall, S., and Wójcik, D. 2021. ‘Ground zero’ of Brexit: London as an international financial centre. Geoforum 125 (October): 195–96. doi:https://doi.org/10.1016/j.geoforum.2018.02.002.
- Hanieh, A. 2020. New geographies of financial power: Global Islamic finance and the Gulf. Third World Quarterly 41 (3): 525–46. doi:https://doi.org/10.1080/01436597.2019.1675505.
- Hashimoto, T., and Wójcik, D. 2020. The geography of financial and business services in Poland: Stable concentration and a growing division of labour. European Urban and Regional Studies 28 (2): 85–91. doi:https://doi.org/10.1177/0969776420943664.
- Hendrikse, R., van Meeteren, M., and Bassens, D. 2020. Strategic coupling between finance, technology and the state: Cultivating a Fintech ecosystem for incumbent finance. EPA: Economy and Space 52 (8): 1516–38. doi:https://doi.org/10.1177/0308518X19887967.
- Jensen, M., and Meckling, W. 1976. Theory of the firm: Managerial behavior, agency costs and ownership structure. Journal of Financial Economics 3 (4): 305–60. doi:https://doi.org/10.1016/0304-405X(76)90026-X.
- Jones, A. 2002. The ‘global city’ misconceived: The myth of ‘global management’ in transnational service firms. Geoforum 33 (3): 335–50. doi:https://doi.org/10.1016/S0016-7185(02)00010-6.
- Juel, S. 2011. How to rebuild confidence in markets? The Norwegian experience. Paper presented at the EFTA Conference on Small European Economies, November 16, Brussels, Belgium.
- Keat, J. 2009. The global financial crisis: Impact on Asia and policy challenges ahead. Paper presented at the Asia Economic Policy Conference, November 14, San Francisco.
- Lai, K. 2012. Differentiated markets: Shanghai, Beijing and Hong Kong in China’s financial centre network. Urban Studies 49 (6): 1275–96. doi:https://doi.org/10.1177/0042098011408143.
- Lai, K., Pan, F., Sokol, M., and Wójcik, D. 2020. New financial geographies of Asia. Regional Studies 54 (2): 143–48. doi:https://doi.org/10.1080/00343404.2019.1689549.
- Lai, K., and Samers, M. 2017. Conceptualizing Islamic banking and finance: A comparison of its development and governance in Malaysia and Singapore. Pacific Review 30 (3): 405–24. doi:https://doi.org/10.1080/09512748.2016.1264455.
- Lee, D. 2017. Cross-border mergers and acquisitions with heterogeneous firms: Technology vs. market motives. North American Journal of Economics and Finance 42 (November): 20–37. doi:https://doi.org/10.1016/j.najef.2017.06.003.
- Liow, E. 2011. The neoliberal-developmental state: Singapore as case-study. Critical Sociology 38 (2): 241–64. doi:https://doi.org/10.1177/0896920511419900.
- Lui, T., Rowley, C., and Oh, I. 2020. After the storm: How Hong Kong holds onto its global status as a business hub in Asia-Pacific. Asia Pacific Business Review Call for Papers. .
- Marshall, J. 2013. A geographical political economy of banking crises: A peripheral region perspective on organizational concentration and spatial centralisaiton in Britain. Cambridge Journal of Regions, Economy and Society 6 (3): 455–77. doi:https://doi.org/10.1093/cjres/rst002.
- Martinus, K., Sigler, T., Iacopini, I., and Derudder, B. 2019. The brokerage role of small states and territories in global corporate networks. Growth and Change 52 (1): 12–28. doi:https://doi.org/10.1111/grow.12336.
- Meyer, D. 2015. The world cities of Hong Kong and Singapore: Network hubs of global finance. International Journal of Comparative Sociology 56 (3–4): 198–231. doi:https://doi.org/10.1177/0020715215608230.
- Meyer, D. 2020. The Hong Kong protests will not undermine it as a leading global financial centre. Area Development and Policy 5 (3): 256–68. doi:https://doi.org/10.1080/23792949.2020.1738249.
- Motis, J. 2007. Mergers and acquisitions motives. Working Paper 0730. Crete, Greece: University of Crete, Department of Economics.
- Nielsson, U., and Torfason, B. 2012. Iceland’s economic eruption and meltdown. Scandinavian Economic History Review 60 (1): 3–30. doi:https://doi.org/10.1080/03585522.2012.651303.
- Nisbett, N. 2009. Growing up in the knowledge society: Living the IT dream in Bangalore. New Delhi: Routledge.
- Palaskas, T., Psycharis, Y., Rovolis, A., and Stoforos, C. 2015. The asymmetrical impact of the economic crisis on unemployment and welfare in Greek urban economies. Journal of Economic Geography 15 (5): 1–35. doi:https://doi.org/10.1093/jeg/lbv027.
- Pan, F., He, Z., Sigler, T., Martinus, K., and Derudder, B. 2018. How Chinese financial centres integrate into global financial center networks. Chinese Geographical Science 28 (2): 217–30. doi:https://doi.org/10.1007/s11769-017-0913-7.
- Pollard, J., and Samers, M. 2007. Islamic banking and finance: Postcolonial political economy and the decentring of economic geography. Transactions of the Institute of British Geographers 32 (3): 313–30. doi:https://doi.org/10.1111/j.1475-5661.2007.00255.x.
- Renaud, B. 2012. Real estate bubble and financial crisis in Dubai: Dynamics and policy responses. Journal of Real Estate Literature 20 (1): 51–77. doi:https://doi.org/10.1080/10835547.2012.12090313.
- Rompotis, G. 2015. Mergers and acquisitions: Types, principles, historical information and empirical evidence from the Greek banking sector. IEB International Journal of Finance 10: 32–65.
- Warf, B. 2006. International competition between satellite and fiber optic carriers: A geographic perspective. Professional Geographer 58 (1): 1–11. doi:https://doi.org/10.1111/j.1467-9272.2006.00507.x.
- Wójcik, D. 2013. The dark side of NY-LON: Financial centres and the global financial crisis. Urban Studies 50 (13): 2736–52. doi:https://doi.org/10.1177/0042098012474513.
- Wójcik, D., Knight, E., O’Neill, P., and Pažitka, V. 2018. Economic geography of investment banking since 2008: The geography of shrinkage and shift. Economic Geography 94 (4): 376–99. doi:https://doi.org/10.1080/00130095.2018.1448264.
- Woo, J. J. 2016. Singapore as an international financial centre: History, policy and politics. London: Palgrave Macmillan.
- Zademach, H., and Musil, R. 2012. Global integration along historic pathways: Vienna and Munich in the changing financial geography of Europe. European Urban and Regional Studies 21 (4): 463–83. doi:https://doi.org/10.1177/0969776412457172.
- Zademach, H., and Rodríguez-Pose, A. 2009. Cross-border M&As and the changing economic geography of Europe. European Planning Studies 17 (5): 765–89. doi:https://doi.org/10.1080/09654310902778276.