
 ?Mathematical formulae have been encoded as MathML and are displayed in this HTML version using MathJax in order to improve their display. Uncheck the box to turn MathJax off. This feature requires Javascript. Click on a formula to zoom.
abstract
We study whether and when research and development (R&D) activities by foreign multinationals facilitate the formation and growth of new innovation clusters. Combining information on nearly four decades’ worth of patents with socioeconomic data for regions that cover virtually the entire globe, we use matched difference-in-differences estimation to show that R&D activities by foreign multinationals have a positive causal effect on local innovation rates. This effect is sizeable: over a five-year period, foreign research activities help a region climb fourteen centiles in the global innovation ranks. This effect materializes through a combination of knowledge spillovers to domestic firms and the attraction of new foreign firms to the region. However, not all multinationals generate equal benefits. In spite of their advanced technological capabilities, technology leaders generate fewer spillovers than technologically less advanced multinationals. A closer inspection reveals that technology leaders also engage in fewer technological alliances and exchange fewer workers with local firms abroad than less advanced firms. Moreover, technology leaders tend to set up their foreign R&D activities in regions with lower levels of economic development than less advanced firms, yet with comparable public-sector research capacity. These findings suggest that technologically leading multinationals face comparatively unfavorable trade-offs between the costs and benefits of local spillovers, underscoring the importance of taking the strategic choices that firms face into account when analyzing innovation clusters.
Cross-border research and development (R&D) investments have expanded drastically in recent years. Between 2003 and 2017, the number of investment projects and the capital invested roughly doubled, from projects worth $US18.7 billion to $US34.4 billion.Footnote1 Cities and regions compete fiercely over such projects, in the hope that they will create high-quality jobs, help develop local innovation capabilities, and put the region on the map as a recognized center of technological excellence. However, all too often this strategy overlooks that the multinational enterprises (MNEs) behind these investments have few incentives to share their knowledge and know-how. On the contrary, technologically advanced firms have often much to lose and little to gain from local knowledge spillovers. It is therefore a priori unclear if, and under which conditions, attracting MNEs helps upgrade a location’s technology base. In this article, we therefore study whether and when research activities by foreign firms trigger the emergence of new centers of technological excellence.
We hypothesize that R&D activities by foreign MNEs can create spillovers to the local economy that set in motion a process of collective learning (Athreye and Cantwell Citation2007; Fu Citation2007; Phelps Citation2008; Ning, Wang, and Li Citation2016; Blit Citation2018). However, just because firms invest abroad to access knowledge assets outside their home regions (Phelps and Fuller Citation2000; Belderbos, Olffen, and Zou Citation2011; Crescenzi, Pietrobelli, and Rabellotti Citation2014), they do not necessarily want to share their own knowledge assets with potential competitors. On the contrary, several authors (Shaver and Flyer Citation2000; Cassiman and Veugelers Citation2002; Iammarino and McCann Citation2006; Alcácer and Chung Citation2007) have argued that firms value inward spillovers that allow them to learn from others, but shun outward spillovers through which their own knowledge leaks to competitors. The underlying cost-benefit trade-off between inward and outward spillovers will depend on the knowledge gradient between the originators and the recipients of such knowledge flows. Although technology leaders may in principle be capable of generating the largest knowledge spillovers, they have least to gain and most to lose from them. Therefore, they will try hardest to prevent their know-how from leaking to competitors. In contrast, for companies further down the technological ladder, the balance tilts in favor of engaging more fully in reciprocal local learning processes. We argue that, to understand how MNEs affect local learning processes, it is indispensable to consider these strategic trade-offs.
We test this idea on data from the US Patent and Trademark Office (USPTO), covering patenting activity in regions from virtually all countries of the world. First, we identify all inventors who file patents on behalf of foreign firms. We take such patents to signal that a foreign firm has developed R&D activities in a location and consider these events as treatments to the local economy. To focus on knowledge diffusion from frontier to technologically less advanced economies, we limit the analysis to treatments by foreign firms headquartered in OECD countries. Next, we contrast regions with and without such treatments in a matched difference-in-differences estimation design to assess the causal impact of foreign firms on a region’s innovation rate.
Over a five-year period, patenting rates in treated regions increase by roughly 0.13 log-points faster than in untreated regions. This effect is large: it means that, on average, treated regions climb fourteen centiles higher in the global innovation ranks than if they had remained on the counterfactual development path on which no foreign R&D activities would have taken place. In part, this is attributable to local knowledge spillovers: the emergence of R&D activities by a foreign MNE causes an increase in patenting by domestic firms. Another part is due to demonstration effects: the fact that an MNE is able to produce patentable inventions signals to other foreign firms that the region is capable of supporting high-tech R&D activities, attracting further R&D activities from other foreign firms.
However, not all foreign firms increase local innovation rates equally. Contrary to much received wisdom,Footnote2 technology leaders are not the main contributors to local innovation capabilities. On the contrary, the arrival of technology leaders generates fewer spillovers to the local economy than the arrival of MNEs that rank lower in their technology field’s patenting distribution. A closer inspection of some of the channels through which knowledge spillovers materialize corroborates this conclusion. Our results suggest that foreign technology leaders engage in fewer local alliances than lower-ranking MNEs, and they exchange fewer workers with local firms. Instead, they rely more on their headquarters as a source of labor and see their patents cited less frequently by local firms. Finally, technology leaders locate disproportionally in regions with comparatively limited absorptive capacity (Cohen and Levinthal Citation1990).
Although firms’ incentives play a central role in studies on the location decision of MNEs in the field of international business, this literature is generally silent about how MNEs affect the technological capabilities of the regions that host their foreign subsidiaries. Conversely, the growing literature in economic geography on the role of foreign firms as agents of regional structural change (Isaksen, Tödtling, and Trippl Citation2018; Trippl, Grillitsch, and Isaksen Citation2018; Elekes, Boschma, and Lengyel Citation2019) rarely considers the incentives and strategic motivations of MNEs. Furthermore, the literature on global production networks (GPNs),Footnote3 which explicitly studies strategic couplings between foreign firms and their host economies, mostly relies on case studies and does not provide statistical estimates of the relative importance of foreign firms in the emergence of new technology centers. Our contribution, therefore, consists of three parts. First, we combine insights from the fields of economic geographic and strategic management to show that, to understand the evolution of innovation clusters, we need to take the heterogeneity in incentives of key actors into account. Second, we apply a statistical framework that balances external validity with internal validity. Internal validity tends to be high in case studies of individual regions, whereas external validity is higher in statistical studies that cover many regions. The balance we strike combines large-scale data that cover regions from around the globe over a period of over thirty years, with a careful analysis of counterfactual development paths. Therewith, our findings provide a useful statistical benchmark for how foreign R&D activities facilitate the emergence of new technology centers. Third, we corroborate our main findings on the reduced spillovers that leading MNEs generate by showing that various knowledge spillover channels are more muted when R&D activities are undertaken by technology leaders instead of by less-established MNEs.
In doing so, our study relates to five ongoing debates. First, our study adds to our understanding of cluster emergence and evolution (Feldman and Braunerhjelm Citation2006; Menzel and Fornahl Citation2010), drawing special attention to the role of MNEs. Second, our findings relate to the discussion on knowledge spillovers in local economies (Glaeser et al. Citation1992; Jaffe, Trajtenberg, and Henderson Citation1993; Henderson, Kuncoro, and Turner Citation1995), highlighting the role of knowledge transmission through corporate networks. Third, our study is related to the work on how knowledge diffuses through the internationalization of firms (Fosfuri, Motta, and Ronde Citation2001; Javorcik Citation2004; Saxenian Citation2007; McCann and Acs Citation2011; Crescenzi, Gagliardi, and Iammarino Citation2015), in particular to Blit (Citation2018), who shows that firms located in the countries of an MNE’s R&D satellites disproportionally cite patents filed at the MNE’s headquarter location. Fourth, by highlighting the importance of firms’ strategic motivations, our study links the work on agents of regional change (Isaksen, Tödtling, and Trippl Citation2018; Neffke et al. Citation2018; Trippl, Grillitsch, and Isaksen Citation2018), on MNE location choice (McCann and Mudambi Citation2004; Crescenzi, Pietrobelli, and Rabellotti Citation2014; Castellani and Lavoratori Citation2020) and on strategic couplings (see the literature on GPNs, e.g., Coe et al. Citation2004) between MNEs and a local economy. Finally, our work has important implications for public policy that aims at attracting high-tech foreign direct investment (FDI) to catalyze local economic development. In particular, it implies that flagship R&D investments may have a lower pay-off than the knowledge intensity of such investment projects suggests.
Stylized Facts and Conceptual Framework
Stylized Facts on the Global Geography of Innovation
Participation in the global innovation contest is a privilege reserved for only a handful of regions. (left) shows population-weighted spatial Lorenz curves for income (dashed curve) and patenting in the year 2005. The dotted curve depicts total patenting output, the solid curve excludes patents by US inventors. The already high spatial concentration of global income pales against the concentration of innovative activity: in 2012, the ten most innovative regions in the world together accounted for 39 percent of all patents and for 45 percent of patents filed by inventors outside the US.
Figure 1. Inequality and stability of innovation output across regions. Notes: Left: Population weighted spatial Lorenz curves of patent and income shares for the year 2005. Shares of patents are based on unweighted counts of USPTO patents assigned to inventors residing in each region. Regional population data come from Gennaioli et al. (Citation2014). Right: Stability of regional innovation ranks. Circles represent one of the 1,456 regions in the data set for which we have GDP data. Circles’ sizes are proportional to average regional gross domestic product (GDP) over the period 1975–93. Horizontal axis: number of patents filed between 1975 and 1993. Vertical axis: number of patents filed between 1994 and 2012. Colors refer to World Bank macro regions. Persistence is lowest in Asia and South-East Asia, with the following region-specific correlations between the two periods: South Asia: 0.92; East Asia and Pacific: 0.92; Latin America and Caribbean: 0.94; North America: 0.97; MENA (Middle East and North Africa): 0.98; Europe and Central Asia: 0.98; sub-Saharan Africa: 0.98.
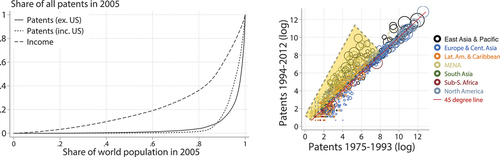
The distribution of innovative activity is not only skewed, it also hardly changes over time. The right panel of shows regions’ patenting output in the period 1994–2012 against the period 1975–1993. Most regions are on or close to the forty-five-degree line, implying that few regions manage to forge ahead of or fall behind their competitors. However, some positive exceptions exist. These exceptions, highlighted by the triangular overlay, represent locations that are becoming new contenders in the global innovation race.
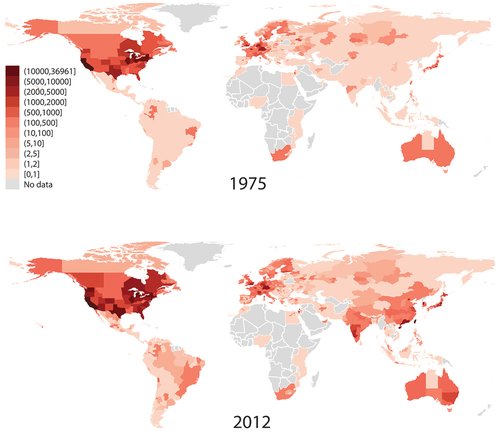
shows where such new centers of technological excellence have emerged. It displays the global geography of innovation as expressed in USPTO patents in 1975 and in 2012. Patenting rates have grown most prominently in regions in Korea, Taiwan, India, and China, and to a lesser extent in Eastern Europe, Canada, and Israel. These regions increased their patent production and rose in the world’s innovation ranks. Conceptually, they form the motivation for our study: to what extent did foreign R&D activities kick-start such growth accelerations?
Figure 2. Patent distribution in 1975 and 2012. Notes: Total number of patents filed with the USPTO in 1975 and 2012, by region of residence of their inventors. Countries for which other regional data are missing are colored gray, even though a small number of inventors resides in these countries.
Conceptual Framework and Hypotheses
How new innovation clusters emerge is a topic of substantial debate. Some authors stress the role of factors endogenous to the region. For instance, Feldman and Braunerhjelm (Citation2006) point to entrepreneurial experimentation and local policies aimed at creating and maintaining a strong local knowledge base. Others point to the same Marshallian externalities that also drive the success of traditional industrial clusters or to face-to-face interactions that help reproduce at a systemic (i.e., cluster) level the spontaneous learning processes that are usually confined within a firm’s boundaries (Storper and Venables Citation2004). Yet another set of scholars in evolutionary economic geography (EEG) have shown that, like industrial diversification, technological diversification in terms of patented innovations follows a path of related diversification (e.g., Kogler, Essletzbichler, and Rigby Citation2017).
However, the main focus in these studies is endogenous factors—factors internal to a region—not exogenous forces: “[a]ccounts of the development of [prominent regional hotspots] have emphasized their endogenous dynamism rather than exogenous linkages.” (MacKinnon Citation2012, 237). Similarly, Trippl, Grillitsch, and Isaksen (Citation2018, 688) point out that “EEG has been sharply criticized for ignoring exogeneous stimuli and the multi-scalar interrelatedness and embeddedness of firms.” Taking this criticism to heart, several recent studies have shown that important structural transformation is indeed induced by agents of change from outside the region (e.g., Neffke et al. Citation2018; Elekes, Boschma, and Lengyel Citation2019).
The globalization of R&D has added an extra layer of complexity to this discussion. As the global body of knowledge grows, it becomes increasingly distributed across people and places (Neffke Citation2019). Under such conditions, clusters must combine their local buzz with global pipelines (Bathelt, Malmberg, and Maskell Citation2004). These pipelines help a cluster tap into knowledge bases outside the region and mitigate against cognitive lock-in. They can be sustained by various types of global actors, from diasporic communities (Saxenian Citation2007), to universities, star scientists (Zucker, Darby, and Armstrong Citation1998), and MNEs (e.g., Blomström and Kokko Citation1998; Javorcik Citation2004; Haskel, Pereira, and Slaughter Citation2007; Keller and Yeaple Citation2009; McCann and Acs Citation2011; Crescenzi, Gagliardi, and Iammarino Citation2015; Cortinovis, Crescenzi, and van Oort Citation2020).
Our analysis focuses on the latter actors, MNEs. With their networks of R&D facilities, MNEs represent strong conduits for the diffusion of advanced technological know-how (Athreye and Cantwell Citation2007). We therefore expect that cross-border R&D activities by MNEs help regions acquire new technological capabilities, providing the seed for new innovation clusters. This suggests the following hypothesis:
H1: The development of R&D activities by foreign MNEs in a region leads to an increase in local patenting by domestic firms.
MNEs can also act as anchor firms. Anchor firms (Agrawal and Cockburn Citation2003; Feldman Citation2003) “attract skilled labor pools, specialized intermediate industries and provide knowledge spillovers that benefit new technology intensive firms in the region” (Feldman Citation2003, 312). Attracting innovative MNEs and anchoring them in the regional innovation system may therefore be key to local economic development, especially in peripheral regions (Tödtling and Trippl Citation2005). Moreover, anchor firms generate strong demonstration effects. When foreign MNEs innovate with local inventors, they signal that adequate knowledge resources are present, aiding regional self-discovery (Hausmann and Rodrik Citation2003). We hypothesize that these demonstration effects attract further MNEs to the region:
H2: The development of R&D activities by foreign MNEs in a region attracts further MNEs that raise local innovation rates through their own R&D activities.
However, spillovers from FDI are by no means automatic (Blomström and Kokko Citation1998; Liu and Buck Citation2007). To “[diffuse] knowledge and enhance collective learning in clusters” (Giuliani Citation2007, 140), intra- and interfirm international networks must become embedded in a region’s local networks (Maskell and Malmberg Citation1999), echoing the importance that the GPN literature attributes to strategic couplings (e.g., Coe et al. Citation2004). In this context, Phelps et al. (Citation2003) argue that MNEs’ branch plants often source most inputs and know-how from within the wider corporation instead of from the local environment. As a result, these MNEs create enclaves instead of embedding their innovation efforts within the local innovation system. This raises an important, yet often ignored, question: do foreign firms have an incentive to participate in local innovation networks?
Outside the literature on GPNs (e.g., Coe et al. Citation2004; Yeung Citation2015; Coe and Yeung Citation2019), to which we will turn below, the economic geography literature often remains silent on the topic of firms’ incentives to participate in regional innovation systemsFootnote4 what shapes MNEs’ strategic behavior vis-à-vis the local innovation system is rarely addressed. However, the internationalization strategies pursued by MNEs have been an important topic of debate in international business and strategic management. This literature argues that one reason why MNEs invest abroad is so that they can access knowledge assets in other locations (Cantwell Citation2005). This yields several benefits: by internationalizing their R&D activities firms can bring products to market faster (Von Zedtwitz and Gassmann Citation2002), hire global talent at reduced costs (Lewin, Massini, and Peeters Citation2009), and tap into foreign centers of technological excellence (Cantwell and Janne Citation1999). However, even if MNEs engage in R&D activities abroad to tap into local knowledge and know-how—a strategy known as strategic asset seeking—this does not necessarily mean that they desire to engage in reciprocal collective learning. On the contrary, firms balance the benefits from inward knowledge spillovers with the costs of outward spillovers—that is, of knowledge leaking to competitors (Shaver and Flyer Citation2000; Cassiman and Veugelers Citation2002). Alcácer and Chung (Citation2007) therefore posit that MNEs try to maximize, not spillovers per se, but net spillovers. Because technology leaders have least to gain and most to lose from knowledge sharing, they may not generate many local spillovers, in spite of their advanced knowledge assets. We therefore hypothesize:
H3: The more technologically advanced the foreign MNE is, the smaller the spillovers to the local economy will be.
If technology leaders indeed generate fewer spillovers, we would expect to find corroborating evidence when analyzing traces of knowledge spillovers in patent citations and prominent channels of knowledge transmission between MNEs and local firms, such as local labor circulation (Song, Almeida, and Wu Citation2003; Singh and Agrawal Citation2011), and R&D collaborations. This yields the following set of hypotheses:
H4: Ceteris paribus, technologically more advanced foreign MNEs (4a) exchange fewer R&D workers with local firms, (4b) engage in fewer technological collaborations with local firms, and (4c) are less often cited as a source of knowledge by local firms.
Why would technology leaders be better able to curb knowledge spillovers than others would? On the one hand, they may be able to pay higher salaries or use more sophisticated legal means to keep key R&D workers from leaving the firm. Furthermore, they may be able to forgo external collaborations and, instead, leverage advanced internal knowledge assets through their own corporate networks (McCann and Mudambi Citation2004). This resonates with the GPN literature’s emphasis on bargaining between globally operating firms and the local economies where they invest, which may lead to drastically different value-capture outcomes across regions (e.g., Coe et al. Citation2004). On the other hand, technology leaders can use their location decisions strategically to curtail spillovers. In line with this, Alcácer and Chung (Citation2007) show that technologically advanced firms are more likely to avoid the vicinity of the most competent competitors than less advanced firms are. Under such circumstances, spillovers are low because there are simply few opportunities to hire workers from, or collaborate with, local firms.
Although our data do not allow us to determine the full range of strategies that technology leaders may employ to minimize outward spillovers, we can observe their location choices. Based on the arguments above, we expect that advanced MNEs will locate their R&D activities in places with low absorptive capacity and less well-established innovation systems to mitigate risks of accidental knowledge spillovers. This leads to the following hypothesis:
H5: Technologically advanced foreign MNEs will locate disproportionately in less developed regions.
Note that hypothesis 5 predicts that technologically advanced MNEs avoid places that could spawn competitors who would be able to absorb unintended knowledge spillovers. However, these MNEs may still select locations with research capacity in public-sector institutions (Alcácer and Chung Citation2007). For instance, the opportunity to engage in university–industry linkages (e.g., D’Este and Patel Citation2007; Crescenzi, Filippetti, and Iammarino Citation2017) would yield the benefits of inward local knowledge spillovers without the costs of outward spillovers that erode the MNE’s technological edge over competitors.
Methodology
Saxenian (Citation2007) describes how some of the most prominent new centers of technological excellence originated with the help of foreign actors who connected these new locations to existing technology centers. corroborates this. It takes the largest positive outlier (i.e., the region-technology combination with the fastest growth) for each macro region in (right) and then shows how its patenting output evolved over time. Dashed vertical lines mark the first local patent that was assigned to a foreign MNE.
Figure 3. Patent accelerations. Notes: Patenting output for region-technology cells with largest patenting growth. Titles list region names and broad technology classes. Vertical axes display patent counts. Dashed vertical lines indicate the cell’s first patent assigned to a foreign MNE.
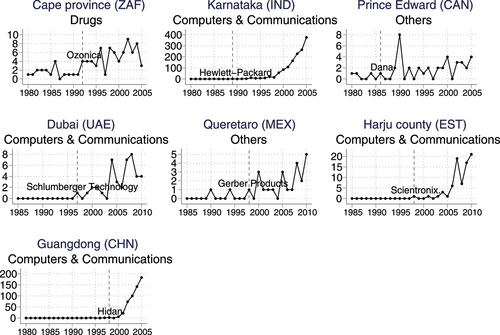
In most graphs, accelerations in innovation rates are preceded by a patent assigned to a foreign firm. Like Saxenian’s case studies, these graphs first identify successful regions and then look for traces of foreign research activities in their past. However, this research strategy risks selection bias. To avoid such bias we will identify all regions where foreign MNEs file patents with local inventors, irrespective of whether they ever become successful innovation centers. Next, we compare growth paths of regions with such foreign R&D activities to otherwise similar counterfactual development paths of regions without foreign R&D activities.
Data
We use data on 6 million patents granted by the USPTO between 1975 and 2015 from PatentsView.Footnote5 This data set covers 3.6 million unique inventors with their geocoded places of residence and 314,366 unique primary assignee identifiers. We date each patent by its application year, not the year in which it was granted. Furthermore, because the USPTO publishes patents with a processing lag, we limit the analysis to patent applications filed before 2013.
PatentsView records the location of residence of all inventors, which allows us to determine where research activities take place. However, to determine an assignee’s primary research—or home—location, we do not use the location of its headquarters as listed in PatentsView, but rather the modal country of residence of its inventors. This way, we identify the country in which an assignee carries out most of its R&D, not where it reports its legal headquarters to be.Footnote6 For instance, we reclassify the phone maker ZTE from an American to a Chinese firm and the home furniture group IKEA from a Dutch to a Swedish company. For the sake of brevity, we will still refer to these primary research locations as companies’ headquarters. Furthermore, we only use private-sector patents, excluding patents assigned to government agencies such as the US Navy, the American Air Force, or the French Commissariat à l’Energie Atomique. Finally, we limit the analysis to foreign R&D activities by firms headquartered in OECD countries.Footnote7 This allows us to concentrate on knowledge diffusion from frontier to lagging regions. It also ensures that different regions’ foreign research activities involve similarly advanced countries of origin.
Next, we assign all patents to one of 1,549 regions and add data provided by Gennaioli et al. (Citation2014) on national and regional gross domestic product (GDP) per capita, average years of education, and population size. Together, these regions cover 97.2 percent of all USPTO patents and about 95 percent of global GDP. Appendix A in the online material describes both data sets in detail.
Relying on patents as a measure of regional innovation output has some well-understood limitations (e.g., Archibugi Citation1992; Crescenzi, Filippetti, and Iammarino Citation2017). For instance, patents only capture patented innovations, and their efficacy and use in protecting intellectual property varies across firms and sectors. Moreover, not all patented inventions are equally valuable, and not all inventors contribute equally to an invention. Finally, patents are essentially a defensive strategy aimed at limiting competition. However, the intensity of patent races will differ across fields and firms. Therefore, raw patent counts represent only a rough and possibly biased approximation of the technological capabilities of firms and regions.
In spite of these limitations, the USPTO patent database offers a unique lens on the internationalization of knowledge production and its geography. Its long coverage allows us to explore the emergence of new technology centers over the course of several decades as well as the firms and inventors involved therein. Moreover, because, for most of the period under study, the US represents the largest market in which firms can protect their intellectual property, firms anywhere in the world have strong incentives to file their inventions with the USPTO. Finally, because patents are filed for the same market and with the same patent office, our data are highly comparable across regions and countries. However, protecting inventions in the home market may be qualitatively different from protecting inventions in foreign markets. We therefore exclude US regions (but not US firms!) and focus on technology centers that emerge outside the US. This leaves data for 922,459, or 25.6 percent, of the overall number of inventors.
Defining Foreign Research Activities
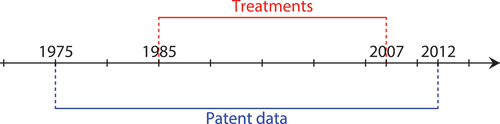
To identify foreign research activities, we select all patents whose inventors reside outside the country of the assignee’s headquarters. These patents are considered as signs of foreign research activities. We consider the first foreign patents, that is, patent applications by local inventors but assigned to foreign, OECD-based firms, as treatments to a technology in a region, where technologies refer to one of the thirty-seven technological subcategories in Hall, Jaffe, and Trajtenberg (Citation2001). Therefore, our sample in principle consists of all combinations of 1,549 regions and 37 technological subcategories, defining 57,313 region-technology cells. However, we drop all cells that had already hosted foreign R&D activities between 1975 and 1985.Footnote8 In the remaining cells, we record all patents filed by local inventors, from five years before to five years after a treatment. This limits our study to treatments between 1985 and 2007, as depicted in .
Figure 4. Timeline of treatments. Notes: Data are available for patents filed between 1975 and 2012. The first ten years of this period are used to identify which region-technology cells are untreated, that is, had no local patents assigned to foreign firms. For each treatment, we require an observation window from five years before to five years after the treatment.
Nature of the Treatment
What do these treatments represent? First, it is important to note that our data capture the original assignees, not the current owners of a patent. The role of these original assignees in the research must have been sufficiently large to warrant ownership of the invention; instances where foreign firms just buy intellectual property from local inventors are excluded by design. Second, 93 percent of inventors on treatment patents are locals. The main research effort thus takes place in the region itself, not in the MNE’s home country. Third, local inventors typically maintain a long-lived relation with the treatment firm. This follows from the fact that 86 percent of the local inventors on treatment patents who patent at least once more within the subsequent five years (multipatent inventors) do so for the treatment firm. This represents an extraordinarily high employee retention rate. Local inventors thus provide the main input in the research efforts associated with our treatments and do not maintain short-lived relations, but rather form durable connections with the MNE that suggest the existence of formal employment relations. Taken together, this strongly suggests that the MNEs are materially involved in the treatments in this study.
Timing of Treatments and Treatment Effects
Finally, we explore whether we can find evidence that our treatments are associated with formal FDI. To do so, we match our treatment patents to firms in ORBIS using patent identifiers. ORBIS is a commercial database maintained by Bureau van Dijk that covers some 200 million companies worldwide. Among other things, it lists the patents that companies own. Using patent identifiers, we can identify current owners of 79.6 percent of all treatment patents in ORBIS. For 61 percent of these patents, we also find that the owner has a subsidiary in the treatment region,Footnote9 supporting the notion that our treatments often involve actual FDI.
To get a sense of how accurately we capture the timing of treatments and the size of the investments associated with treatments, we also match treatments to greenfield R&D investment projects recorded in fDi Markets between 2004 and 2012. The fDi Markets database does not contain patent identifiers. We therefore match on company names and are able to identify R&D investment projects for 173 treatments (5.85 percent). The median of these treatments is associated with an investment of $US37.3 million and the creation of 207 jobs. However, given the fDi Markets database’s bias toward large investment projects, this will overstate the size of the typical treatment. Furthermore, we find that investment projects predate treatment patents by 1.7 years on average. This suggests that our treatments trail investments by between one and two years, which is reasonable given the expected time it takes for these investments to bear fruit. However, because local firms will require a similar amount of time to transform any potential spillovers into higher patenting rates, we expect that the consequences of a treatment will emerge around the same time that we observe the filing of the treatment patent.
Dependent Variable
Our variable of interest is the patenting output by inventors who report a region as their place of residence. If a patent lists inventors in multiple regions, we attribute a fraction to each region. Moreover, we focus on spillovers from treatment firms to other firms in a region-technology cell. We therefore disregard all patents assigned to treatment firms: foreign firms to which the treatment patent was assigned.
To reduce the skewness in a variable that often equals zero, we use the inverse hyperbolic sine (IHS) of a cell’s patent count:
where represents the fractional countFootnote10 of patent applications filed in technology field
in year
by inventors residing in region
. The advantage of this metric is that, unlike
,
is well defined, while the IHS rapidly approximates the natural logarithm: for
, the difference between
and
is below 2.5 percent.
Causal Effects of Foreign Research Activities
Foreign firms may not only help regions develop technological capabilities, they may also be attracted by such capabilities. As a consequence, the direction of causation between receiving FDI and developing technological capabilities is, a priori, unclear. To address this problem, we combine matching with difference-in-differences estimation. That is, we first select for each treated region-technology cell a set of untreated cells with otherwise similar characteristics. These matched cells offer counterfactual development paths for how the treated cells would have fared, had they not been treated. Next, we study whether the performance of treated and control cells diverge after the treatment.
The matching exercise uses a mixture of propensity score and exact matching. First, we estimate a cell’s propensity to be treated using a probit regression with, as explanatory variables, the average years of education in the region and in the country, the region’s population size, and several lags of country-level and region-level GDP per capita. The latter provide a flexible way to control for trends in income growth, which should in principle capture all improvements in a region’s capability base that are directly relevant to its productivity. This is important, because changes in a region’s productivity may not only result from foreign investments but also attract them. Next, we select up to five counterfactual cells that match the treated cell’s propensity score most closely, while also sharing that cell’s exact same year and technology subcategory. Finally, we require that treated and nontreated regions do not belong to the same country. This ensures that counterfactual cells are not treated indirectly, through within-country spillovers.
In a second step, we estimate the following difference-in-differences model:
where represents region-technology fixed effects,
a dummy for whether or not a region-technology cell was treated, and
year fixed effects. The parameters of interest are collected in
. The
encodes event time, and runs from −5 to +5, that is, from five years before to five years after foreign research activities emerge in the patent data. They express the difference in average innovation output between treated and nontreated cells in each year.
Balancing External and Internal Validity
With this empirical strategy, we aim to strike a balance between internal validity, that is, how confidently we can determine the causes behind the patenting dynamics in the regions of our sample and external validity—the extent to which our findings generalize to other regions. To do so, we use observable characteristics to identify plausible counterfactual development paths for each treated region.
The difference-in-differences design allows us to assess how well we succeeded at this. To see this, note that we do not match cells on their pretreatment patenting performance. Therefore, before the treatment, treated and nontreated cells, in principle, could be on very different patenting trajectories. However, as long as treated and control cells exhibit indistinguishable innovation trajectories before the arrival of foreign R&D activities (i.e., for
), the control cells arguably provide a reliable counterfactual development path for the treated cells, had they not hosted any foreign R&D activities. Under such circumstances, estimated effects are likely to be causal. Yet, it is still possible that some unobserved event—for instance, a change in government policy—triggers a sudden increase in a cell’s technological capabilities as well as making this cell more attractive for foreign firms. To minimize such confounding, we match on a region’s entire GDP trajectory, which should control for any changes in a region’s capabilities that matter to its productivity. However, any remaining confounding factors would affect our study’s internal validity, and our results should be interpreted with this caveat in mind.
The approach outlined above has several advantages. First, we do not select successful regions a priori and are less likely to over-fit observed patterns that are merely incidental to a causal narrative. Second, we avoid some pitfalls of statistical analyses in which the direction of causation is unknown. Third, the wide range of regions and technologies in our sample enhances our study’s external validity.
However, our approach also involves a compromise. We can neither explore the intricate causal pathways that explain a particular region’s success—as in a well-crafted case study—nor do we exploit a real or natural experiment that guarantees a causal interpretation of our estimates. Moreover, we have only limited information on each region and on the strategic behavior of foreign MNEs. Yet, we believe that the resulting balance between internal and external validity is useful, because it allows us to formulate qualified conclusions about the typical (i.e., in a statistical sense, expected) causal role that foreign R&D activities play in the emergence of new centers of technological excellence.
Findings
Difference-in-Differences Estimations
In total, we identify 5,731 treated region-technology cells, that is, cells in which the first foreign research activities are detected between 1985 and 2007. This number drops to 3,134 after we exclude cells outside the matching support without sufficiently close counterfactuals, based on a caliper of 0.0002. At this caliper, treated and nontreated cells have similar pretreatment trends. Stricter calipers do not yield improvements but lead to less precisely estimated effects. On average, we match 2.35 control cells to each treated cell.
compares some key variables in treated and nontreated cells. Treated cells are on average substantially richer and more educated than nontreated cells. This corroborates our concern that foreign firms may be attracted to regions with advanced technological capabilities. Matching improves the balance between treated and nontreated cells for most variables, although some differences remain.
Table 1 Balance on Observable Characteristics
These differences prove inconsequential for our difference-in-differences estimates, (solid lines in ): before treatment, patenting output does not differ significantly between treated and nontreated cells. However, after the treatment, patenting rates in treated cells start outpacing the ones in nontreated cells. After five years, the average local fractional patent counts in treated cells exceed their counterfactuals by 0.15 IHS points. Using the natural logarithm to approximate the IHS, this means that patent counts in treated regions are about 16 percent (
) above their counterfactuals.Footnote11
Figure 5. Difference-in-differences estimates. Notes: Difference-in-differences estimates, . These estimates reflect the differences in the IHS of fractional patent count between treated and control cells in the matched sample of 3,134 treated and 7,369 control cells. Vertical lines depict 95 percent confidence intervals, using standard errors clustered by region. Point estimates that are statistically significantly different from zero (
) are shown in orange, insignificant point estimates in blue. The series with solid markers and vertical lines refers to the effect on all patents in the region, the series with hollow markers and dashed vertical lines refer to the effect on patents by domestic firms only.
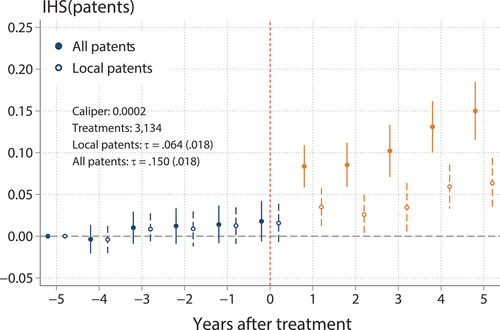
The difference between the treatment effects on total patenting and on domestic patenting must be attributed to further foreign firms following the treatment firm to the region. This can be interpreted as a demonstration effect: the entry of the first foreign MNE signals to other foreign firms that one can successfully develop R&D activities in the region. This demonstration effect is larger than the spillover effect. Of the overall effect of 16 percent, only 7 percent is due to increased patenting by domestic firms. The remaining 9 percent consists of additional patenting by foreign MNEs.Footnote12 This corroborates hypothesis 2: the entry of foreign MNEs attracts further foreign entrants who contribute to a region’s patenting output.
Heterogeneity in Treatment Effects
Do all treatments yield similar spillovers? To answer this question within a difference-in-differences framework, we would have to estimate separate difference-in-differences curves for different subsamples. The modest number of treatments in our sample makes such a strategy impractical. Instead, we exploit the fact that the difference-in-differences graphs can be broken down into a flat part until the treatment year and a more-or-less linear increase thereafter. This suggests that we can collapse the data into a period before and a period after the treatment to estimate the following cross-sectional regression equation:
where represents the growth in the IHS of patenting in region
and technology
from one year before to five years after the treatment, and the matrix
includes control variables. To explore if there is any heterogeneity in treatment effects, we interact the treatment dummy,
, with variables that describe a cell’s macroregion, technology, or treatment firm. These variables are collected in the matrix
summarizes results. Odd columns report the effect on total patenting, even columns on patenting by domestic firms only. All models control for all variables used in the propensity scores calculations as well as for year and country fixed effects. The first two columns show that foreign research activities increase overall patenting output five years after the treatment by about 14 percent.Footnote13 The effect on patenting by domestic firms is just 6 percent. The difference between the two estimates is due to patents filed by local inventors on behalf of other foreign firms that subsequently enter the region.
Table 2 Analysis of Effect Heterogeneity
Columns 3 and 4 interact the treatment dummy with macroregion dummies. Treatment effects are strongest in East Asia, implying a 23 percent increase in overall patenting and a 13 percent increase in patenting by domestic firms. Foreign research activities also lead to a substantial rise in patenting in Europe and Central Asia (the omitted category), increasing overall patenting by 11 percent and patenting by domestic firms by 4 percent. Point estimates for South Asia are large, but imprecisely estimated, whereas treated cells in the MENA (Middle East and North Africa) region do not seem to experience any significant treatment effects.
Columns 5 and 6 interact the treatment dummy with dummies for six broad technology classes, with other as the base category. Large and significant treatment effects exist in medical, electrical, and computer technologies.
Finally, we identify all treatments by firms who are technology leaders. To do so, we count the number of patents filed between 1975 and 1985 on behalf of each firm in our data set. Firms ranked in the top 5 percent for this count in their technology category will be considered technology leaders. Lists of technology leaders by aggregate technology category are provided in Appendix B in the online material. To contrast technology leaders to other foreign MNEs, we create two further classes: firms in the sixth to nineteenth percentile and firms in the bottom 80 percent of their technology class.
Although technology leaders arguably have most to offer in terms of technological know-how, their treatments affect local innovation rates significantly less than those of lower-ranking firms. The treatment effect on overall patenting (column 7) halves when the treatment firm is a technology leader compared to treatments by midtier firms or firms at the bottom of the patenting distribution. These differences are even more striking when focusing on patenting by domestic firms (column 8). Whereas foreign firms at the bottom of the patenting distribution raise domestic patenting rates by about 9 percent, technology leaders generate no spillovers whatsoever. This difference in treatment effects barely changes when all interaction terms enter the model simultaneously (columns 9 and 10). This corroborates hypothesis 3: the more advanced the MNE, the smaller the spillovers to the local economy are.
If technology leaders really generate fewer spillovers than lower-ranking firms, we should be able to corroborate this by looking at spillover channels and patent citations. Below, we focus on two well-known channels through which knowledge spillovers materialize: technological alliances and labor circulation. Next, we look at citation patterns. Finally, we analyze foreign firms’ location choices.
Alliances
Do technology leaders engage in fewer local alliances abroad than lower-ranking MNEs? To answer this question, we collect all patents assigned to potential treatment firms. That is, we take all patents assigned to OECD-based MNEs that were filed by inventors outside the MNEs’ home countries. Next, we create one dummy variable that takes a value of one if these patents are the result of a collaboration, that is, if the patent lists multiple firms as assignees, and another dummy that identifies collaborations with domestic firms. We regress both dummy variables on a dummy that captures whether a firm is a technology leader.
reports results. The upper panel reports estimates from linear probability models (LPMs), while the lower panel reports marginal effects from logit regressions. Columns 1 and 3 show the unconditional association between firms’ propensity to engage in alliances and their being a technology leader. On average, technology leaders are 3.1 percentage points (pp) less likely to engage in alliances, equivalent to 63 percent of the average alliance rate (baseline propensity). Technology leaders are also underrepresented in alliances with domestic firms: technology leaders are 1.2 pp less likely to engage in such alliances than other MNEs, equivalent to 52 percent of the average rate. Logit models and models with further control variables yield similar results.
Table 3 Alliances
Labor Mobility
Working at MNEs allows workers to acquire advanced skills and organizational know-how that become available to local firms once these workers leave the MNE (Poole Citation2013; Csáfordi et al. Citation2018). To explore whether technology leaders and lower-ranking MNEs differ with respect to labor circulation in their foreign R&D locations, we use the disambiguated inventor identifiers in PatentsView to approximately map how inventors move between firms.
First, we ask how often foreign firms bring their own inventors to R&D locations abroad. To do so, we identify all inventors who filed patents outside their firm’s home country (and outside the US). For each of these inventors, we ask if they filed an earlier patent with this same firm inside its home country. Next, we determine whether this was more often the case for inventors working for technology leaders than for inventors working for lower ranking firms. Because the likelihood of observing job switches depends on how many patents inventors file, we control for the total patenting output throughout an inventor’s career. Furthermore, we add dummies for the firm’s home country and for the inventor’s country of residence.
Results are reported in . Being a technology leader has a positive and significant effect on the likelihood that inventors are sourced from a firm’s headquarters. The LPM shows that technology leaders source inventors 1.8 pp more often from their headquarter locations than technologically less advanced MNEs. The logit regression yields a comparable marginal effect. Technology leaders thus bring more of their own inventors to their foreign R&D locations than lower- ranking MNEs do.
Table 4 Inventor Sourcing from Headquarter Country
Do technology leaders also exchange fewer inventors with other firms in the local economy? To answer this question, we select all inventors who file two or more patents in a region-technology cell, at least one of which for a foreign firm. We control for the inventor’s total number of patents in the cell to account for the fact that, the more patents an inventor files, the easier it is to detect job switches.
Results, shown in , are striking. Technology leaders exchange workers with other firms in the local economy at a much lower rate than lower-ranking MNEs do. The rate at which they hire inventors from domestic firms (columns 1 and 2) is 4.9 pp lower, against an average mobility rate of 17 percent. Furthermore, inventors leave technology leaders for domestic firms at a 1.6 pp lower rate (baseline rate: 9 percent) and for other foreign firms at a 4.6 pp lower rate (baseline rate: 20 percent) than lower-ranking MNEs.
Table 5 Local Job-switching Patterns
Citations
Knowledge spillovers may also leave traces in citation patterns. Although citations do not necessarily imply knowledge flows, a large literature starting with Jaffe, Trajtenberg, and Henderson (Citation1993) interprets the fact that patents disproportionally cite other patents filed in nearby locations as a sign that knowledge flows are geographically bounded. Following this literature, we analyze whether treatment patents of foreign technology leaders are cited less within the local economy than those of lower-ranking MNEs.
To do so, we match all patents in treated regions to observationally similar patents in other regions, using propensity-score matching (see Appendix C in the online material). Next, we calculate the ratio between the frequencies with which the treatment patent is cited (1) by patents from the treated cells and (2) by control patents. The higher this ratio, the stronger the evidence of local knowledge spillovers becomes. We estimate this spillover intensity once for patents in cells treated by technology leaders and once in cells treated by MNEs in the bottom ninety-five percentiles of the patenting distribution.
compares results in these two samples. Both samples provide evidence for local knowledge spillovers: treatment patents are cited more often by local patents as by control patents. However, whereas treatment patents of technology leaders are cited only twice as often by local than by control patents, this ratio is 5-to-1 for patents of lower-ranking firms. This suggests that technology leaders generate markedly fewer spillovers than less prominent MNEs.
Table 6 Citations from Local Patents to Treatment Patent
The same pattern emerges when we focus on spillovers to domestic firms only (i.e., when we focus on citations by domestic firms). However, because there are no control patents that cite any of the treatment patents, we cannot calculate the citation ratio in this case. Nevertheless, the absolute numbers of citations (8-to-1 versus 1-to-0) still suggest that lower-ranking firms generate more spillovers than technology leaders.
Location Choice
Alcácer and Chung (Citation2007) suggest that firms choose investment locations strategically to balance the costs and benefits of technology spillovers. These authors show that, whereas technologically less advanced firms locate preferentially in regions with high absorptive capacity, technology leaders tend to steer clear of such locations.
corroborates Alcácer and Chung’s findings. It shows that the socioeconomic structure of regions treated by technology leaders differs markedly from regions treated by technologically less advanced MNEs. Technology leaders tend to choose regions with lower levels of GDP per capita, lower levels of schooling, and lower patenting rates than less advanced firms. This supports hypothesis 5: technology leaders locate in regions with low levels of absorptive capacity.Footnote14
Table 7 Location Choices
Why then do technology leaders choose the regions they do? offers some answers to this question. First, although technology leaders are more likely to choose less developed regions compared to other MNEs, they still select regions with an intermediate level of development, not regions at the bottom of the distribution. Region-technology cells that are dismissed by all types of foreign MNEs (column 3) exhibit the lowest levels of education and the lowest GDP per capita. Second, technology leaders do not seem to compromise on the presence of public research institutes in the host region.Footnote15 In fact, whereas untreated cells host 25 percent fewer public-sector research institutes than treated cells, there is no statistically significant difference in this respect between cells that were treated by technology leaders and cells treated by lower-ranking MNEs. This corroborates the finding by Alcácer and Chung (Citation2007) that technologically advanced firms avoid regions with strong private-sector, but not public-sector, research capabilities.
Conclusion
How do new centers of technological excellence emerge? In this article, we provide one possible answer: due to the arrival of foreign firms. R&D activities of foreign MNEs can act as powerful catalysts in the development of local technological capabilities. These capabilities can spill over to local firms and attract further foreign MNEs to the region, if MNEs decide to participate in local learning processes. Research in strategic management, however, has shown that MNEs aim to maximize net not total spillovers. For the technologically most advanced MNEs, the balance between learning from, and leaking knowledge to, competitors tilts in favor of the latter, reducing MNEs’ incentives to embed themselves into the local innovation system. We test this hypothesis by studying whether technology leaders that start R&D activities in the region generate fewer spillovers than lower-ranking MNEs.
In terms of methodology, we complement the existing literature on the role of foreign MNEs in cluster genesis by means of an estimation strategy that strikes a careful balance between external and internal validity. To improve external validity, we analyze how regions around the globe become active in a wide range of technologies over a period of over thirty years. At the same time, we improve internal validity by combining matching and difference-in-differences estimation, which allows us to compare the performance of regions with foreign R&D activities to their likely counterfactual development paths without these R&D activities.
The effect of R&D activities by foreign multinationals on local innovation rates turns out to be sizeable and positive. A combination of knowledge spillovers to domestic firms and the attraction of new foreign firms to the region sets the host economy on a trajectory with persistently higher innovation rates. However, as predicted, host economies benefit less from the R&D activities of technology leaders than from those of lower-ranking MNEs. Corroborating this result, we find that technology leaders tend to invest in regions with lower absorptive capacity than lower-ranking firms do. Possibly because of this, we find that technology leaders also engage in fewer alliances and exchange fewer workers with domestic firms. However, whereas technology leaders shun the presence of private-sector research—which holds the risk that know-how spills over to competitors—they seem to value public research activities. These findings support the warning by others that strategic couplings between globally operating firms and the regional economy may lack depth (MacKinnon Citation2012) and that foreign branch plants do not automatically become embedded in the local economy (Phelps et al. Citation2003). Instead, as extensively documented in the literature on GPNs (e.g., Yeung Citation2015), the interaction between MNEs and their host economies is dynamic and involves strategic considerations on both sides.
Our article has certain limitations related to the intrinsic shortcomings of studying innovation through the lens of patent data and to the rudimentary characterization of firm strategies. For instance, we do not observe firm-internal processes such as the competition for repeat investments among an MNE’s establishments described by Phelps et al. (Citation2003). Our approach therewith follows many of the existing quantitative analyses on the topic that only take into consideration rough characteristics of investing firms such as their location choices (as in the literature on global value chains) or their home countries (as in the literature on emerging market MNEs). Although we were able to add some other elements of corporate strategy, such as MNEs’ propensity to engage in local alliances or aspects of their human resource management, a deeper analysis of the strategic decision-making that affects the internationalization of R&D activities is beyond the scope of our study.
A further limitation of our study is that our theoretical framework focuses on the strategic investment decisions by MNEs. It therewith neglects the strategic response to such investments by local actors. This interaction between MNEs and their host environments and the strategic couplings that emerge from it are more exhaustively studied in the literature on GPNs (e.g., Coe et al. Citation2004; Coe and Yeung Citation2019). However, our findings echo some issues that are raised in this literature. In particular, there are important parallels with GPN research when it comes to the differences between advanced and lagging regions in terms of the extent to which host economies manage to create a strategic coupling between local resources and MNE investments. For instance, our study highlights the importance of ensuring that foreign firms connect to the local economy when it comes to exchanging workers or engaging in strategic alliances.
A particularly important aspect of strategic coupling is public policy. Innovation is often considered to be an important aspect of economic development, and many regions have developed a range of local innovation policies. Analyzing the role of such policies in detail would have required documenting them in a comparable way for regions across the world. Although this effort is beyond the scope of the current article, understanding the role of public policy constitutes an important avenue for future research. For instance, regions often invest in public research and education through universities and other knowledge infrastructure. We showed that this public knowledge infrastructure is equally well developed in regions that host leading or lower-tier MNEs. Furthermore, many regions subsidize FDI, in particular in R&D-intensive activities. However, these subsidies may have unintended consequences. For instance, large MNEs will develop strategies to find and benefit from such subsidy schemes. These subsidies may therefore distort investment decisions and lead to poor matches between the available local resources and those required by the MNE. As a result, weaker local economies may end up attracting investments from firms for which they struggle to provide adequate resources (Midelfart-Knarvik and Overman Citation2002). In response, these firms may end up accessing such resources elsewhere through their corporate network. This, in turn, can weaken the interactions between foreign firms and their host economy, a pattern that we documented in our analysis and that echoes findings in the literature on GPNs (Coe and Yeung Citation2019).
Furthermore, by focusing on the effects of foreign research activities on patenting output within a specific region, we ignore spillovers beyond the region’s boundaries. Similarly, we do not study spillovers between technologies, even though benefits may extend to related technological fields. In this sense, our estimates put a lower bound on the spillovers that foreign MNEs generate.
Finally, regarding our identification strategy, we cannot exclude that a change in regional conditions both attracts foreign firms and increases local innovation output. Without a source of exogenous variation in R&D investments, our estimates may therefore still suffer from some bias. However, we believe that such imperfections are justified by the improved external validity that analyzing the emergence of new centers of technological excellence across a wide range of technologies and countries affords.
The article also advances our conceptual understanding of how such new technology centers emerge by systematically linking insights from economic geography on innovation clusters, from international economics and international business on MNEs’ location decisions, and from strategic management on MNEs’ incentives to participate in local learning processes. The resulting framework yields a set of hypotheses on the formation and growth of innovation clusters. Crucially, it suggests that, to understand knowledge circulation in clusters, we cannot ignore the incentives and strategic choices of the actors involved. In spite of the convincing case for studying agency in regional innovation systems made by, among others, Coenen et al. (Citation2017), the literature often ignores how the competition among profit-seeking firms affects their willingness to take part in reciprocal learning. Against this backdrop, our findings support a vast body of research on GPNs (see, for instance, Coe and Yeung Citation2019) that emphasizes the crucial importance of considering the strategic trade-offs that firms and other actors face in participating in local innovation systems when analyzing cluster dynamics.
Finally, the article offers a number of lessons for public policy. First, we show that foreign firms’ R&D activities can help regions acquire new technological capabilities. This supports the view that attracting globally operating firms represents an important policy element to support emerging clusters (e.g., Tödtling and Trippl Citation2005). In fact, the impact of foreign R&D activities is sizeable: on average, they help a region rise fourteen centiles in the world’s innovation ranks. To make the most of foreign investments, regions need to flank them by local policy. For instance, our findings point to the importance of labor pooling and strategic alliances between foreign and local firms. These interactions may be hindered by barriers associated with organizational, cultural and—often—cognitive distance. Public policy should therefore aim at reducing transaction costs between MNEs and local actors, in particular in less technologically advanced regions. For instance, regions can (co-)invest in human-capital–building institutions that reduce the gap between the local pool of human resources and the requirements of foreign firms, or they can leverage dedicated local organizations, such as regional investment promotion agencies, to facilitate the search and matching to local suppliers or to other potential local partners (Crescenzi, Di Cataldo, and Giua Citation2021).
However, whether or not knowledge transfers from foreign firms materialize depends not only on the strength of the local innovation system and its absorptive capacity but also, and crucially, on the type and strategic considerations of foreign firms themselves. This echoes words of caution about dark sides to FDI (MacKinnon Citation2012) and findings that foreign firms often end up creating enclaves or extended enclaves in their host economies (Phelps et al. Citation2003). In other words, information asymmetries and poor bargaining positions may make strategic coupling harder for less-developed regions. In fact, these regions risk brain drain, not gain, when foreign firms ring fence the most talented human capital in the region. Where they fail to engage with local actors, foreign firms may therefore further fragment the investment ecosystems of less-developed regions. When attracting foreign companies, policy makers should therefore consider complementing such efforts by policies that promote knowledge transfers, such as workforce training and local sourcing agreements. Finally, we find that the risk of a lack of embeddedness is highest when attracting technology leaders. In contrast, less prominent MNEs tend to become better connected to the local economy. Therefore, whereas policy makers often try to attract technology leaders, our study suggests that the value of such flagship FDI may be overestimated. A more prudent approach would focus on less visible players. This may not only require less generous incentives but also generate more spillovers to the local economy.
Online Appendices A, B and C
Download MS Word (672.3 KB)Acknowledgments
The authors would like to thank Ricardo Hausmann who has greatly contributed to shaping many of the arguments in this article. The authors are also grateful to participants in seminars held in Cambridge (NBER Productivity Seminar, Harvard CID Seminars, and MIT Innovation Lab), Boston (AAG Conference 2017), Birmingham (Birmingham Business School Seminars) and London (LSE Annual SERC Conference). The research leading to these results has received funding from the European Research Council under the European Union Horizon 2020 Program H2020/2014-2020 [Grant Agreement No. 639633-MASSIVE-ERC-2014-STG]. This work was supported by the Österreichische Forschungs-förderungsgesellschaft [project # 873927: ESSENCSE]. LSE internal Ethics Review procedure has been followed. The checklist reveals no further need for full ethical review of the project.
Supplementry material
Supplemental data for this article can be accessed here.
Notes
1 Own calculations based on fDi Markets data (Financial Times) for FDI (foreign direct investment) projects in the following innovation functions (Sturgeon Citation2008; Crescenzi, Pietrobelli, and Rabellotti Citation2014): Design, Development & Testing, Education & Training, and Research & Development.
2 See Harris and Robinson (Citation2003) and Haskel, Pereira, and Slaughter (Citation2007) for examples of this view in the academic literature and What Works Centre for Local Economic Growth (Citation2017) for an example in the mainstream policy discourse.
3 For a recent overview of this literature, see Coe and Yeung (Citation2019).
4 MacKinnon (Citation2012, 235), for instance, contends that “while networks and organizational routines of firms are key themes of EEG research, there is no explicit theory of the firm.” Similarly, none of the articles referenced above discusses the trade-offs that anchor firms face in deciding where to set up new establishments.:
6 These locations are by definition the places where most technological know-how is produced, and they often coincide with a firm’s main locus of decision-making. Moreover, doing so avoids issues that arise when firms place their official headquarters in countries with favorable tax or regulatory regimes, without moving any substantial production or decision-making activity there.
7 We use the organization’s 1985 composition: Australia, Austria, Belgium, Canada, Denmark, Finland, France, Germany, Great-Britain, Greece, Iceland, Ireland, Italy, Japan, Luxemburg, the Netherlands, New Zealand, Norway, Portugal, Spain, Sweden, Switzerland, Turkey, and the US. Because there are also lagging regions in OECD countries, we do include OECD regions among the potential hosts of foreign research activities.
8 This at-risk sample consists of cells with, on average, a lower income and education than cells with preexisting foreign R&D activities. The geographic composition is as follows: Europe & Central Asia: 55 percent; East Asia & Pacific: 26 percent; Latin America & the Caribbean: 6 percent; North America (excluding the US): 5 percent; South Asia: 5 percent; Middle East & North Africa: 2 percent; sub-Saharan Africa: 1 percent. The technological breakdown is Electrical & Electronics: 21 percent; Computers & Communications: 20 percent; Others technologies: 18 percent; Mechanical: 16 percent; Chemicals: 15 percent; Drugs & Medical: 11 percent.
9 Considering that ORBIS has incomplete coverage and only of company branches that are still active today, this match rate is high.
10 Fractional count is defined as the sum across all local patents of the shares of inventors that reside in the region.
11 Note that this excludes patents filed on behalf of the treatment firm itself. If we include these patents, the effect increases by twenty-nine percentage points (pp) in t = 1, 23 pp in t = 2, and 12 pp in t = 3. Treatment effects in t = 4 and t = 5 are all but unchanged, suggesting that, in the longer term, the treatment firm’s own contribution is limited.
12 That is not to say that the treatment effect on patents of foreign firms is 9 percent. Because, by definition, before treatment, the number of patents assigned to foreign firms is zero, this effect is undefined. Given that the total effect is , we have:
. Patenting by foreign firms thus raises the treatment effect by about another nine pp. Due to Jensen’s inequality, the effect will in fact be somewhat larger.
13 Treatment effects are calculated as , where
is the treatment effect. Note that for small
.
14 Note that these low levels of absorptive capacity may explain why technology leaders do not exchange many workers and engage in few technological alliances: in the regions where they invest, opportunities to do so are low, regardless of MNEs’ willingness to embed themselves in the local innovation system.
15 Data on the presence of public research institutes are taken from the GRID database: www.grid.ac. The GRID database collects information on all institutes that perform academic research, using large-scale information on publications and grants. We exclude private-sector research institutes and only use records for which we could determine that the institute had been founded before the year of the treatment.
References
- Agrawal, A., and Cockburn, I. 2003. The anchor tenant hypothesis: Exploring the role of large, local, R&D-intensive firms in regional innovation systems. International Journal of Industrial Organization 21 (9): 1227–53. doi:https://doi.org/10.1016/S0167-7187(03)00081-X.
- Alcácer, J., and Chung, W. 2007. Location strategies and knowledge spillovers. Management Science 53 (5): 760–76. doi:https://doi.org/10.1287/mnsc.1060.0637.
- Archibugi, D. 1992. Patenting as an indicator of technological innovation: A review. Science and Public Policy 19 (6): 357–68.
- Athreye, S. S., and Cantwell, J. 2007. Creating competition? Globalisation and the emergence of new technology producers. Research Policy 36 (2): 209–26. doi:https://doi.org/10.1016/j.respol.2006.11.002.
- Bathelt, H., Malmberg, A., and Maskell, P. 2004. Clusters and knowledge: Local buzz, global pipelines and the process of knowledge creation. Progress in Human Geography 28 (1): 31–56. doi:https://doi.org/10.1191/0309132504ph469oa.
- Belderbos, R., Olffen, W. V., and Zou, J. 2011. Generic and specific social learning mechanisms in foreign entry location choice. Strategic Management Journal 32 (12): 1309–30. doi:https://doi.org/10.1002/smj.938.
- Blit, J. 2018. Foreign R&D satellites as a medium for the international diffusion of knowledge. Canadian Journal of Economics/Revue Canadienne D’économique 51 (4): 1118–50. doi:https://doi.org/10.1111/caje.12359.
- Blomström, M., and Kokko, A. 1998. Multinational corporations and spillovers. Journal of Economic Surveys 12 (3): 247–77. doi:https://doi.org/10.1111/1467-6419.00056.
- Cantwell, J. 2005. Innovation and competitiveness. The Oxford handbook of innovation, ed. D. C. Mowery, J. Fagerberg, and R. R. Nelson, 543–67. Oxford: Oxford University Press.
- Cantwell, J., and Janne, O. 1999. Technological globalisation and innovative centres: The role of corporate technological leadership and locational hierarchy. Research Policy 28 (2–3): 119–44. doi:https://doi.org/10.1016/S0048-7333(98)00118-8.
- Cassiman, B., and Veugelers, R. 2002. R&D cooperation and spillovers: Some empirical evidence from Belgium. American Economic Review 92 (4): 1169–84. doi:https://doi.org/10.1257/00028280260344704.
- Castellani, D., and Lavoratori, K. 2020. The lab and the plant: Offshore R&D and co-location with production activities. Journal of International Business Studies 51 (1): 121–37. doi:https://doi.org/10.1057/s41267-019-00255-3.
- Coe, N. M., Hess, M., Yeung, H. W. C., Dicken, P., and Henderson, J. 2004. ‘Globalizing’ regional development: A global production networks perspective. Transactions of the Institute of British Geographers 29 (4): 468–84. doi:https://doi.org/10.1111/j.0020-2754.2004.00142.x.
- Coe, N. M., and Yeung, H. W. C. 2019. Global production networks: Mapping recent conceptual developments. Journal of Economic Geography 19 (4): 775–801. doi:https://doi.org/10.1093/jeg/lbz018.
- Coenen, L., Asheim, B., Bugge, M. M., and Herstad, S. J. 2017. Advancing regional innovation systems: What does evolutionary economic geography bring to the policy table? Environment and Planning C: Politics and Space 35 (4): 600–20.
- Cohen, W. M., and Levinthal, D. A. 1990. Absorptive capacity: A new perspective on learning and innovation. Administrative Science Quarterly 35 (1): 128–52. doi:https://doi.org/10.2307/2393553.
- Cortinovis, N., Crescenzi, R., and van Oort, F. 2020. Multinational enterprises, industrial relatedness and employment in European regions. Journal of Economic Geography 20 (5): 1165–205. doi:https://doi.org/10.1093/jeg/lbaa010.
- Crescenzi, R., Di Cataldo, M., and Giua, M. 2021. FDI inflows in Europe: Does investment promotion work? Journal of International Economics 132:103497. doi:https://doi.org/10.1016/j.jinteco.2021.103497.
- Crescenzi, R., Filippetti, A., and Iammarino, S. 2017. Academic inventors: Collaboration and proximity with industry. Journal of Technology Transfer 42 (4): 730–62. doi:https://doi.org/10.1007/s10961-016-9550-z.
- Crescenzi, R., Gagliardi, L., and Iammarino, S. 2015. Foreign multinationals and domestic innovation: Intra-industry effects and firm heterogeneity. Research Policy 44 (3): 596–609. doi:https://doi.org/10.1016/j.respol.2014.12.009.
- Crescenzi, R., Pietrobelli, C., and Rabellotti, R. 2014. Innovation drivers, value chains and the geography of multinational corporations in Europe. Journal of Economic Geography 14 (6): 1053–86. doi:https://doi.org/10.1093/jeg/lbt018.
- Csáfordi, Z., Lőrincz, L., Lengyel, B., and Kiss, K. M. 2018. Productivity spillovers through labor flows: Productivity gap, multinational experience and industry relatedness. Journal of Technology Transfer 45 (1): 86–121. doi:https://doi.org/10.1007/s10961-018-9670-8.
- D’Este, P., and Patel, P. 2007. University–industry linkages in the UK: What are the factors underlying the variety of interactions with industry? Research Policy 36 (9): 1295–313. doi:https://doi.org/10.1016/j.respol.2007.05.002.
- Elekes, Z., Boschma, R., and Lengyel, B. 2019. Foreign-owned firms as agents of structural change in regions. Regional Studies 53 (11): 1603–13. doi:https://doi.org/10.1080/00343404.2019.1596254.
- Feldman, M. 2003. The locational dynamics of the US biotech industry: Knowledge externalities and the anchor hypothesis. Industry and Innovation 10 (3): 311–29. doi:https://doi.org/10.1080/1366271032000141661.
- Feldman, M., and Braunerhjelm, P. 2006. The genesis of industrial clusters. Cluster genesis: Technology-based industrial development, ed. M. Feldman and P. Braunerhjelm, 1–13. Oxford: Oxford University Press.
- Fosfuri, M., Motta, T., and Ronde, P. 2001. Foreign direct investment and spillovers through workers’ mobility. Journal of International Economics 53 (1): 205–22. doi:https://doi.org/10.1016/S0022-1996(00)00069-6.
- Fu, X. 2007. Foreign direct investment, absorptive capacity and regional innovation capabilities: Evidence from China. Oxford Development Studies 36 (1): 89–110. doi:https://doi.org/10.1080/13600810701848193.
- Gennaioli, N., La Porta, R., De Silanes, F. L., and Shleifer, A. 2014. Growth in regions. Journal of Economic Growth 19 (3): 259–309. doi:https://doi.org/10.1007/s10887-014-9105-9.
- Giuliani, E. 2007. The selective nature of knowledge networks in clusters: Evidence from the wine industry. Journal of Economic Geography 7 (2): 139–68. doi:https://doi.org/10.1093/jeg/lbl014.
- Glaeser, E. L., Kallal, H. D., Scheinkman, J. A., and Shleifer, A. 1992. Growth in cities. Journal of Political Economy 100 (6): 1126–52. doi:https://doi.org/10.1086/261856.
- Hall, B. H., Jaffe, A. B., and Trajtenberg, M. 2001. The NBER patent citation data file: Lessons, insights and methodological tools (No. w8498). Cambridge, MA: National Bureau of Economic Research.
- Harris, R., and Robinson, C. 2003. Foreign ownership and productivity in the United Kingdom estimates for UK manufacturing using the ARD. Review of Industrial Organization 22 (3): 207–23. doi:https://doi.org/10.1023/A:1023622407571.
- Haskel, J. E., Pereira, S. C., and Slaughter, M. J. 2007. Does inward foreign direct investment boost the productivity of domestic firms? Review of Economics and Statistics 89 (3): 482–96. doi:https://doi.org/10.1162/rest.89.3.482.
- Hausmann, R., and Rodrik, D. 2003. Economic development as self-discovery. Journal of Development Economics 72 (2): 603–33. doi:https://doi.org/10.1016/S0304-3878(03)00124-X.
- Henderson, V., Kuncoro, A., and Turner, M. 1995. Industrial development in cities. Journal of Political Economy 103 (5): 1067–90. doi:https://doi.org/10.1086/262013.
- Iammarino, S., and McCann, P. 2006. The structure and evolution of industrial clusters: Transactions, technology and knowledge spillovers. Research Policy 35 (7): 1018–36. doi:https://doi.org/10.1016/j.respol.2006.05.004.
- Isaksen, A., Tödtling, F., and Trippl, M. 2018. Innovation policies for regional structural change: Combining actor-based and system-based strategies. In New avenues for regional innovation systems–Theoretical advances, empirical cases and policy lessons, eds. A. Isaksen, R. Martin, and M. Trippl, 221–38. Cham, Switzerland: Springer.
- Jaffe, A. B., Trajtenberg, M., and Henderson, R. 1993. Geographic localization of knowledge spillovers as evidenced by patent citations. Quarterly Journal of Economics 108 (3): 577–98. doi:https://doi.org/10.2307/2118401.
- Javorcik, B. 2004. Does foreign direct investment increase the productivity of domestic firms? In search of spillovers through backward linkages. American Economic Review 94 (3): 605–27. doi:https://doi.org/10.1257/0002828041464605.
- Keller, W., and Yeaple, S. R. 2009. Multinational enterprises, international trade, and productivity growth: Firm-level evidence from the United States. Review of Economics and Statistics 91 (4): 821–31. doi:https://doi.org/10.1162/rest.91.4.821.
- Kogler, D. F., Essletzbichler, J., and Rigby, D. L. 2017. The evolution of specialization in the EU15 knowledge space. Journal of Economic Geography 17 (2): 345–73.
- Lewin, A. Y., Massini, S., and Peeters, C. 2009. Why are companies offshoring innovation? The emerging global race for talent. Journal of International Business Studies 40 (6): 901–25. doi:https://doi.org/10.1057/jibs.2008.92.
- Liu, X., and Buck, T. 2007. Innovation performance and channels for international technology spillovers: Evidence from Chinese high-tech industries. Research Policy 36 (3): 355–66. doi:https://doi.org/10.1016/j.respol.2006.12.003.
- MacKinnon, D. 2012. Beyond strategic coupling: Reassessing the firm-region nexus in global production networks. Journal of Economic Geography 12 (1): 227–45. doi:https://doi.org/10.1093/jeg/lbr009.
- Maskell, P., and Malmberg, A. 1999. Localised learning and industrial competitiveness. Cambridge Journal of Economics 23 (2): 167–85. doi:https://doi.org/10.1093/cje/23.2.167.
- McCann, P., and Acs, Z. J. 2011. Globalization: Countries, cities and multinationals. Regional Studies 45 (1): 17–32. doi:https://doi.org/10.1080/00343404.2010.505915.
- McCann, P., and Mudambi, R. 2004. The location behavior of the multinational enterprise: Some analytical issues. Growth and Change 35 (4): 491–524. doi:https://doi.org/10.1111/j.1468-2257.2004.00259.x.
- Menzel, M. P., and Fornahl, D. 2010. Cluster life cycles—Dimensions and rationales of cluster evolution. Industrial and Corporate Change 19 (1): 205–38. doi:https://doi.org/10.1093/icc/dtp036.
- Midelfart-Knarvik, K. H., and Overman, H. G. 2002. Delocation and European integration: Is structural spending justified? Economic Policy 17 (35): 321–59. doi:https://doi.org/10.1111/1468-0327.00091.
- Neffke, F. M. H. 2019. The value of complementary co-workers. Science Advances 5 (12): eaax3370. doi:https://doi.org/10.1126/sciadv.aax3370.
- Neffke, F., Hartog, M., Boschma, R., and Henning, M. 2018. Agents of structural change: The role of firms and entrepreneurs in regional diversification. Economic Geography 94 (1): 23–48. doi:https://doi.org/10.1080/00130095.2017.1391691.
- Ning, L., Wang, F., and Li, J. 2016. Urban innovation, regional externalities of foreign direct investment and industrial agglomeration: Evidence from Chinese cities. Research Policy 45 (4): 830–43. doi:https://doi.org/10.1016/j.respol.2016.01.014.
- Phelps, N. A. 2008. Cluster or capture? Manufacturing foreign direct investment, external economies and agglomeration. Regional Studies 42 (4): 457–73. doi:https://doi.org/10.1080/00343400701543256.
- Phelps, N. A., and Fuller, C. 2000. Multinationals, intracorporate competition, and regional development. Economic Geography 76 (3): 224–43. doi:https://doi.org/10.2307/144291.
- Phelps, N. A., Mackinnon, D., Stone, I., and Braidford, P. 2003. Embedding the multinationals? Institutions and the development of overseas manufacturing affiliates in Wales and North East England. Regional Studies 37 (1): 27–40. doi:https://doi.org/10.1080/0034340022000033385.
- Poole, J. P. 2013. Knowledge transfers from multinational to domestic firms: Evidence from worker mobility. Review of Economics and Statistics 95 (2): 393–406. doi:https://doi.org/10.1162/REST_a_00258.
- Saxenian, A. 2007. The new Argonauts: Regional advantage in a global economy. Cambridge, MA: Harvard University Press.
- Shaver, J. M., and Flyer, F. 2000. Agglomeration economies, firm heterogeneity, and foreign direct investment in the United States. Strategic Management Journal 21 (12): 1175–93. doi:https://doi.org/10.1002/1097-0266(200012)21:12<1175::AID-SMJ139>3.0.CO;2-Q.
- Singh, J., and Agrawal, A. K. 2011. Recruiting for ideas: How firms exploit the prior inventions of new hires. Management Science 57 (1): 129–50. doi:https://doi.org/10.1287/mnsc.1100.1253.
- Song, J., Almeida, P., and Wu, G. 2003. Learning by hiring: When is mobility more likely to facilitate interfirm knowledge transfer? Management Science 49 (4): 351–65. doi:https://doi.org/10.1287/mnsc.49.4.351.14429.
- Storper, M., and Venables, A. J. 2004. Buzz: Face-to-face contact and the urban economy. Journal of Economic Geography 4 (4): 351–70. doi:https://doi.org/10.1093/jnlecg/lbh027.
- Sturgeon, T. J. 2008. Mapping integrative trade: Conceptualising and measuring global value chains. International Journal of Technological Learning, Innovation and Development 1 (3): 237–57. doi:https://doi.org/10.1504/IJTLID.2008.019973.
- Tödtling, F., and Trippl, M. 2005. One size fits all? Towards a differentiated regional innovation policy approach. Research Policy 34 (8): 1203–19. doi:https://doi.org/10.1016/j.respol.2005.01.018.
- Trippl, M., Grillitsch, M., and Isaksen, A. 2018. Exogenous sources of regional industrial change: Attraction and absorption of non-local knowledge for new path development. Progress in Human Geography 42 (5): 687–705. doi:https://doi.org/10.1177/0309132517700982.
- Von Zedtwitz, M., and Gassmann, O. 2002. Market versus technology drive in R&D internationalization: Four different patterns of managing research and development. Research Policy 31 (4): 569–88. doi:https://doi.org/10.1016/S0048-7333(01)00125-1.
- What Works Centre for Local Economic Growth. 2017. Investment Promotion Agencies (IPAs). London: WWG.
- Yeung, H. W. C. 2015. Regional development in the global economy: A dynamic perspective of strategic coupling in global production networks. Regional Science Policy and Practice 7 (1): 1–23. doi:https://doi.org/10.1111/rsp3.12055.
- Zucker, L. G., Darby, M. R., and Armstrong, J. 1998. Geographically localized knowledge: Spillovers or markets? Economic Inquiry 36 (1): 65–86. doi:https://doi.org/10.1111/j.1465-7295.1998.tb01696.x.