
 ?Mathematical formulae have been encoded as MathML and are displayed in this HTML version using MathJax in order to improve their display. Uncheck the box to turn MathJax off. This feature requires Javascript. Click on a formula to zoom.
Abstract
This article investigates business services employment as a driver of income segregation. Theory and intuition suggest that two pathways operate simultaneously. First, business services are marked by huge internal differentiation, low union density, and individualized pay schemes, all of which raise income inequality, and, in turn, income segregation. Second, business services are subject to strong agglomeration economies, which increase the importance of the employer–employee relationship: corporations tend to locate in the vicinity of their staff, and the staff favor residential locations close to actual and potential workplaces. I test these ideas with annual data from metropolitan areas in Norway, covering the period from 1980 to 2018. I measure segregation at the census tract level, and control for education, nonemployment, immigration, age, and gender. A key finding is that business services, particularly financial activities, exert a strong influence on income inequality but also, and independent of the former effect, on income segregation. The latter impact is surprisingly strong, whereas the impact on inequality has a limited ripple potential, that is, it affects neighborhood sorting to a lesser degree than expected. A suggested explanation for the pattern is, first, that public policies reduce individual and spatial inequalities, and, second, that public policies fail to influence the organization and operation of business services.
Rising economic segregation is a widespread concern, as evidenced by studies from the US (Watson Citation2009; Reardon and Bischoff Citation2011), Canada (Chen, Myles, and Picot Citation2012) and Europe (Musterd et al. Citation2017). This trend is surprising if one considers the global-city debate in the 1990s and early 2000s, where many scholars failed to find evidence of increasing sociospatial inequalities (for a summary of the debate, see Hamnett Citation2021). It is, on the other hand, unsurprising if one considers the documentation of increasing economic inequality in the same countries and regions (Atkinson Citation2003; Piketty Citation2015). A greater level of economic disparity implies that rich and poor households enter the housing market with different economic constraints. To quote Watson (Citation2009, 822), “the rich will be more likely to outbid the poor for high-quality neighborhoods.”
Efforts to understand these changes spread in several directions, but a common aim is to address the inequality-segregation association. US research documents variable outcomes across groups, regions, and geographic scales (Reardon and Bischoff Citation2011; Bischoff and Reardon Citation2014; Owens, Reardon, and Jencks Citation2016). European research, for its part, shows that nation-specific factors, particularly welfare regimes and housing politics, mitigate the impact of higher inequality (Musterd et al. Citation2017). Recent European research has also pointed to the importance of time-critical processes, with a huge delay between increasing inequality and increasing segregation (Tammaru et al. Citation2020).
What is less understood is the relative importance of structural economic change. Shifts from manufacturing industries to service industries has the potential to increase economic segregation through several mechanisms, with variable impact across the spectrum of services. A major argument in the literature is that business services are the most important ones: firms and individuals within banking, auditing, marketing, advertising, consultancy, insurance, law, and related activities reap benefits from expanded global markets (Sassen Citation2001); they also diverge from traditional segments of the economy (e.g., manufacturing, construction, distribution, education, health, and administration) through different institutional arrangements (Kristal and Cohen Citation2017).
An influential contribution to this debate is Chris Hamnett’s (Citation2003) study of London “in the global area.” Hamnett paints a picture of a new industrial space, consisting of high-rise offices and fancy cultural quarters, which is linked to residential space through the occupational balance between different industries. The dominant perspective is that economic change raises economic inequality, which in turn raises economic segregation. Aside from this two-stage process, where inequality appears as a mediator between business expansion and residential space, there is also a straight pathway between industrial development and neighborhood formation: “In the new post-industrial city, proximity to the centre, and to the river, is increasingly important” (Hamnett Citation2003, 248). Rather similar arguments appear in Saskia Sassen’s work on global cities, although with social and spatial polarization as the central outcomes. She writes, as an example, that “proximity emerges as a key to the activity of obtaining information; that is, information will circulate through specific places and not others” (Sassen Citation2001, 104).
My aim in the current article is to revisit the sketched industry–inequality–segregation theme with a rigorous methodological design. The questions I address are
Does the size of the business services sector translate into higher income inequality and further into higher income segregation?
Is there a direct impact from business services employment on income segregation?
The context of the study is Norway’s three largest cities, Oslo, Bergen, and Trondheim, and their surrounding hinterland. I investigate changes with annual data that stretch all the way back to 1980, with measurements of segregation at the census tract level. I allow some variation in the inequality–segregation association by using three alternative time lags between business services employment and segregation. My main empirical tool is a structural equation model (SEM), added by location quotients. I measure segregation by the rank-order information theory index (HR), which reflects income ranks (percentiles) instead of actual incomes. HR, contrary to many alternatives, does not conflate changes in the level of inequality with changes in residential sorting across neighborhoods (Reardon and Bischoff Citation2011).
Given the application of HR, there is no need for a rank-based measure of income inequality. For the sake of simplicity, I therefore use the Gini coefficient, which is the standard summary of income inequality. Other factors in the analysis are education, nonemployment, and immigration. Demographics aside from immigration are not a visible part of the model, but I weight all measurements by age and gender.
The main contributions of the article are twofold. First, I demonstrate that business services employment is a major driver of both income inequality and income segregation. This is an improvement over explanations that emphasize broader economic and technological changes. Second, I add nuance to the common idea that state policies in the Nordic countries mitigate sociospatial inequalities. There are certainly signs of such influences in this material, but they point in a diffuse, general direction. In brief, public authorities may reduce inequality and weaken the association between inequality and segregation. What is more difficult, apparently, is to influence the operation and organization of business services. These activities use their powerful resources in the competition for urban space, partly driven by agglomeration economies. The ultimate outcome is increasing economic segregation in the context of relatively strong welfare policies.
Throughout the article I refer to economic segregation as an umbrella concept that incorporates separation in residential space by income, wealth, or social class. Income segregation covers separation by income alone. Prefixes to inequality have the same thematic basis but refer to divisions between individuals, families, or households.
The rest of the article contains four sections. I start with a discussion of direct and indirect associations between business services and economic segregation. I then present data and measures, followed by a presentation of descriptive and analytical results, before I end with some reflections on economic segregation in the Norwegian context.
Theoretical Framework
The idea that economic composition affects economic inequality is famously expressed in Simon Kuznets’s (Citation1955) inverted U curve hypothesis. Exploring historic data, Kuznets (Citation1955) found that inequality increases in an initial phase, as workers move from less productive to more productive sectors, and declines in a subsequent phase, as lower social strata gain higher economic shares through intervention and transformation of existing institutions.
As noted above, many countries and cities have now entered a phase of increasing or intractably high inequality. This fact, and a concurrent trend toward higher-factor income, has often led to a wholesale dismissal of Kuznets’s formulation. Some scholars, however, have tried to liberate parts of the formulation from its surrounding modernization framework. Korzeniewicz and Moran (Citation2005) point at two theoretical arguments that deserve continued attention. The first one concerns inequality implications of transitions between different sectors of the economy. Worker mobility across sectors of variable productivity may appear at any point in time, with overlapping sequences and a constant appearance of new patterns. We should therefore expect a resurgence of inequality in advanced economies, following expansion and contraction in different sectors. The second argument is that institutions and politics may have regressive as well as progressive outcomes, sometimes with opposite patterns within and across nations and regions. By implication, institutions and social forces may also shape productivity differentials and the subsequent employment transitions (Korzeniewicz and Moran Citation2005; Kristal and Cohen Citation2017).
Looking at Norway, there is no doubt that institutions matter. This applies to state-led wage setting, progressive taxation, and social insurance against adverse events (unemployment, disability, sickness, and accidents), all of which may offset growth of income inequality (Barth, Moene, and Wallerstein Citation2003). The same measures, however, are less effective in business services, since these industries are marked by low/declining union density and alternative pay schemes. It is therefore fully comprehensible that income inequality has grown far more in metropolitan Oslo than in Norway as a whole (see Wessel Citation2013).
Other characteristics that matter are the utilization of new technology (Guerreri and Meliciani Citation2005) and the tendency toward profit-sharing (Philippon and Reshef Citation2012; Lin and Tomaskovic-Devey Citation2013; Keller and Olney Citation2021) within business services. The sum of it all is that employees within these industries face a high level of internal inequality. A less important factor is Kuznets’s (Citation1955) compositional effect: business services appear to attract skilled workers from the remaining economy (Wessel Citation2013). For the purpose here, however, I will not attempt to separate the former effect from the latter. Their aggregate impact, as I see it, is to raise economic inequality, just like Marchand, Dubé, and Breau (Citation2020) document for Canada. Path 1 in illustrates the link.
Figure 1. Theoretical framework.
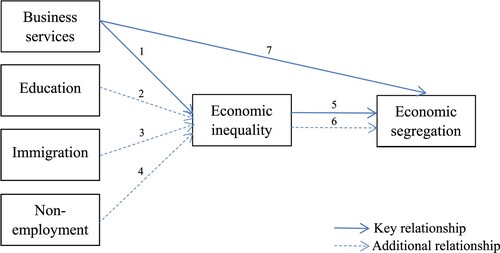
It is important to recognize that business services are themselves a highly diverse grouping. A burgeoning field of financialization studies (Epstein Citation2005; Pike and Pollard Citation2010; Wójcik Citation2012; Ioannou and Wójcik Citation2021) suggests that banks, insurance companies, funds, and broker–dealers play a more important role than activities of a more technical, managerial, or consultancy nature. Documentation of developments in wage premiums (Philippon and Reshef Citation2012; Lin and Tomaskovic-Devey Citation2013) supports the same idea: finance and insurance have a larger potential to raise inequality and segregation than the remaining sector.
Other sources of heterogeneity in the course of development are education, nonemployment, and immigration. Paths 2 to 4 in account for the confounding impact of these factors.
Education affects economic inequality in a similar way as labor-force shifts between industrial sectors. Technological change and growth in advanced activities increase the price of highly educated workers, which automatically implies that less educated workers lag behind (Gregorio and Lee Citation2003). The gap that appears is a nonlinear function of education diffusion, that is, the gap is large in the early phase of skill deficits and subsequently smaller as countries invest in education and training (Gregorio and Lee Citation2003). Logically, there are also differences within countries, since improvements in educational attainment vary between regions (Rodríguez-Pose and Tselios Citation2009). Nonemployment is a heterogenous category that captures both unemployment and nonparticipation in the labor market. Its impact on inequality includes declining unskilled wages, increasing disparities within skill groups, and shifts from middling to high-end jobs (Acemoglu Citation1999). A partly overlapping impact emerges when women enter the labor market or switch from part-time to full-time work. Such changes may affect income inequality in both directions, but most research, including a comparative European study, observes a cushioning effect (Kollmeier Citation2013). The third factor, immigration, impinges on economic inequality through reduced demand for native labor, through different distributions of skill in the native and immigrant populations, and through internal inequality in the immigrant population (Card Citation2009).
The association between economic inequality and economic segregation is to some extent self-explaining. By definition, if there were no economic inequality, there would be no economic segregation (Reardon and Bischoff Citation2011). It is nonetheless difficult to foresee how the association plays out in real-world situations. Many factors complicate the transmission of individual/household inequality onto geographic space. First, the transmission requires that residential preferences correlate with income, either because neighborhoods vary in quality or because residents with variable incomes prefer neighbors like themselves. Second, public policies vary across cities and nations, and create subsequent variations in the hierarchy of neighborhoods (Musterd et al. Citation2017). One would expect that policies that reduce or remove support to disadvantaged groups strengthen the influence of economic inequality on income segregation. In practice, however, there are many factors that confound the association, one of which is inertia in the composition of neighborhoods. It takes many years before new policies change the built-up landscape, and an even longer time before the landscape emerges with a new socioeconomic profile. A recent comparison of eight European cities goes systematically into the matter and concludes that changes in economic segregation lag behind changes in household inequality by roughly ten years (Tammaru et al. Citation2020).
As the research questions indicate, my interest here lies primarily with industrial shift. I therefore illustrate the inequality-segregation link by two paths in , representing changes in business services (path 5) and the control variables (path 6).
Another complication concerns economics of scale for different industries. There is clear evidence that finance and other business services benefit disproportionately from urban agglomeration economies (Sassen Citation2001; Ioannou and Wójcik Citation2021). The background for this pattern is a previous phase of horizontal and vertical disintegration of activities. Services that once belonged to large industrial corporations are now typically broken down into highly specialized activities, either in separate firms or in firms that are linked to an umbrella organization (Scott Citation1988). There is, in consequence, an intricate web of externalized transactions that increases linkage costs per unit, which in turn induces firms to cluster in the same areas (Scott Citation1988.). As a further implication, we may also identify a two-way interdependence between employers and employees. Employers tend to favor locations in proximity to residential concentrations of their main labor force. An accidental location, in other words, is less attractive if that location lacks qualified labor or, alternatively, if transport linkages go in the wrong direction. Employees, on the other hand, choose residential location within ready access to attractive workplaces (Scott Citation1988).
The geographies that emerge from these requirements and processes are bound to vary from city to city. One common trait, nonetheless, is a concentration of activities in downtown areas. Location in the central business district maximizes access to markets, business partners, and public institutions. It may also provide social prestige to owners, managers, and employees. All of this leads to residential evolution, with gentrification of already gentrified areas (super-gentrification) as the latest stage (Lees Citation2003).
I explore direct and indirect effects through a SEM model that corresponds to . This methodology allows me to assess the mediating impact of inequality with great efficacy and little statistical noise. Using SEM is far more rational and yields more reliable results than a set of regression models that cover all paths in .
There are two major threats to the model. First, the model is quite simple and thus susceptible to omitted variable bias. The lack of housing-market variables is particularly unfortunate, since there have been huge changes in this sector. A wave of new policies in the 1980s removed all price ceilings and gave more or less free access to housing credit. These changes may have raised the threshold for access to high-quality neighborhoods, at least in the longer run. A comfortable circumstance, on the other hand, is that economic segregation started to increase much later, in some cases up to two decades later. Equally important is the theoretical and practical link between business services employment and deregulation policies. Emergence of new financial agencies and growth of unregulated credit preceded deregulation of the credit market and put pressure on other parts of the economy (Norwegian Government Citation2009). All of this suggests that growth of business services employment is a more fundamental factor than housing-market policies.
The second threat to the model has the same origin (omitted variable bias) but unfolds differently. Some preferences (e.g., regarding neighbors and public goods) correlate with both income inequality and income segregation (Reardon and Bischoff Citation2011). In consequence, one cannot automatically assume that residuals in these two variables are completely independent of each other. The best solution to the problem, which I employ, is to add a two-way link between the two error terms.Footnote1
The SEM model does not reveal the timing and geography of key variables. I therefore estimate location quotients for two groups: (1) all employees in the selected industries and (2) employees in the selected industries with income in the fourth quartile.
Data and Measures
The data I employ derive from administrative registers and censuses owned by Statistics Norway, the Norwegian Tax Administration, and other public agencies. I aggregate individuals at the metropolitan level in the measurement of business services, education, nonemployment, immigration, and economic inequality, and at the census tract level in the measurement of economic segregation. The former set spans from 1980 to 2018, with information for each year and region. I adjust these variables to the choice of time lag, so that each measurement reflects the condition at an earlier stage. The second set has the same end year, 2018, but starts in 1990.
Regions and Boundaries
All regions in the study, particularly Bergen, have expanded outward since 1980. My solution to this problem is to determine boundaries at the start of each decade, using census data and register statistics. I include municipalities in the hinterland on two conditions: (1) they contain at least 25 percent commuting to the core municipality and (2) they share one or more boundaries with the rest of region.
Some initial trials included four, five, and six metropolitan areas. These extensions gave more power to the analysis, but they also introduced some bias due to smaller census tracts, huge variation in metropolitan size, and economic idiosyncrasies.Footnote2
Segregation Measure
Residential sorting of people by income is a classic, but rather underdeveloped, research field. Standard indices in this research tend to define segregation as a ratio of the variation between neighborhoods, typically relying on the variance of incomes, the variance of logged incomes, the standard deviation of incomes, or the neighborhood sorting index. Using these measures, one cannot fully separate the mobility impact from the impact of economic redistribution. Another common approach is to pick a measure from the study of ordinal categories (ethnic groups, education groups, age groups, etc.). The dissimilarity index, in particular, is a popular and intuitive measure that appears in several recent studies (Musterd et al. Citation2017; Tammaru et al. Citation2020). A problem in many cases, however, is that estimations of the dissimilarity index rely on arbitrary divisions. Comparing some top income group to a bottom group, or the middle to the bottom, are bound to represent some metropolitan regions better than others.
A more suitable approach is to create ordinal categories at all levels of income. Some new indices do just that, one of which is the rank-order information theory index (HR), developed by Sean Reardon and colleagues. HR exploits information from all percentiles in the distribution and is therefore a superior alternative to the comparison of selected fractions. It is also superior to classic variation-ratio measures, since percentiles lack a mechanical connection to actual inequality. HR is further beneficial in pure statistical terms, as it is (1) scale invariant (doubling the income of all has no effect on estimates) and (2) sensitive to transfers (HR declines when rich people move to poorer neighborhoods and increases when rich people flock together) (Reardon and Bischoff Citation2011).
The basis of HR is Theil’s entropy index H (Theil and Finizza Citation1971), which is common in studies of Black/White segregation. HR utilizes H in pairwise estimations of residents above and below each point (percentile) in the distribution. Following Reardon (Citation2011), HR may be written as
(1)
(1) where
is the cumulative proportion of residents in neighborhood n with incomes at or below percentile 100x
, T is the population of the metropolitan area, and
is the population of neighborhood n. The term inside the brackets is the Theil inequality index, which measures the distance between
and
.
HR ranges from 0 (no segregation) to 1 (maximum segregation), but it is difficult to assign an intuitive meaning to specific values. The independence between income inequality and HR implies that neighborhood size exerts a certain impact on estimated values, with an upward bias in small populations. Reardon and Bischoff (Citation2011) compensate for this bias by drawing random samples of equal size across space and time. A later study switches to mean size per neighborhood, since changes and differences in the neighborhood structure may bias estimates in both directions (Bischoff and Reardon Citation2014). I use this latter alternative, employing samples with exactly the same mean (150 residents in the age span thirty to fifty-nine) across all region-years. I weight all estimates by five-year age spans and gender, that is, all single numbers rely on twenty prior calculations.
Using thirty years as the lower age limit is a trade-off between several concerns. I aim to cover a large part of the labor force, but not at the expense of accuracy. Increasing university enrollment and increasing part-time work among students represent obvious sources of error in a study that stretches over four decades.
Inequality Measure
I measure income inequality by the Gini coefficient (G), which corresponds in several respects to HR. G, just like HR, is invariant to growth of income, as a uniform growth will not change the results. G is also invariant to scale, meaning that the size of the region has no automatic effect on measured inequality. A further similarity with HR is that G changes more easily when transfers occur around the median. G varies from 0 (no inequality) to 1 (maximum inequality). One among many formal ways to write G is
(2)
(2) where
is the number of income recipients,
is mean income,
is the rank position, and
is incomes ranked from lowest to highest.
I weight G by gender and five-year age spans.
Definition of Income
The topic of the study suggests that earnings are the most relevant source of income. A convenient earnings concept in Norwegian statistics is pensionable income, which includes wages, self-employment incomes, sickness benefits, and work assessment allowances. The underlying distribution is continuous, without predefined subcategories.
Other Variables
Business services employment is the share of individuals aged thirty to fifty-nine who work in finance, insurance, real-estate activities, legal services, accounting, auditing, tax consultancy services, market research, management consultancy, advertising, and other business services, measured for each region and weighted by five-year age spans and gender. The registration is annual for each region, except for two periods: I employ linear interpolation between 1980 and 1990, and further between 1990 and 2000.
Appendix A provides a full list of codes in the NACE (1990–2018) and ISIC (1980–1989) classification systems. The list is the outcome of intensive efforts to incorporate the same type of activities in all phases of the observation period. In brief, there are two opposite challenges. First, many growing activities gain separate codes in the course of time. Second, some activities disappear, become drastically reduced, or lose their status as service professions. The end result of these trade-offs is a fairly long list that overlaps substantially with definitions of knowledge-intensive services and the more recent category financial and business services. Note, for instance, that I exclude cleaning, rental and leasing activities, caretaker services, and repair of office machinery. I also exclude research, since much of this activity takes place within the public sphere. Despite these restrictions, there is still substantial heterogeneity in the remaining category. I therefore perform a follow-up analysis that separates between two subsets: (1) finance and insurance and (2) other business services. Finance and insurance correspond to K, or codes 64–66, in the latest version of the NACE system (see Appendix A).
Education is the share of individuals aged thirty to fifty-nine with education at the bachelor level or higher, measured for each region-year and weighted by five-year age spans and gender.
Nonemployment is the share of individuals aged thirty to fifty-nine without registered employment, measured for each region-year and weighted by five-year age spans and gender.
Immigration is the share of immigrants (first generation) aged twenty to fifty-nine from Asia, Africa, Latin America, and Eastern Europe, measured for each region-year and weighted by five-year age spans and gender. The main reason why I switch to a wider age span for this variable is that labor migration, with many young individuals, has increased tremendously in the last decades. The influx of craftsmen and unskilled workers from Eastern Europe affects the price of labor, with further implications for inequality and segregation.
Time Lag
Changes in industrial composition, employment, immigration, and levels of education affect the distribution of earnings through several mechanisms, some of which involve little or no delay. Transfer of employees across sectors of variable productivity exerts, as described above, a more or less instant impact on total inequality. Much of the same applies to increasing full-time employment, which reduces low-end inequality; to increasing immigration, which typically reduces wages in the lower end of the labor market; and to education expansion, which reduces the premium on skills. For such reasons, I do not employ any lag between the four exogenous variables and income inequality. The mechanisms that link inequality and business services employment to segregation are rather different. It may take some time before increasing or decreasing inequality affects the structure of housing-market signals. When signals are changed, there may still be a lag before significant residential replacements emerge (Wessel Citation2016; Tammaru et al. Citation2020). A final factor is that business services employees and business services corporations engage in mutual adjustments. I therefore employ three alternative lags, one, five, and ten years, in the measurement of segregation. The underlying logic is that different mechanisms may have different time horizons. For instance, while employees may respond rapidly to relocation of business corporations, the speed with which neighborhood geographies change is far slower.
Results
Descriptive Statistics
presents a summary for all variables that are directly or indirectly included in the analysis. A key point is that Oslo differs in several respects from Bergen and Trondheim. The business services sector is larger in Oslo; there is also a higher level of income inequality, a sharper spatial separation between income groups, a larger share of highly educated individuals, and a larger share of immigrants.
Table 1 Descriptive Statistics
provides additional nuances to this picture. The upper left plot shows that business services have expanded greatly in all three regions, starting at 10 (Oslo) and 5–6 percent (Bergen and Trondheim) in 1980. Oslo moved to a more stable track some years into the new millennium and was soon followed by Bergen and Trondheim. At a more detailed level, it is not finance and insurance, as one might think, but rather a host of other business services, that increase employment. Finance and insurance rose slowly until the mid-1990s but have been stable or slowly declining since that point.Footnote3
Figure 2. Key variables by region and year: percentage employed in business services (upper left), percentage employed in finance and insurance (upper middle), percentage employed in other business services (upper right), the Gini coefficient of income inequality (lower left), and the HR index of income segregation (lower right).
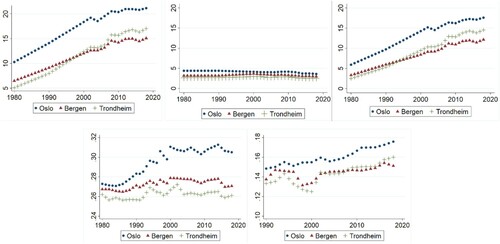
The lower left plot in , relating, to income inequality, resembles a classic maturation curve, with initial growth followed by stagnation. Much of the change occurred from the late 1980s to around 2005 although with some differences across the three regions. Oslo and Bergen started on the upward-sloping trend before Trondheim, but most of all the change in Oslo appears to be more permanent than the changes in Bergen and Trondheim. Finally, in the lower right plot in , I also include a plot for income segregation. The pattern here is more uniform, particularly in the current century. HR has moved upward in all regions, starting in the decade between 1995 and 2005. Some moderate fluctuations in the late 1990s and early 2000s conform closely to employment increases, wage increases, and removal of credit regulations. The phase prior to this, roughly between 1988 and 1992, was marked by high unemployment, tight credit restrictions, and declining housing prices. Many households were more or less locked to their current housing, that is, they could not adjust their location in accordance with changes in income or need for space. The economic upturn was equally strong and triggered enhanced upward residential mobility over several years (for a summary of developments, see Wessel Citation2016).
Model Results
reports three sets of outcomes from the SEM model, with predictor variables stretching from 1989 to 2017 (one year’s lag), from 1985 to 2013 (five years’ lag), and from 1980 to 2008 (ten years’ lag). The columns in the table include direct impacts of exogeneous variables on inequality (columns 1 and 5), direct impacts of business services on segregation (columns 2 and 6), indirect impacts of exogenous variables on segregation (columns 3 and 7), and total impacts of exogeneous variables and inequality on segregation (columns 4 and 8). I also include summary indices (R square), added by the Akaike information criterion (AIC). For simplicity, I do not provide the whole battery of fit indices. The chosen measures provide a sufficient basis for model assessment, given the theoretical framework, the number of free parameters, and the efficiency of the current setup. Looking at R square, the model explains 95 and 79 percent of the variance in inequality and segregation, respectively. Note also that AIC declines as the period increases from one year to five years and from five years to ten years. Using ten years’ lag, therefore, yields a slightly better fit than the shorter alternatives.
Table 2 SEM Estimations of Income Segregation
The most important coefficients in concern business services. There is a strong and positive association between growth in these industries and income inequality, although with decaying impact over time (p difference between one and ten years’ lag < 0.001). A somewhat weaker but more consistent association exists between business services and segregation, whereas the impact that goes through inequality is dependent on time lag (p difference between one and ten years’ lag < 0.05). Even the direct impact of inequality on segregation gains strength and significance in the longer run (p difference between one and ten years’ lag < 0.05). The less important parameters go in both directions. Education has a negative impact on inequality and a nonsignificant or negative impact on segregation. Immigration raises inequality to the same level, or almost the same level, as business services do, but little of this effect spills over into income segregation. The final factor, nonemployment, is systematically nonsignificant in both parts of the model.
One plausible objection to the results in is that time-varying and time-invariant characteristics of the regions affect levels of segregation. I therefore estimate the baseline model () with time and region fixed effects. More precisely, I link region and year dummies directly to income segregation.
The results of this specification () show even stronger total impacts of business services on segregation. There is also a stronger direct link in the shorter and longer run, a stronger indirect link in the shorter run, and a stronger impact of total inequality in the shorter run.Footnote4 It is possible, therefore, that secular changes coincide systematically with the chosen time lags. Using ten years, however, continues to produce the lowest value of AIC and thus confirms the impression of income segregation as a protracted process.
Table 3 SEM Estimations of Income Segregation. Added Control for Time and Region
Another question to be settled concerns differences within the business services sector. Is there, as anticipated, a specifically large impact of finance and insurance? I investigate the question through two models with time and region fixed effects, using five years’ lag between inequality and segregation. The estimates from these estimations are reported in , with model 1 (finance/insurance) in the upper panel, model 2 (the remaining sector) in the middle panel, and differences between the two in the lower panel. What I find is that growth, stabilization, and decline in the finance industry correspond very closely to changes in the level of income inequality. A 1 percent higher share in finance/insurance raises the Gini coefficient by approximately two points, compared to less than one point for the remaining sector. The small sample size makes it difficult to establish differences in the two pathways, but it is clear that higher inequality translates into higher segregation (see row 11, column 7).Footnote5
Table 4 SEM Estimations of Income Segregation. Comparison of Impacts from Two Segments of the Business Services Sector
Location Patterns
offers a different perspective on the changing residential landscape. The inspiration here comes from global-city literature (Sassen Citation2001; Hamnett Citation2003) that explores congregation of business services and their labor force in central locations. Norwegian metropolitan regions are of a completely different order, but the centralizing tendency is nonetheless notable. Business personnel are vastly overrepresented in central-city neighborhoods, with little difference between the three regions. A similar differentiation appears when the comparison relates to high-income personnel: working in business services increases the likelihood that individuals reside in a central area. Looking at trends, there is more variation. Central areas in Bergen and Oslo experience a relative loss of the selected group, that is, high-income residents in other branches become more centralized. The inner city of Trondheim, by contrast, develops in the opposite direction.
Table 5 Representation in Central Areas Measured by the Location Quotient, 2000 and 2018
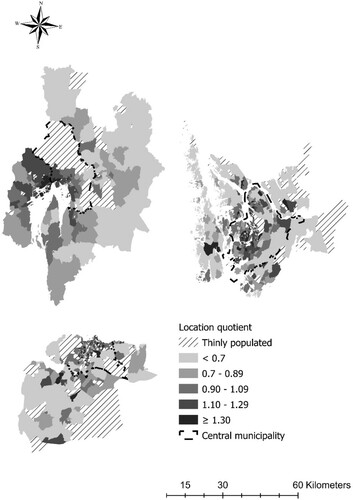
The declining attraction to central locations in Bergen and Oslo reflects two types of expansion. First, both of these cities pursue a multinodal development strategy. New housing and workplaces emerge in suburban centers, often in direct competition with the older core. Second, business services in OsloFootnote6 gravitate to a large extent toward waterfront locations. The ensuing geography looks like a corridor with office buildings, apartment complexes, and leisure spaces. Four decades after the modest beginning on a former shipyard, one may now find this type of development beyond the western border of Oslo municipality. Business headquarters and associated agencies are thus reproducing and extending a morphological divide that runs straight through the city (see Wessel Citation2000). (upper-left plot) shows the residential outcome of the sketched expansion. High-income employees (the fourth quartile) in business services are strikingly segregated from other employees in the same income bracket. The location quotient for the former group surpasses 1.3 in many western neighborhoods, whereas it falls below 0.7 in large parts of the eastern sector.Footnote7 Bergen and Trondheim, by comparison, display less coherent patterns in the outer city (upper-right and lower-left plot in ).
Figure 3. Location quotient: business services workforce in the fourth income quartile versus the entire workforce in the same income bracket. Upper left: Oslo, upper right: Bergen, lower left: Trondheim.
Discussion
I set out to investigate two pathways through which business services may impinge on income segregation. The first one (indirect effects) raises income segregation through income inequality; the second one (direct effects) raises income segregation independent from income inequality. While both pathways matter, the former is altogether weaker than the latter. Growth of business services do indeed raise income inequality, but the ripple effect from change in inequality to change in segregation is less clear-cut than expected, with variations across different time lags. The direct impact, in contrast, is strong and independent from the time horizon. Importantly, while numerous high-order services contribute to increasing inequality and segregation, there can be no doubt that financial activities are at the forefront of change. The rest of the sector has experienced larger employment changes, but growth and decline in finance have larger implications for the spatial distance between high- and low-income households.
Additional supportive evidence shows that employees in business services are vastly overrepresented in the inner city and somewhat less overrepresented in the central municipality. A more restricted analysis for high-income employees gives the same pattern: those who work in business services are more likely to live in a central location than the entire high-income segment. Finally, I also show that settlement patterns in Oslo overlap with a long-standing socioeconomic divide. A strip of docks, reused factory areas, and residual maritime spaces in the western part of the region has become a specialized economic district that attracts business services and their staff. Viewed in location terms, there is less representation of high-income business personnel in the eastern, northern, and southern suburbs. There is also fading representation in western areas that require long-distance commuting.
A striking finding in the study is that income inequality exerts a weak to moderate impact on income segregation. US research, by contrast, concludes that inequality accounts for 100 percent (Watson Citation2009), 40 to 80 percent (Reardon and Bischoff Citation2011), and 70 percent (Bischoff and Reardon Citation2014) of the rise in segregation. One obvious reason for the difference is the smaller size of Norwegian metropolitan regions (for documentation of the interaction between population size, inequality, and segregation, see Reardon and Bischoff Citation2011). A more substantial argument is that neighborhood adjustments are slower and less predictable in countries that prioritize spatial equalization. That is, industrial shift, politics, and immigration may raise income inequality without a strong spillover effect to income segregation. Norway, just like the rest of Scandinavia, engages heavily in such policies, as argued in a new study of immigrant residential behavior (Hermansen, Hundebo, and Birkelund Citation2022). If this is a valid interpretation, that is, if the quality of schools, health care, and local institutions reduces the incentive to change neighborhoods, it also carries weight in a study of income segregation. In the first place, immigrants are a large subgroup that affects the general level and development of neighborhood sorting. In the second place, the logic regarding public goods pertains to the entire population. Immigrants and natives alike face choice sets with small or moderate differences in neighborhood quality.
The factors that influence income inequality can be linked to similar historic and geographic circumstances. Contrary to expectation, there is no significant effect of nonemployment in the statistical model, whereas university education reduces inequality with little further impact on segregation. The reason for these patterns, again, seems to lie in the national context that shapes labor markets, employment levels, and equity. All three regions have experienced massive economic growth, with small temporary setbacks. The unemployment part of nonemployment is therefore less important as a factor that restrains neighborhood affordability. Access to higher education is part of a larger social contract whereby university studies are free, and, as the flipside of the coin, those who educate themselves receive moderate rewards (Barth, Moene, and Wallerstein Citation2003). By implication, one should not be surprised that education reduces income inequality in larger statistical models.
It is equally clear that Norwegian authorities have little command over business services. The diverging character of labor-market institutions is just one factor in this picture. Many business services are part of international networks and associations that affect wages, with further implications for inequality and neighborhood sorting. Executive pay through nonmarket channels (Keller and Olney Citation2021) and access to tax haven subsidiaries (Jones, Temouri, and Cobham Citation2018) are two examples of how business services become detached from the national context. Corporations within this sector may additionally utilize their financial resources in the competition for urban space. A recent market report (Den Norske Bank Citation2021) shows that both asking prices and vacancy rates in the rental office market of Oslo correspond to the east–west divide. The eastern part of the market, hence, caters to a combination of public agencies and private firms in less profitable industries (e.g., consumer services, manufacturing, publishing, and trade).
A peculiar feature in this picture concerns state ownership. The Norwegian state is engaged in several of the largest corporations, partly as a reminiscence of early modernization and partly as a side-effect of a rescue operation in the early 1990s. Efforts to utilize this power, however, have often failed. The most striking example of government weakness occurred twenty-five years ago when the state along with Oslo municipality tried to influence the location of a new headquarters for the telecom giant Telenor. Both authorities wanted Telenor to locate in the eastern sector, but the company ended up in its preferred western location (Estate Nyheter Citation1996).
To conclude, the results I have presented suggest that business services are a significant determinant of neighborhood affordability and diversity. What remains to be seen is how the growth of these industries affects high-income, middle-income, and low-income residents. One likely possibility is that business services boost high-income segregation, partly due to high wages and partly due to the preference for social homophily within the same groups (Galster and Magnusson Turner Citation2017). It is also likely, however, that low-income residents lose ground. The huge resources of some industries and sections of the public make it difficult for less privileged groups to remain in the central city, as argued in a Dutch study (Hochstenbach and Musterd Citation2018).
Another important task for further research is to consider potential routes to less segregated urban spaces. The employment–residence relationship is particularly interesting in this context. It should be possible, at least in theory, to prevent complete domination of finance and related activities in the most attractive urban locations. Strong and clever land-use regulation might be a way forward.
Acknowledgments
I would like to thank editor Andrés Rodríguez-Pose and the reviewers for their constructive comments, as well as Lena Magnusson Turner for helping me with the maps. The research was supported by The Research Council of Norway [Grant No. 201876].
Notes
1 This option does not exist in a multistep regression framework.
2 Norway’s fourth largest city, Stavanger, went through a tremendous economic shock from the 1970s onward. Massive investments in oil and gas production, and its status as oil capital, affected the wage structure and the pattern of labor mobility over several decades (see Fitjar and Timmermans Citation2019).
3 This pattern is well known from international research. The rising weight of finance in the economy is not matched by a rapid growth of employment in banks and financial institutions (Bogliacino, Lucchese, and Pianta Citation2013); there are also signs of diffusion from central to less central areas (Sassen Citation2001; Wójcik Citation2012).
4 All of these differences are statistically significant. Other differences across the two tables do not reach statistical significance.
5 Estimations with alternative time lags yield similar patterns, that is, a large difference in terms of inequality and a smaller difference in terms of segregation.
6 There are signs of similar clustering in Bergen and Trondheim but largely along docks in the inner city.
7 A sarcastic expression captures the range and influence of the new landscape: tour de finance is a cycle route that stretches from the city center to the western municipality Asker. Neighborhoods close to this route appear in black on the map in .
References
- Acemoglu, D. 1999. Changes in unemployment and wage inequality: An alternative theory and some evidence. American Economic Review 89 (5): 1259–78. doi:10.1257/aer.89.5.1259.
- Atkinson, A. B. 2003. Income inequality in OECD countries: Data and explanations. CESifo Economic Studies 49 (4): 479–513. doi:10.1093/cesifo/49.4.479.
- Barth, E., Moene, K.O., and Wallerstein, M. 2003. Likhet under press [Equality under pressure]. Oslo, Norway: Gyldendal/Akademisk.
- Bischoff, K., and Reardon, S. F. 2014. Residential segregation by income, 1970–2009. In Diversity and disparities: America enters a new century, ed. J. Logan, 208–33. New York: Russell Sage Foundation.
- Bogliacino, F., Lucchese, M., and Pianta, M. 2013. Job creation in business services: Innovation, demand, and polarization. Structural Change and Economic Dynamics 25 (June): 95–109. doi:10.1016/j.strueco.2012.07.007.
- Card, D. 2009. Immigration and inequality. American Economic Review: Papers and Proceedings 98 (2): 1–21. doi:10.1257/aer.99.2.1.
- Chen, W. H., Myles, J., and Picot, G. 2012. Why have poorer neighbourhoods stagnated economically while the richer have flourished? Neighborhood income inequality in Canadian cities. Urban Studies 49 (4): 877–96. doi:10.1177/0042098011408142.
- Den Norske Bank 2021. Market report. www.dnbnaringsmegling.no().
- Epstein, G. A., ed. 2005. Financialization and the world economy. Cheltenham, UK: Edward Elgar.
- Estate Nyheter. 1996. Trolig Fornebu for Telenor. [Probably Fornebu for Telenor]. www.estatenyheter.no/124939.
- Fitjar, R. D., and Timmermans, B. 2019. Relatedness and the resource curse: Is there a liability of relatedness? Economic Geography 95 (3): 231–55. doi:10.1080/00130095.2018.1544460.
- Galster, G., and Magnusson Turner, L. 2017. Status discrepancy as a driver of residential mobility: Evidence from Oslo. Environment and Planning A: Economy and Space 49 (9): 2155–75. doi:10.1177/0308518X17717067.
- Gregorio, J. D., and Lee, J. W. 2003. Education and income inequality: New evidence from cross-country data. Review of Income and Wealth 48 (3): 395–416. doi:10.1111/1475-4991.00060.
- Guerreri, P., and Meliciani, V. 2005. Technology and international competitiveness: The interdependence between manufacturing and producer services. Structural Change and Economic Dynamics 16 (4): 489–502. doi:10.1016/j.strueco.2005.02.002.
- Hamnett, C. 2003. Unequal city. London in the global arena. London: Routledge.
- Hamnett, C. 2021. The changing social structure of global cities: Professionalisation, proletarianisation or polarisation. Urban Studies 58 (5): 1050–66. doi:10.1177/0042098020940556.
- Hermansen, A., Hundebo, P. O., and Birkelund, G. E. 2022. Spatial Assimilation at a halt? intergenerational persistence in neighborhood contexts among immigrant minorities in Norway. International Migration Review. doi:10.1177/01979183211067771.
- Hochstenbach, C., and Musterd, S. 2018. Gentrification and the suburbanization of poverty: Changing urban geographies through boom and bust periods. Urban Geography 39 (1): 26–53. doi:10.1080/02723638.2016.1276718.
- Ioannou, S., and Wójcik, D. 2021. Finance, globalization, and urban primacy. Economic Geography 97 (1): 34–65. doi:10.1080/00130095.2020.1861935.
- Jones, C., Temouri, Y., and Cobham, A. 2018. Tax haven networks and the role of the Big 4 accountancy firms. Journal of World Business 53 (2): 177–93. doi:10.1016/j.jwb.2017.10.004.
- Keller, W., and Olney, W. W. 2021. Globalization and executive compensation. Journal of International Economics 129 (March): 103408. doi:10.1016/j.jinteco.2020.103408.
- Kollmeier, C. 2013. Family structure, female employment, and national income inequality: A cross-sectional study of 16 Western countries. European Sociological Review 29 (4): 816–27. doi:10.1093/esr/jcs060.
- Korzeniewicz, R. P., and Moran, T. P. 2005. Theorizing the relationship between inequality and economic growth. Theory and Society 34 (3): 277–316. doi:10.1007/s11186-005-4575-6.
- Kristal, T., and Cohen, Y. 2017. The causes of rising wage inequality: The race between institutions and technology. Socio-Economic Review 15 (1): 187–212. doi:10.1093/ser/mww006.
- Kuznets, S. 1955. Economic growth and income inequality. American Economic Review 45 (1): 1–28.
- Lees, L. 2003. Super-gentrification: The case of Brooklyn Heights, New York. Urban Studies 40 (12): 2487–509. doi:10.1080/0042098032000136174.
- Marchand, Y., Dubé, J., and Breau, S. 2020. Exploring the causes and consequences of regional inequality in Canada. Economic Geography 96 (2): 83–107. doi:10.1080/00130095.2020.1715793.
- Lin, A.-H., and Tomaskovic-Devey, D. 2013. Financialization and US income inequality, 1970–2008. American Journal of Sociology 118 (5): 1284–329. doi:10.1086/669499.
- Musterd, S., Marcinczak, S., van Ham, M., and Tammaru, T. 2017. Socioeconomic segregation in European capital cities. Increasing separation between poor and rich. Urban Geography 38 (7): 1062–83. doi:10.1080/02723638.2016.1228371.
- Norwegian Government. 2009. Fordelingsutvalget [The allocation committee]. Report no. 10 to the Parliament. https://www.regjeringen.no/no/dokumenter/nou-2009-10/id558836.
- Owens, A., Reardon, S. F., and Jencks, C. 2016. Income segregation between school and school districts. American Educational Research Journal 53 (4): 1159–97. doi:10.3102/0002831216652722.
- Philippon, T., and Reshef, A. 2012. Wages and human capital in the U.S. finance industry, 1909–2006. Quarterly Journal of Economics 127 (4): 1551–609. doi:10.1093/qje/qjs030.
- Pike, A., and Pollard, J. 2010. Economic geographies of financialization. Economic Geography 86 (1): 29–51. doi:10.1111/j.1944-8287.2009.01057.x.
- Piketty, T. 2015. About capital in the twenty-first century. American Economic Review 105 (5): 48–53. doi:10.1257/aer.p20151060.
- Reardon, S. F. 2011. Measures of segregation. CEPA Working Paper. Stanford, CA: Stanford Center for Education Policy Analysis.
- Reardon, S. F., and Bischoff, K. 2011. Income inequality and income segregation. American Journal of Sociology 116 (4): 1092–153. doi:10.1086/657114.
- Rodríguez-Pose, A., and Tselios, V. 2009. Education and income inequality in the regions of the European Union. Journal of Regional Science 49 (3): 411–37. doi:10.1111/j.1467-9787.2008.00602.x.
- Sassen, S. 2001. The global city: New York, London, Tokyo. Princeton, NJ: Princeton University Press.
- Scott, A. J. 1988. Metropolis: From the division of labor to urban form. Los Angeles: University of California Press.
- Statistics Norway. 2021. Standard industrial classification. www.ssb.no/klass/klassifikasjoner/6/versjon/30/versjoner.
- Tammaru, T., Marcinczak, S., Aunap, R., van Ham, M., and Jansson, H. 2020. Relationships between income inequality and residential segregation of socioeconomic groups. Regional Studies 54 (4): 450–61. doi:10.1080/00343404.2018.1540035.
- Theil, H., and Finizza, A. J. 1971. A note on the measurement of racial integration of schools by means of informational concepts. Journal of Mathematical Sociology 1 (2): 187–93.
- Watson, T. 2009. Inequality in the measurement of residential segregation by income in American neighborhoods. Review of Income and Wealth 55 (3): 820–44. doi:10.1111/j.1475-4991.2009.00346.x.
- Wessel, T. 2000. Social polarisation and socioeconomic segregation in a welfare state: The case of Oslo. Urban Studies 37 (11): 1947–67. doi:10.1080/713707228.
- Wessel, T. 2013. Economic change and rising income inequality in the Oslo region: The importance of knowledge-intensive business services. Regional Studies 47 (7): 1082–94. doi:10.1080/00343404.2011.600301.
- Wessel, T. 2016. Economic segregation in Oslo: Polarisation as a contingent outcome. In Socioeconomic segregation in European capital cities: East meets West, ed. T. Tammaru, S. Marcinczak, M. van Ham, and S. Musterd, 132–55. London: Routledge.
- Wójcik, D. 2012. The end of investment bank capitalism? An economic geography of financial jobs and power. Economic Geography 88 (4): 345–68. doi:10.1111/j.1944-8287.2012.01162.
Appendix A
Classification of Business Services