
 ?Mathematical formulae have been encoded as MathML and are displayed in this HTML version using MathJax in order to improve their display. Uncheck the box to turn MathJax off. This feature requires Javascript. Click on a formula to zoom.
Abstract
The concept of regional development trap refers to regions that face significant structural challenges in retrieving past dynamism or improving prosperity for their residents. This article introduces and measures the concept of the regional development trap for regions in Europe. The concept draws inspiration from the middle-income trap in international development theory but widens it to shed light on traps in higher-income countries and at the regional scale. We propose indicators—involving the economic, productivity, and employment performance of regions relative to themselves in the immediate past, and to other regions in their respective countries and elsewhere in Europe—to identify regions either in a development trap or at significant near-term risk of falling into it. Regions facing development traps generate economic, social, and political risks at the national scale but also for Europe as a whole.
European regions display stark differences in economic indicators such as income per capita, employment, and demography.Footnote1 A growing literature documents persistent variation not just in their levels of performance but also in terms of the direction and rate of changes in such indicators (European Commission Citation2017a, Citation2017b, Citation2022; Iammarino, Rodríguez-Pose, and Storper Citation2019). These analyses document the emergence of subnational economic clubs of development, consisting of regions with wide differences in dynamics of income, employment, industrial composition, education, productivity, innovation, as well as urbanization and demography. One reason for such differences is that there is long-term economic stagnation of many regions of Europe, and this occurs at varying levels of development. This is generating a Europe of different speeds. Regions at the top and the bottom of the income scale have been, in general, far more dynamic than many regions in between these two extremes. A considerable number of European middle-income regions have experienced lengthy periods of low growth, weak productivity increases, low employment creation, or even employment loss. This phenomenon includes some formerly wealthy regions, pushing some of them down into the ranks of the middle-income group.
The challenges faced by many of these regions are comparable to those of middle-income countries. Prominent among them are growth slowdowns (Ben-David and Papell Citation1998) and middle-income traps into durable economic stagnation (Gill and Kharas Citation2007; Kharas and Kohli Citation2011). The latter refers to countries that had once successfully transitioned from low- to middle-income status but subsequently experienced a durable decline in economic growth. This traps them in the middle income and hampers their ability to move up to a higher-income level.
Insights from country-level studies can only be applied to the case of subnational areas and to developed economies with substantial conceptual and statistical modification. European regions tend to become trapped at considerably higher gross domestic product (GDP) per capita levels than those of countries stuck in a middle-income trap. They also follow different pathways into the trap. These range from long-term decline in income level relative to other regions to lengthy periods of subpar economic performance at middle-income levels to never becoming a high-income region. Moreover, lack of economic dynamism and stagnation in many developed areas manifests itself in dimensions other than just GDP per capita, such as lack of productivity and/or employment growth or decline in innovation capacity.
Trapped regions have, thus far, not received consistent policy attention because they have not been defined and analyzed as such. In Europe, these regions are caught between national policies that often target the wealthiest and most dynamic places within their countries, and an EU cohesion policy aimed at strengthening economic, social, and territorial cohesion by investing in the least developed regions.
In this article, we address these gaps in our knowledge. Our contribution is threefold. First, we introduce the concept of regional development trap in Europe, which applies to regions that face significant structural challenges in retrieving past dynamism or improving prosperity for their residents. Our definition borrows from the theory of middle-income trapped countries but rethinks this concept to reflect specificities of development trajectories at the subnational level and in economies that are largely already industrialized. We offer a dynamic conceptualization—rather than just a snapshot—of what constitutes a development trap (or DT) at a regional level in Europe, with the aim of providing a comprehensive diagnostic tool to appraise the extent to which a region has been or is at risk of being trapped. Second, we measure which European regions have been development trapped or have been at risk of becoming trapped in recent years. To this end, we develop a synthetic indicator of dynamism in the economic, productivity, and employment performance of regions relative to themselves in the immediate past, to other regions in their respective countries, and to the rest of Europe. This paints an intuitive picture of development trapped regions across Europe, both in terms of their geography and their inherent characteristics. Third, we trace the relevance of our results for regional decision-makers and planners, with the goal of raising awareness of this issue, and the need for policies specifically targeted at helping regions spring the trap.
The rest of the article is organized as follows. The next section reviews relevant existing theory and evidence, drawing in particular on the middle-income trap concept to provide a definition of regional development traps. The section after that proposes a methodology for identifying European regions that are (or are at risk of being) caught in a trap. We then describe the resulting measure, highlighting its geography and the main characteristics of trapped regions. We distinguish between different types or groups of trapped regions and different ways of reaching the trap stage. Finally, in the conclusions, we take stock of the analysis and discuss policy recommendations.
Defining Regional Development Traps
We define a regional development trap for Europe as the state of a region unable to retain its economic dynamism in terms of income, productivity, and employment, while also underperforming its national and European peers on these same dimensions. Stated differently, a region can be said to be development trapped if the prosperity of its residents does not improve relative to its past performance and the prevailing economic conditions in national and European markets. We further apply this concept to regions that fall into this state from starting points at different levels of economic development relative to the European distribution, thus distinguishing between regional development traps at high, middle, and low levels of income. What follows discusses existing theories and empirical findings that underlie this definition.Footnote2
In development and growth economics, traps are understood as a persistent and stable state of low development, long-term low growth, or stop-and-go growth and recession that generate income stagnation. Falling into this type of bad equilibrium is usually associated with self-reinforcing mechanisms linked to institutional failures or stagnating productivity so that a policy shock or some kind of structural change is required in order to get out of the trap (Azariadis and Stachurski Citation2005).
The idea of traps is distinct from the notion of barriers to convergence. Convergence models describe a general state of transition toward a unique steady-state equilibrium, leading to a reduction in disparities across all economies (Barro et al. Citation1991; Barro and Sala-i-Martin Citation1992; Magrini Citation2004). By contrast, traps are part of the family of concepts that consider the possibilities for lower-income economies to catch-up to the leaders by virtue of the gradual narrowing of their income and productivity gaps (Abramovitz Citation1986; Fagerberg Citation1994; Fagerberg and Godinho Citation2006).Footnote3 Catch-up theories do not rely on a single pathway to such narrowing. They instead identify many place-specific varieties of trajectories. Trap models are especially concerned with a particular breakdown of the catch-up process, consisting of growth slowdowns after a period of rapid take-off growth. When such slowdowns persist, catch-up seems to be indefinitely postponed (Ben-David and Papell Citation1998; Aiyar et al. Citation2013; Eichengreen, Park, and Shin Citation2014). But slowdowns can occur at any level in a system or for the system as a whole, so care must be taken to identify those slowdowns that signal existence of a trap. Slowdowns are an empirical notion associated generically with deceleration in income growth. This could be due to convergence, catch-up, or traps, among others. In some sense, slowdowns are the empirical counterpart to convergence, catch-up, or trap theories and, each theory has a specific conceptualization of this empirical notion (Aiyar et al. Citation2013). We return to this later in the article, where we discuss the measurement of slowdowns.
Insights from the Middle-income Trap and Catch-up Development Literatures
Middle-income traps occur in countries that have, according to Kharas and Kohli (Citation2011, 282), “bursts of growth followed by periods of stagnation or even decline, or are stuck at low growth rates,” meaning that “instead of steadily moving up [the development ladder] over time, their GDP per capita simply gyrates up and down.”
Middle-income trapped economies reach a development level in which production costs rise above those of low- and lower-middle income countries, while their skill endowments and innovation capacity remain below those of high-income countries (Kharas and Kohli Citation2011; Gill and Kharas Citation2015). It is in this sense that they are structurally trapped between these two groups. Low-income countries often go through rapid growth spurts (economic miracles) for some years because they are relatively cheap, but their success can undermine further progress if they do not complement higher wages with higher technological innovation and higher overall productivity. Falling into the trap manifests itself in the form of a long-term slowdown. In other words, as they approach middle-income levels, economies cannot carry on through initial take-off strategies consisting of moving labor from agriculture into export-oriented industry, using easily adopted foreign technologies. Such economies are wedged in between two worlds: they are neither as productive nor as innovative as the high- and very-high-income economies, but their labor and land prices are not as low as those of the lower-income ones. As these economies reach middle-income status, they undermine their comparative advantage in mature, labor-intensive industries, that is, those that generally rely on a low-wage workforce and standardized technologies. And yet they cannot compensate by breaking into new innovation-intensive sectors that rely on frontier knowledge, which is the key mechanism of full catch-up to convergence theories (Fagerberg and Godinho Citation2006; Lee Citation2019).
Acemoglu, Aghion, and Zilibotti (Citation2006), for instance, model an economy at the crossroads of two development strategies: adoption of preexisting technologies or innovation at the frontier. In the early stages of development, firms primarily invest in acquiring existing technologies and thus can afford less selection. As the economy develops and approaches the technological frontier, it increasingly relies on innovation and thus promotes entrepreneurs with higher skills. Crucially, however, the authors discuss how late-switching from an adoption- to an innovation-led strategy can result in a nonconvergence trap, characterized by low growth due to inadequate innovation.
This dynamic can take place at higher levels of development, too, and displays a distinct sectoral profile. Lee and Malerba (Citation2017) point at the existence of catch-up cycles of changes in industrial leadership over time, determined by the inability of incumbent leaders to respond to changes in technology, demand, and institutions. The changing role of the US, Ireland, and India in the global provision of information technology (IT) services offers an example of this dynamic (Porto, Lee, and Mani Citation2021). Importantly, since industries tend to be spatially clustered (Ellison and Glaeser Citation1997), catch-up cycles can help explain regional economic dynamics, even within advanced economies. From this point of view, local entrepreneurship is also key to regional economic diversification and transformation (Neffke et al. Citation2018). Aghion and Bircan (Citation2017) and Vivarelli (Citation2016) discuss the Schumpeterian foundations of middle-income traps, emphasizing the institutional factors required to support an economy undergoing structural transformation onto a higher-growth or income path.
Unsurprisingly, then, empirical studies agree that stagnating productivity growth is at the core of middle-income slowdowns. Hsieh and Klenow (Citation2010) document that total factor productivity (TFP) accounts for 50 to 70 percent of cross-country differences in output, affecting a country’s performance both directly and indirectly, via their interaction with physical and human capital. Eichengreen, Park, and Shin (Citation2012) conclude that falling TFP growth explains about 85 percent of the deceleration in output growth. In their view, “growth slowdowns, in a nutshell, are productivity growth slowdowns” (Eichengreen, Park, and Shin Citation2012, 54). This finding was echoed by Aiyar et al. (Citation2013), who estimate that TFP was crucial to explaining the slowdown of Latin American economies in the 1980s, accounting instead for more than half of the spectacular growth in GDP per capita experienced by East Asian economies since the 1970s. Similarly, middle-income traps are also associated with human capital deficits, resource misallocation, scarce access to advanced infrastructure, and low institutional quality.
Overall, middle-income trapped economies face some of the most difficult developmental challenges: moving up the productivity ladder requires much higher investment per worker than in the early stages of development because it needs greater skills. Improving the quality of firms also requires more investment in hardware and software. And the entire society needs more investment in infrastructure, education, and institutions to sustain a higher quality, more innovation-rich and cost-sensitive growth processes.
From Middle-income Traps to Regional Development Traps
As noted, the middle-income trap concept has been applied to national economies (Eichengreen, Park, and Shin Citation2014). Yet, it is becoming increasingly clear—at least in the European context—that certain groups of regions are afflicted by similar problems as those described for middle-income trapped countries. Conceptually, allowing the notion of traps to manifest itself at different levels of spatial aggregation is discussed by Barrett and Swallow (Citation2006), albeit limited to poverty traps. As in the international development literature, others have approached the issue from a convergence perspective. Martin and Sunley (Citation1998), find that interregional convergence is a slow and discontinuous process. Fagerberg and Verspagen (Citation1996) conclude that there appeared to be a Europe at different speeds, with groups of regions characterized by distinct dynamics linked to differences in features such as industry composition and research and development (R&D) efforts. Similar findings are highlighted by Quah's (Citation1996a, Citation1996b, Citation1997) research on convergence clusters. Structural transformation exacerbates these issues. Sassi (Citation2011) examines the role of sectoral composition and structural change in convergence across a sample of European regions between 1995 and 2006. She shows that convergence takes place at different speeds in different subgroups of regions characterized by different sectoral mixes. In her own words, “This pattern hardly conforms with the Solow model hypothesis and suggests, instead, that some process linked to geographic spillovers and low trap equilibrium phenomena might be at work, as prescribed by the economic geography and the new endogenous growth theory, an aspect that deserves a more specific investigation” (Sassi Citation2011, 113). Storper (Citation2018) discusses the growing interregional divergence of economic fates and political polarization across Europe, arguing that both agglomeration forces and institutional divergence could have circular and cumulative feedbacks.
The profile of European regions experiencing stagnation is in many ways comparable to that of middle-income trapped nations (Iammarino, Rodríguez-Pose, and Storper Citation2019). First, their costs are too high to compete in the production of basic goods and services with less advanced European regions and low- to lower-middle income nations in other parts of the world. Second, their skill levels and innovative capacities are lower than those of the high-income regions of Europe that specialize in the production of technologically advanced and knowledge-intensive goods and services (Rodríguez-Pose and Ketterer Citation2020). Third, international outsourcing and offshoring further cut into their ability to attract labor-intensive or scale-based activities, limiting, in turn, inward investment and hence resources for the internationalization of domestic firms (Iammarino and McCann Citation2013; Crescenzi and Iammarino Citation2017). Similar to middle-income countries, these regions are stuck between a rock and a hard place: they have become “unable to compete with low-income, low-wage economies in manufactured exports and unable to compete with advanced economies in high-skill innovations” (Kharas and Kohli Citation2011, 282).
There are, however, some important differences between the emergence of development traps in European regions and what the extant literature has described for middle-income trapped nations. First, European regions become trapped at a higher level of development in absolute terms. Second, lack of economic dynamism and stagnation in many developed areas of the world does not exclusively manifest itself in terms of GDP per capita. It more often involves lack of productivity and/or employment growth or decline in innovation capacity. Third, regional stagnation in Europe does not occur uniquely after a successful transition from low- to middle-income status but instead follows a variety of trajectories: formerly wealthy industrial regions whose economic fragility stems from declining manufacturing; formerly lagging regions that may have experienced rapid growth spurts but then get stuck at levels of development below European average; and places that, once at middle-income levels, remain at these levels. Regions in this last subgroup essentially never grew enough to improve their performance compared to other places in Europe.
Thus, the European case invites us to reformulate the notion of trap as a variety of development blockages or indeed development traps, contrasted to the unique focus of the international comparative literature on middle-income traps for developing countries. The next section lays out a methodology to identify these development traps empirically.
Identifying European Territories in Development Traps
Identifying development trapped regions empirically draws from the econometric methods that undergird the literature on international growth slowdowns (see Breinlich et al. Citation2014 for a comprehensive discussion). That literature, with few exceptions, relies almost exclusively on per capita income as its measure of development traps. It also presents dichotomous definitions of slowdowns or traps as states in which an economy either is or is not. These two points are in contrast to the literature on middle-income traps, which suggests that the state of being trapped is far more complex than just slowdowns in growth rates. Importantly, the risk of falling into a development trap at mid-levels of development could also be associated with other factors, such as low growth in employment or labor force participation or declining manufacturing shares in local economies. With an eye to increasing the relevance of this notion for policy purposes, it behooves us to generate an ex ante continuous measure of risk for each observation, rather than just a dichotomous variable capturing trapped status. This allows studying the intensity of traps, rather than merely creating a binary of whether a territory is trapped or not. To do this, we consider the ongoing exposure of each region to a variety of development trap risks.
We directly measure development traps along a multidimensional continuum consisting of three variables: GDP per capita at constant 2005 prices, total gross value added per worker (productivity) at constant 2005 prices, and employment to population ratio.
Income per capita is included as a synthetic measure of regional welfare, which is standard in the literature. Particularly at the regional level, development traps may manifest themselves in other ways than through GDP per capita, depending for instance on local industrial composition and institutional features. The timing of these effects may differ, too. Therefore, we also include a measure of productivity, proxied by total regional gross value added per worker employed. This is justified in light of the prominent role played by this variable in the research on growth slowdowns and middle-income traps (Eichengreen, Park, and Shin Citation2012; Rodríguez-Pose and Ganau Citation2022).Footnote4 Finally, the employment-to-population ratio captures the joint effects of development traps that are expressed through both regional labor supply and demand. This especially addresses the challenge of some regions to create new jobs confronted with a changing economic landscape and structural transformation, and complex responses on the supply side, including declining or stagnant labor force participation. This is backed up by Blanchard et al. (Citation1992), who describe, using US data, how localized shocks can have long-lasting effects on employment, leading to distinct geographic patterns of job creation. Martin and Tyler (Citation2000) document a similar pattern for European regions. Dunford and Smith (Citation2009) additionally point to substantial regional variation in the speed and direction of change in income per capita, productivity, and employment rates, with divergence and convergence occurring simultaneously as a result of greater economic integration. Overall, even though the variables used for calculating the index are correlated with each other (see Appendix 1, Table A1, in the online material), each is still useful in providing additional variation that illuminates the variety of different development traps and their specific dimensions.
Each variable is defined at the Nomenclature of Statistical Units, Level 2 (NUTS2), using panel data based on Eurostat figures and the Cambridge Econometrics Regional Database. The series is consistently available for nearly all regions since 1990, dating back to 1980 for over 75 percent of NUTS2 regions in Europe (mainly for the first fifteen member states of the EU—EU15).Footnote5 Following Hausmann, Pritchett, and Rodrik (Citation2005), we focus on change, taking the accelerations in growth rates of these variables as our proxy for change. For the sake of robustness, two similar alternative measures of development trap are explored. One, simpler, is based on a set of dummies capturing the relative performance of a region compared to three benchmarks (acceleration or deviation), along all three variables listed above. The second, more nuanced, considers the degree of acceleration or deviation from the performance benchmark, rather than just dummies. This could potentially make it more sensitive to outliers, and harder to interpret. What follows clarifies the proposed strategy.
Let the average compound annual growth rate in a variable of interest in region
at time
over the period
be
Growth acceleration is given by
Period length is set at in line with the literature to cover a sufficiently long time window (Aiyar et al. Citation2013). Effectively, this means that each acceleration at time
considers a time window spanning the previous ten years.
Next, the following two deviations of growth rates are defined:Footnote6
Deviation from the national rate of the country where region
is located
Deviation from the European average
Growth and development traps could stem from regional, national, or Europe-wide effects, which could combine and interact as joint effects. We include deviations from national and European performance to ensure the resulting measure captures as much as possible the variation that is specific to the region itself. When an entire country undergoes slowdowns in the dimensions we consider, it is inappropriate to ascribe the status of being trapped to any specific region in that country, since instead the trap happens on a national scale. But this also implies that a region that performs poorly within a national economy that performs equally poorly is far less likely to be identified as trapped by our measure, consistently with our conceptual definition. This is important to keep in mind when interpreting the results.
Next, we define the dummies ,
, and
as indicator variables taking the value of 1 for positive accelerations, and 0 otherwise. This yields six or nine different dummies: two or three for each acceleration (depending on whether a region belongs to a country with one or more than one NUTS2 units), for all three variables
included in the analysis (income per capita, productivity, and employment to population ratio). The first measure of risk of falling into a development trap (DT1) is defined as
This measure is bounded between 0 and 1, with greater values denoting a greater risk of being trapped in a given year t.
As an alternative specification (DT2), we consider the average of each acceleration rather than using dummies, where on the numerator each acceleration is simply added up together (accelerations are dimensionless and thus directly comparable). The resulting index is then standardized across the entire period using the mean and standard deviations of the 1990 distribution (the first year in the series).Footnote8 We also multiply the index by minus one so that higher values are associated to greater risk. More formally, we compute
Where
denotes the unstandardized values of this measure (the part between squared brackets in the above formula). This alternative measure is qualitatively comparable to the first one, but takes the magnitude of accelerations into account, thus providing more variation. Arguably, DT2 may provide a more nuanced description of development traps. However, this comes at the cost of being potentially sensitive to outliers and is somewhat less intuitive to interpret. Different accelerations are implicitly weighted differently across regions depending on the relative magnitude of their changes, and this could also vary for the same region at different points in time. Our aim in providing this alternative definition is to show that DT1—our preferred measure due to its simplicity and interpretability—paints a similar picture to that of DT2. Both measures are constructed for each (available) region and year from 1990 to 2015. Note that in selected instances, we group together smaller urban regions into a unique compact urban area, as functional urban regions. Appendix 2, Table A2 in the online material provides details on the crosswalk used.
These measures have several strengths. First, as we do not condition this index on past growth performance (unlike Hausmann, Pritchett, and Rodrik Citation2005 and Eichengreen, Park, and Shin Citation2012, Citation2014), we capture poorly performing regions approaching stagnation from different past growth trajectories, operationalizing our earlier point that this captures better the European variety of pathways to being trapped. Second, by looking at employment and productivity, in addition to per capita GDP, we allow a trap to be defined in a more nuanced way than by simply looking at income. Third, partly following Quah (Citation1996a), we consider deviations not only from a region’s past performance but also from those of the country and Europe as a whole. Defining accelerations this way accounts for shocks that are common to all regions in the same country or that affect the whole EU. Possible reasons for the former include changes in national policies, different timings of the European enlargement process, as well as more generally state-specific effects. An example of the latter is the Great Recession that hit most European economies in 2008. Fourth, departing from Eichengreen, Park, and Shin (Citation2012, Citation2014), the measures we propose are agnostic with respect to the income level at which European regions become trapped, implementing our earlier point that in Europe, traps can emerge from above or below. This also allows to test the validity of the claim that development traps happen fundamentally at middle-income levels by studying the joint distribution of DT1 or DT2 with respect to initial development levels (Aiyar et al. Citation2013).
This approach offers an intuitive dynamic operationalization of the development trap concept, providing a year-by-year tool to assess the degree and historic evolution of the risk of being trapped. This dynamic definition of development trap is preferable to static measures that are limited to taking a snapshot of regional performance over ex ante defined periods.
A Portrait of Regional Development Traps in Europe
Geography
What follows offers an overview of the resulting measures of applying the proposed method to identify development traps in European regions. shows the geographic distribution of the risk of being in a development trap over the period between 2001 and 2015, broken down by average risk scores. All averages are taken over the longest period for which data are available for each region. With few exceptions, both indicators (DT1 and DT2) draw a consistent picture. Considering the period average, the risk of falling into a development trap is greatest in countries such as France or Italy. Greek regions have also had a greater risk of being trapped, as was the case with certain old industrial regions in the Nordic countries and parts of England. By contrast, the risk of being in a development trap was low for regions in Central and Eastern Europe as well as in Germany. The same risk for the period 1990–2015 is presented in Appendix 3 in the online material.
Figure 1. Average risk of being trapped, quartiles of the distribution over 2001–15.
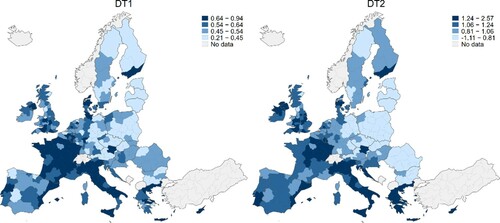
At the same time, readers should keep in mind the dynamic nature of the index, which is exposed to annual fluctuations. provides averages for the cross-section of European regions over a selected period, but present risk may not necessarily be reflected in this average. Accordingly, we recommend dissociating the measurement of past risk (particularly averages) from present risk for specific regions.
The average values of the development trap indices hide considerable variation in the risk profile of each region over time. One of the merits of the proposed measures is that they are available on a yearly basis, allowing us to capture changes and trends. To illustrate this feature, offers a dynamic view of the risk measure. It reports smoothed changes in risk levels over time in selected regions in France and Denmark.
Figure 2. Risk of a development trap in selected NUTS2 regions in France (FR) and Denmark (DK).
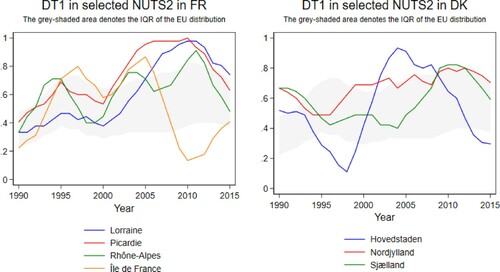
In France, it is interesting to note the contrast between Lorraine and Picardie, two deindustrializing regions, on the one hand, and Île de France (the region of Paris), on the other. The former two, once performing strongly in the metallurgy, chemical, rubber, plastic, and textile sectors (as well as coal, in earlier periods), have recorded ongoing declines in manufacturing employment, combined with slow transition toward service jobs (still below French levels today in terms of share of jobs in the economy). Consequently, economic growth and job creation have been lackluster, and populations are declining. In recent years, cross-border cooperation efforts (in Lorraine) and strong public investments in R&D have somewhat mitigated the adverse effects of deindustrialization, reflected in falling DT scores. By contrast, Île de France, often regarded as the economic engine of France, displays relatively low DT scores across the period of analysis, with the exception of the early 1990s (linked to high unemployment levels in the Parisian suburbs), and 2000s (due to stagnant job creation and productivity, and GDP growth below national average). In recent years, the Parisian economy has accelerated, outperforming the rest of France and Europe in income, employment, and productivity growth. This is also reflected in the DT index.
In a similar vein, there is a strong contrast between North Jutland and Hovedstaden in Denmark. The former, a relatively peripheral and low-innovation region, saw high and increasing levels of DT risk over the period of study. The latter instead, host to the thriving capital city of Copenhagen, showed low risk levels across most of the period, albeit its DT risk increased sharply around the mid-2000s, likely following the region’s inability to keep up with the strong economic performance displayed in previous years as well as relatively high unemployment. The region of Zealand, finally, is an area that, over time, has seen the risk of falling into a development trap increase, despite some slow decline until the early 2000s. Already before the onset of the Great Recession, Zealand was performing worse than the average Danish and European region and worse than it had performed in the past. Only recently has this risk subsided, since efforts to move the regional economy toward more knowledge-intensive production have started to bear fruit. This is reflected in falling risk levels in the DT measure.
To further highlight the heterogeneity of growth trajectories of European regions, we draw new maps for DT1 and DT2 in , showing average scores for the 2001–15 period but where only regions in the top two quartiles of risk are retained. Quartile values are computed using the entire distribution of the DT measures over the 1990–2015 period to benchmark risk levels across all possible historic values. This means that we do not necessarily retain exactly 50 percent of the regions: there could be fewer or more depending on the overall distribution across all periods.Footnote9 Similar maps can be drawn for each year or for other subperiods using the same thresholds, compared against annual rather than mean scores.Footnote10 Darker and lighter shades of colors are for observations above the seventy-fifth and the fiftieth percentiles, respectively. Regions above the seventy-fifth percentile can be considered to be in a development trap; regions between the fiftieth and the seventy-fifth percentile can be considered as regions at high risk of becoming trapped. It is important to emphasize that whenever we refer to regions in a trap or at risk of becoming trapped, we provide a diagnostic assessment of the region for its present state, rather than a forecast of its future development prospects. A region at risk of becoming trapped is a region that, in our view, was nearly trapped in that year but still performed marginally better than others in the same year that were effectively trapped, their past trajectory considered.
Figure 3. Risk of being trapped by initial levels and top two quartiles over 2001–15.
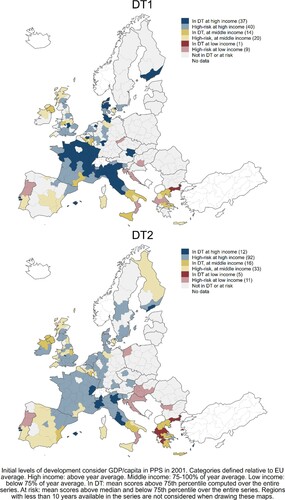
We also recolor the regions in each category to reflect the diverse economic trajectories of those regions at risk of falling into a DT. We create groups using GDP/head relative to the European average.Footnote11 Income is expressed in purchasing power standard (PPS) to ensure cross-sectional comparisons consider geographic differences in price levels.Footnote12 The reference year is 2001, thus capturing the relative position of regions in Europe at the beginning of the period. Regions with less than ten years available in the series are not mapped. The following groups emerge:
Development traps at high levels of income (in blue): regions whose initial GDP per capita was above the European average, experiencing stagnation and relative decline.
Development traps at middle-income levels (in yellow): regions that had a GDP per head at the beginning of the period of analysis between 75 and 100 percent of the European average, experiencing stagnation.
Development traps at low levels of income (in red): regions with a GDP per capita below 75 percent of the European average, experiencing persistent backwardness.
This three-way categorization allows visually highlighting the different types of regional traps across Europe.Footnote13 The maps also show several regions considered to be in or close to the European core—often those at the heart of the so-called Blue Banana—which are stagnating. Some of these, such as Picardie or Champagne-Ardenne, have been in a development trap since, basically, the beginning of the period of analysis.Footnote14
Characteristics of Trapped and Nontrapped Regions
Using categories (and a coloring scheme) consistent with those of , we can examine some of the characteristics of regions in, or at risk of being in, a development trap, comparing them to regions that are not.Footnote15 The choice of variables is driven by theoretical considerations. In line with what was previously discussed, and considering the traditional determinants of growth, we take into account features related to economic structure, physical capital and infrastructure, human capital and labor force characteristics, economic geography, and institutional quality. All variables were obtained from Eurostat or made available by the European Commission (DG REGIO). They are considered both in levels, in , and changes, in (when enough variation is available), which is consistent with our dynamic conceptualization of traps. Both figures show average values for each category, along with 90 percent confidence intervals. We restrict the sample to the 2001–15 period to ensure all regions are measured in each year. Bars colored in grey give averages for regions outside a DT and not at risk of falling into one. The dashed horizontal line denotes the European average for each variable. We emphasize that this analysis is purely descriptive and is not to be interpreted in a causal way, nor as an indication of the relative contribution of either variable to the status of being trapped. For the interested reader, statistical tests of differences in means for pairwise combinations of variable averages within risk categories or income groups are provided in Appendix 7, Tables A4 and A5 in the online material. Below, we focus on a qualitative description of these results.
Figure 4. Conditional averages by DT1 categories and income group levels.
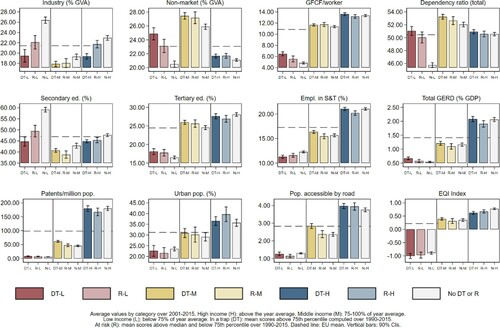
Figure 5. Conditional averages by DT1 categories and income group growth.
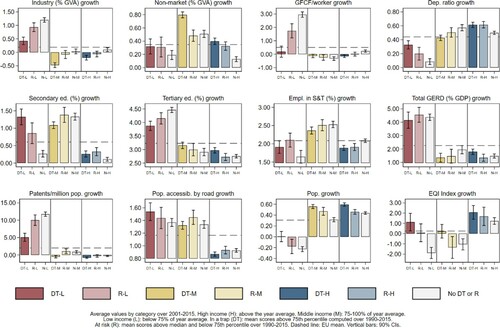
We begin by discussing levels. Regions in a DT, or at risk of being trapped, display lower shares of manufacturing industry. Industry shares are especially high in nontrapped, low-income regions, and in nontrapped, high-income regions. Middle-income economies are characterized by the lowest shares of manufacturing industry across all regions. By contrast, trapped or near-trapped regions (regions at risk) show higher shares of nonmarket services (mainly covering public services in the areas of social welfare, health, education, and defense). This is true both within and across development categories, with regions in the middle-income group displaying particularly high reliance on nonmarket activities compared to more and less developed regions.
Gross fixed capital formation per worker is generally higher at higher levels of income with no large difference between trapped and nontrapped regions. However, at low levels, regions appear to display slightly larger levels of capital formation when they are trapped, relative to when they are not. This apparently counterintuitive result could reflect a negative selection effect or a lagged effect of capital deepening on regional dynamics.
Next, we turn to demographics and workforce composition. Dependency ratios are higher in DT and DT-risk regions at low- and, to some extent, at middle-income levels, but there is no clear pattern emerging at higher levels. Middle-income regions also display the highest dependency ratios overall. In terms of skills, regions in or at risk of being trapped have lower levels of secondary education attainment among the working-age population. This is true across all income categories, although nontrapped regions at low-income levels display the highest shares of secondary education attainment. This is consistent with the median age in this group being the lowest in Europe. Perhaps surprisingly, and possibly due to problems of demand and supply matching in local labor markets, tertiary education attainment is somewhat higher in trapped regions and those at risk of being trapped at low- and middle-income levels, although shares are overall higher in high-income regions.
Differences in innovation indicators are strongly associated with the income per capita of the region, both in terms of inputs (expenditure on R&D, or employment in science and technology) and outputs (patents). This is not surprising when considering these variables in levels, where the differences across income categories are much greater than those within each group. Note, however, that it is increasingly difficult to fully capture innovation and technological change in an economy, with the increasingly prominent role played by IT and artificial intelligence in productivity growth (Damioli, Van Roy, and Vertesy Citation2021).Footnote16
Predictably, higher-income regions tend to be urban. Yet, there is no clear difference within each income group between economies in a development trap (or at risk of falling into one) and those not. Similar considerations apply to accessibility, although, somewhat counterintuitively, accessibility is slightly higher in development trapped regions (albeit comparable to the overall European average). This however could be a result of exposure to competition from stronger neighboring markets, rather than an indication of a negative effect of higher market potential.
Finally, institutional quality as captured by the European Regional Quality of Government Index (EQI), does not vary significantly with DT status, except for low- and high-income groups, where it is linked with relatively lower DT scores. The levels are inversely correlated with income category.
Next, we consider variables expressed in changes, where we take the average yearly growth rate of each variable over the period covered or over the longest available series in case of missing observations. Some associations stand out. Industry growth is lowest (or even negative) among regions that are trapped or at risk of being trapped. Moreover, being trapped is linked with further growth in nonmarket services, particularly in middle- and high-income regions, where levels already tended to be high. Growth in gross fixed capital formation per worker is higher in low-income regions compared to other regions in Europe. However, within this group, development trapped regions show the lowest growth rates. These rates are almost indistinguishable from those in higher income regions and hardly different from zero from a statistical viewpoint. Growth in capital deepening occurs predominantly in low-income regions that are neither trapped nor at risk of being trapped.
Regions trapped at low levels of income have no population growth, while their nontrapped counterparts witnessed population decline. This fact could reflect the ability of people in nontrapped, low-income regions to escape their low-income environment, while people in trapped regions might well literally just be that: trapped, unable to leave. Nontrapped regions at middle and high incomes, however, display lower population growth than their counterparts in a development trap or at risk of falling into one. Dependency ratios worsen in trapped areas at low- and high-income levels, but not in middle-income areas. Low-income trapped areas also show weaker growth in shares of tertiary educated inhabitants, although this group appears to expand faster overall (perhaps due to starting at lower levels).
In terms of innovation, trapped regions consistently display the weakest growth in patents per capita. In poorer areas, dynamic regions have strong increases in their outputs, highlighting the potentially important role played by innovation in achieving regional dynamism. This association, however, is less evident when considering growth in innovation inputs (personnel employed in science and technology, and expenditure on R&D). This may suggest that simply increasing inputs to innovation does not automatically produce greater regional dynamism (perhaps because it does not necessarily translate into growth in innovation rates).
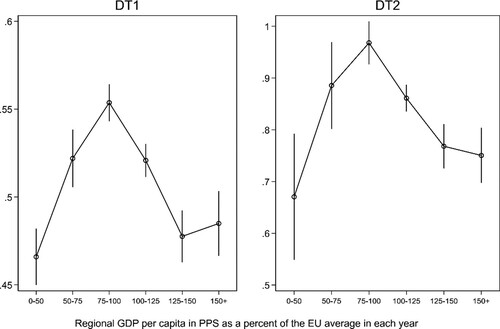
The Middle-income Hypothesis
Is the regional development trap principally that of middle-income regions? At this stage, we focus on whether the risk measures are greater for this group. To examine how DT risk changes for regions at different levels of income, displays average risk by groups of regions defined in terms of GDP per capita (in PPS) relative to the EU mean in each respective year, along with 90 percent confidence intervals.Footnote17 In both graphs, middle-income regions have a significantly higher level of risk of being in a DT. The risk is greatest for regions with GDP per capita falling between 75 and 100 percent of the EU average, which supports the hypothesis that in any given year a region that falls in the midranges of per capita income in relative terms displays a higher risk of being trapped. However, this relationship is somewhat sensitive to how middle income is defined. Moreover, as indicated earlier, regions display significant variation in their development trajectories, becoming middle income from above or below. Greater detail on the dynamic perspective on development traps is provided in Appendix 6 in the online material.
Figure 6. Average risk of falling into a development trap by levels of income.
Conclusions and Policy Implications
This article has introduced and measured the concept of development trap for European regions. We find that many rural and old industrial regions, mostly in Western Europe, have since the early 1990s endured long periods of entrapment or are at significant risk of being trapped. This is the case, for example, of old industrial regions in Central and Northeastern France, Northern Italy, parts of Wallonia in Belgium, Northern Jutland in Denmark, Eastern Spain, or the English Midlands. Other traditionally well-off regions, such as Lower Austria, South Sweden, or Southern Finland also belong in this category. In addition, a number of low-income and low-growth regions in Southern Italy and Greece—most of them in the less-developed European Cohesion Policy category—are in this group. We also show that becoming trapped can take place at different income levels, not just for middle-income areas. Indeed, some European regions with high income per capita are at a high risk of falling into a development trap, as do some regions among the ranks of the least developed. Springing these traps is also essential for Europe as a whole; it would not only strengthen GDP, productivity, and employment growth in such regions, but it would also improve overall European competitiveness. To allow these many and varied places to continue to be trapped represents a waste of their human, social, and knowledge resources.
Regions that were formerly motors of the European economic development have not lost their edge overnight. Many that are now trapped had not fully recovered from the shock of the Great Recession in the early 2010s, when additional shocks from global trade and, more recently, COVID-19–related shutdowns, hit them. More subtly, many were already undergoing slow loss of human capital, and others suffered from visionless if well-meaning leadership based on concepts inherited from a now-irrelevant past. In those regions that began the process of climbing up the economic ladder but have stagnated, there are not always clear visions provided to their people of viable ways to future dynamism and progress. In this light, this is not just an economic matter: remaining for long in a development trap is brewing the geography of discontent (Dijkstra, Poelman, and Rodríguez-Pose Citation2020; McCann Citation2020). Subpar economic performances, lack of employment opportunities, and loss of competitiveness are causing social and political resentment toward what is increasingly regarded—justly or unjustly—as a system that does not benefit areas being left behind. Growing regional development traps are fueling the perception that there is a two-tier Europe, divided between a reduced number of dynamic and competitive superregions, in which economic and political power combine, and there are ever-growing ranks of left behind places, increasingly perceived as not to matter or to matter much less than they once did (Rodríguez-Pose Citation2018; McCann and Ortega-Argilés Citation2021).
The problems linked to economically trapped regions have mostly been neglected by European and national decision-makers. In the European context, considerable attention has been devoted to the least advanced regions, due to the obviousness of their economic and social problems. At the other end of the spectrum, national policies have mostly focused on reinforcing the winners, the largest and most economically dynamic urban agglomerations, reflecting the priorities of mainstream urban and regional economics. Caught between these two views, trapped regions have struggled to attract interest. Our purpose in this analysis is to make them visible: the challenge now for policy makers is to add them to their portfolio of concerns. They should strike a balance between sustaining the economic engine of booming urban agglomerations, while at the same time attending to regions in development traps or at risk of falling into them, in the many and varied circumstances that these exist in Europe. But, to repeat, development traps can only be addressed by interventions that go beyond the traditional concern with the less-developed regions.
Because regional development traps can arise in Europe at many different levels of income, they demand attention not just ex post, but also in a forward-looking fashion. Our analysis sounds the alarm bell on these surprisingly widespread risks in Europe. The tool we provide here can be used by policy makers to look forward in a preventive manner, rather than being confined to remedial policies when things are already bad. We also hope that this contribution will stimulate further conceptual and quantitative insights into development traps in European regions.
Supplemental Material
Download MS Word (605.4 KB)Acknowledgments
We are grateful to James Murphy and three anonymous reviewers for their encouragement and critical support throughout the reviewing process. We are also grateful to Laura de Dominicis, Lewis Dijkstra, and Philippe Monfort, for comments and suggestions to earlier parts of the work. Funding for this research is provided by the European Commission, grants 0000-0002-5193-7739, 0000-0002-8354-792X, and 2018CE16BAT055. Andreas Diemer also acknowledges funding from the Swedish Research Council for Health, Working Life and Welfare [2016-07099].
Supplementary material
Supplemental data for this article can be accessed here.
Notes
1 Throughout this article, the term Europe is used to refer to the European Union (EU27), plus the UK. The expression European regions denotes all regions included in the analysis.
2 As pointed out by a reviewer, it is important to clarify that our definition of regional development traps is specific to the context of the EU. The unique, multilevel, institutional setting of European regions was taken into consideration in our definition. This implies that the notion we propose will require adaptation if it is to be applied to other countries or trade areas.
3 Note, however, that from a purely empirical perspective, the presence of traps may often result in slow (or absent) convergence or catch-up, meaning that disentangling one aspect from the other can be challenging.
4 An anonymous reviewer suggested using a TFP measure, instead of worker productivity, as better aligned to what is discussed in the literature. Unfortunately, however, direct information on TFP is not available for all the regions included in the sample and for the time series we need. This measure can, in principle, be backed out from other data (Beugelsdijk, Klasing, and Milionis Citation2018). Yet, this would require additional assumptions as well as data manipulation and imputation that would make it difficult to produce further iterations of our index. Here, we point to this trade-off as a possible open question for future research.
5 As it relies on aggregated data, our analysis is sensitive to what is known as the Modifiable Areal Unit Problem (MAUP), which refers to the bias stemming from how regional boundaries are defined as well as from choices regarding the shape and scale of aggregation. For instance, NUTS2 regions frequently track national administrative divisions. Boundaries may therefore depend on country-specific considerations and reflect varying degrees of independence in local decision-making. Aggregation may also conceal significant variation within the spatial unit itself. There is, however, not much scope for improvement on this dimension, since the data are not available in disaggregated form, nor at lower levels of aggregation in a compatible way for all countries in the EU. This is particularly the case for the long range of years we consider. In addition, while alternative boundary definitions could reveal somewhat different findings, it is also worth highlighting that the NUTS2 definition, however imperfect, is consistent with what national and European policy makers take into account when devising regional policy interventions.
6 In what follows, we refer to these as accelerations as well, rather than deviations, to simplify terminology.
7 This restriction, however undesirable, is another inevitable consequence of MAUP, discussed above.
8 As recommended by Nardo et al. (Citation2008), when the interest is in changes over time rather than just comparing units in the cross-section.
9 This also means that categories mapped in do not exactly match those in .
10 Appendix 5 in the online material, for instance, gives a comparable map with averages over the entire 1990–2015 period.
11 Im and Rosenblatt (Citation2013) highlight that defining income groups in relative, rather than absolute, terms aligns with the convergence literature and is more appropriate to discuss catch-up processes. It is also consistent with the EU’s eligibility criteria for regional development funding (Cohesion Policy 2021–27), which categorize regions using the same thresholds (see https://ec.europa.eu/regional_policy/en/2021_2027 for details). This increases the relevance of our analysis for EU and national policy makers.
12 The introduction of income measured in PPS accounts for geographic differences in the cost of living across EU member states. There are subnational differences, too, which we cannot address due to data limitations.
13 Admittedly, the choice of categorization based on quartiles of the 1990–2015 distribution and income thresholds relative to the EU mean is somewhat arbitrary. Ideally, we would summarize and visualize the data preserving the continuum of index values. However, discretization is required if we wish to present information along multiple other dimensions in our descriptive analysis (such as geography, in this case). We suggest not treating the categories provided as set in stone. The full panel data for both DT1 and DT2 measures are available to researchers interested in carrying out their own analysis based on the concept we propose.
14 Appendix 4, Table A3 in the online material, lists the top fifteen regions in each category for both DT1 and DT2.
15 We depart slightly from the categorization above in that, here, we assign regions based on their DT1 values in each year (rather than their averages over the entire period). Consistently, we also group regions into income categories based on GDP/capita in the same year as the variable of interest. This is preferable, since we allow regions to change category dynamically as they follow their trajectory. However, this could not be done in the maps, which required simplification.
16 Please refer to Brynjolfsson, Rock, and Syverson (Citation2019) and Raj and Seamans (Citation2019) for a more in-depth discussion of these issues, and to Alderucci et al. (Citation2020) for a methodological contribution on measurement.
17 The same graphs were also produced using GDP expressed in constant 2005 prices, confirming the findings.
References
- Abramovitz, M. 1986. Catching up, forging ahead, and falling behind. Journal of Economic History 46 (2): 385–406. doi: 10.1017/S0022050700046209.
- Acemoglu, D., Aghion, P., and Zilibotti, F. 2006. Distance to frontier, selection, and economic growth. Journal of the European Economic Association 4 (1): 37–74. doi: 10.1162/jeea.2006.4.1.37.
- Aghion, P., and Bircan, C. 2017. The middle-income trap from a Schumpeterian perspective. 205. EBRD Working Paper 205. London: European Bank for Reconstruction and Development. doi: 10.2139/ssrn.3119146.
- Aiyar, S., Duval, R. A., Longmei, Z., Puy, D., and Wu, Y. 2013. Growth slowdowns and the middle-income trap. IMF Working Paper WP/13/71. Washington, DC: International Monetary Fund.
- Alderucci, D., Branstetter, L., Hovy, E., Runge, A., and Zolas, N. 2020. Quantifying the impact of AI on productivity and labor demand: Evidence from U.S. Census microdata. Working Paper. https://www.aeaweb.org/conference/2020/preliminary/paper/Tz2HdRna.
- Azariadis, C., and Stachurski, J. 2005. Poverty traps. In Handbook of economic growth, ed. P. Aghion and S. N. Durlauf, 1:295–384. Amsterdam: Elsevier.
- Barrett, C. B., and Swallow, B. M. 2006. Fractal poverty traps. World Development 34 (1): 1–15. doi: 10.1016/J.WORLDDEV.2005.06.008.
- Barro, R. J., and Sala-i-Martin, X. 1992. Convergence. Journal of Political Economy 100 (2): 223–51. doi: 10.1086/261816.
- Barro, R. J., Sala-I-Martin, X., Blanchard, O. J., and Hall, R. E. 1991. Convergence across states and regions. Brookings Papers on Economic Activity 1991 (1): 107–82.
- Ben-David, D., and Papell, D. H. 1998. Slowdowns and meltdowns: Postwar growth evidence from 74 countries. Review of Economics and Statistics 80 (4): 561–71. doi: 10.1162/003465398557834.
- Beugelsdijk, S., Klasing, M. J., and Milionis, P. 2018. Regional economic development in Europe: The role of total factor productivity. Regional Studies 52 (4): 461–76. doi: 10.1080/00343404.2017.1334118.
- Blanchard, O. J., Katz, L. F., Hall, R. E., and Eichengreen, B. 1992. Regional evolutions. Brookings Papers on Economic Activity 1992 (1): 1–75.
- Breinlich, H., Ottaviano, G. I. P., and Temple, J. R.W. 2014. Regional growth and regional decline. In Handbook of economic growth, 2nd ed., ed. P. Aghion and S. N. Durlauf, 2: 683–779.
- Brynjolfsson, E., Rock, D., and Syverson, C. 2019. Artificial intelligence and the modern productivity paradox: A clash of expectations and statistics. In The economics of artificial Intelligence: An agenda, ed. A. Agrawal, J. Gans, and A. Goldfarb, 23–60. Chicago: University of Chicago Press.
- Crescenzi, R., and Iammarino, S. 2017. Global investments and regional development trajectories: The missing links. Regional Studies 51 (1): 97–115. doi: 10.1080/00343404.2016.1262016.
- Damioli, G., Van Roy, V., and Vertesy, D. 2021. The impact of artificial intelligence on labor productivity. Eurasian Business Review 11 (1): 1–25. doi: 10.1007/s40821-020-00172-8.
- Dijkstra, L., Poelman, H., and Rodríguez-Pose, A. 2020. The geography of EU discontent. Regional Studies 54 (6): 737–53. doi: 10.1080/00343404.2019.1654603.
- Dunford, M., and Smith, A. 2009. Catching up or falling behind? Economic performance and regional trajectories in the “new Europe.” Economic Geography 76 (2): 169–95. doi: 10.1111/j.1944-8287.2000.tb00139.x.
- Eichengreen, B., Park, D., and Shin, K. 2012. When fast-growing economies slow down: International evidence and implications for China. Asian Economic Papers 11 (1): 42–87. doi: 10.1162/ASEP_a_00118.
- Eichengreen, B., Park, D., and Shin, K. 2014. Growth slowdowns redux. Japan and the World Economy 32 (November): 65–84. doi: 10.1016/J.JAPWOR.2014.07.003.
- Ellison, G., and Glaeser, E. L. 1997. Geographic concentration in U.S. manufacturing industries: A dartboard approach. Journal of Political Economy 105 (5): 889–927. doi: 10.1086/262098.
- European Commission. 2017a. Competitiveness in low-income and low-growth regions: The lagging regions report. SWD(2017) 132 Final. Brussels, Belgium: European Commission. http://ec.europa.eu/regional_policy/en/information/publications/reports/2017/competitiveness-in-low-income-and-low-growth-regions-the-lagging-regions-report.
- European Commission. 2017b. My region, my Europe, our future: Seventh report on economic, social and territorial cohesion, ed. L. Dijkstra. Brussels, Belgium: European Commission, Directorate General for Regional and Urban Policy. http://ec.europa.eu/regional_policy/en/information/cohesion-report/.
- European Commission. 2022. Cohesion in Europe towards 2050: Eighth report on economic, social and territorial cohesion, ed. L. Dijkstra. Brussels, Belgium: European Commission, Directorate General for Regional and Urban Policy. https://ec.europa.eu/regional_policy/en/information/cohesion-report/.
- Fagerberg, J. 1994. Technology and international differences in growth rates. Journal of Economic Literature 32 (3): 1147–75. http://www.jstor.org/stable/2728605.
- Fagerberg, J., and Mira Godinho, M. 2006. Innovation and catching-up. In Handbook of innovation, ed. Ja. Fagerberg and D. C. Mowery. Oxford: Oxford University Press.
- Fagerberg, J., and Verspagen, B. 1996. Heading for divergence? Regional growth in Europe reconsidered. JCMS: Journal of Common Market Studies 34 (3): 431–48. doi: 10.1111/j.1468-5965.1996.tb00580.x.
- Gill, I. S., and Kharas, H. 2007. An East Asian renaissance: Ideas for economic growth. Washington, DC: World Bank.
- Gill, I. S., and Kharas, H. 2015. The middle-income trap turns ten. Policy Research Working Papers. Washington, DC: World Bank.
- Hausmann, R., Pritchett, L., and Rodrik, D. 2005. Growth accelerations. Journal of Economic Growth 10 (4): 303–29. doi: 10.1007/s10887-005-4712-0.
- Hsieh, C.-T., and Klenow, P. J. 2010. Development accounting. American Economic Journal: Macroeconomics 2 (1): 207–23. doi: 10.1257/mac.2.1.207.
- Iammarino, S., and McCann, P. 2013. Multinationals and economic geography: Location, technology and innovation. Cheltenham, UK: Edward Elgar.
- Iammarino, S., Rodríguez-Pose, A., and Storper, M. 2019. Regional inequality in Europe: Evidence, theory and policy implications. Journal of Economic Geography 19 (2): 273–98. doi: 10.1093/JEG/LBY021.
- Im, F. G., and Rosenblatt, D. 2013. Middle-income traps: A conceptual and empirical survey. Policy Research Working Papers. Washington, DC: World Bank.
- Kharas, H., and Kohli, H. 2011. What is the middle income trap, why do countries fall into it, and how can it be avoided? Global Journal of Emerging Market Economies 3 (3): 281–89. doi: 10.1177/097491011100300302.
- Lee, K. 2019. The art of economic catch-up: Barriers, detours and leapfrogging in innovation systems. Cambridge: Cambridge University Press.
- Lee, K., and Malerba, F. 2017. Catch-up cycles and changes in industrial leadership: Windows of opportunity and responses of firms and countries in the evolution of sectoral systems. Research Policy 46 (2): 338–51. doi: 10.1016/J.RESPOL.2016.09.006.
- Magrini, S. 2004. Regional (di)convergence. In Handbook of regional and urban economics, ed. J. V. Henderson and J.-F. Thisse, 4:2741–96. London: Elsevier.
- Martin, R., and Sunley, P. 1998. Slow convergence? The new endogenous growth theory and regional development. Economic Geography 74 (3): 201–27. doi: 10.1111/j.1944-8287.1998.tb00113.x.
- Martin, R., and Tyler, P. 2000. Regional employment evolutions in the European Union: A preliminary analysis. Regional Studies 34 (7): 601–16. doi: 10.1080/00343400050178410.
- McCann, P. 2020. Perceptions of regional inequality and the geography of discontent: Insights from the UK. Regional Studies 54 (2): 256–67. doi: 10.1080/00343404.2019.1619928.
- McCann, P., and Ortega-Argilés, R. 2021. The UK ‘geography of discontent’: Narratives, Brexit and inter-regional ‘levelling up.’ Cambridge Journal of Regions, Economy and Society 14 (3): 545–64. doi: 10.1093/CJRES/RSAB017.
- Nardo, M., Saisana, M., Saltelli, A., Tarantola, S., Hoffmann, A., and Giovannini, E. 2008. Handbook on constructing composite indicators: Methodology and user guide. Paris: OECD. http://www.oecd.org/els/soc/handbookonconstructingcompositeindicatorsmethodologyanduserguide.htm.
- Neffke, F., Hartog, M., Boschma, R., and Henning, M. 2018. Agents of structural change: The role of firms and entrepreneurs in regional diversification. Economic Geography 94 (1): 23–48. doi: 10.1080/00130095.2017.1391691.
- Porto, T. C., Lee, K., and Mani, S. 2021. The US–Ireland–India in the catch-up cycles in IT services: MNCs, indigenous capabilities and the roles of macroeconomic variables. Eurasian Business Review 11 (1): 59–82. doi: 10.1007/S40821-020-00177-3/FIGURES/7.
- Quah, D. T. 1996a. Regional convergence clusters across Europe. European Economic Review 40 (3): 951–58. doi: 10.1016/0014-2921(95)00105-0.
- Quah, D. T. 1996b. Twin peaks: Growth and convergence in models of distribution dynamics. Economic Journal 106 (437): 1045–55. doi: 10.2307/2235377.
- Quah, D. T. 1997. Empirics for growth and distribution: Stratification, polarization, and convergence clubs. Journal of Economic Growth 2 (1): 27–59. doi: 10.1023/A:1009781613339.
- Raj, M., and Seamans, R. 2019. Artificial intelligence, labor, productivity, and the need for firm-level data. In The economics of artificial intelligence: An agenda, ed. A. Agrawal, J. Gans, and A. Goldfarb, 553–66. Chicago: University of Chicago Press.
- Rodríguez-Pose, A. 2018. The revenge of the places that don’t matter (and what to do about it). Cambridge Journal of Regions, Economy and Society 11 (1): 189–209. doi: 10.1093/cjres/rsx024.
- Rodríguez-Pose, A., and Ganau, R. 2022. Institutions and the productivity challenge for European regions. Journal of Economic Geography, 22 (1): 1–25. doi: 10.1093/jeg/lbab003.
- Rodríguez-Pose, A., and Ketterer, T. 2020. Institutional change and the development of lagging regions in Europe. Regional Studies 54 (7): 974–86. doi: 10.1080/00343404.2019.1608356.
- Sassi, M. 2011. Convergence across the EU regions: Economic composition and structural transformation. International Advances in Economic Research 17 (1): 101–15. doi: 10.1007/s11294-010-9286-8.
- Storper, M. 2018. Separate worlds? Explaining the current wave of regional economic polarization. Journal of Economic Geography 18 (2): 247–70. http://doi.org/10.1093/jeg/lby011.
- Vivarelli, M. 2016. The middle income trap: A way out based on technological and structural change. Economic Change and Restructuring 49 (2–3): 159–93. doi: 10.1007/s10644-015-9166-6.