
 ?Mathematical formulae have been encoded as MathML and are displayed in this HTML version using MathJax in order to improve their display. Uncheck the box to turn MathJax off. This feature requires Javascript. Click on a formula to zoom.
Abstract
We study the role of local industrial embeddedness (the share of regional interindustry economic activity that is anchored to a region) on regional resistance (the difference between pre- and postcrisis employment) to the 2008 Great Recession (GR) in EU and UK NUTS-2 regions. The recession had profound effects in regional economies, which showed diverse performance based on their capacity to absorb the shock. The concept of economic resilience has been brought to the center of attention with several contributions exploring its determinants. However, the impact of the embeddedness of local economic systems in terms of sales and supplies has been largely unexplored. We use regional input–output tables to approximate the embeddedness of local economies, and we use fixed-effects and quantile regressions to test its relationship to regional resistance between 2008 and 2011. We find that during the GR, regional industries opted to change input rather than output markets. Additionally, embeddedness has a curvilinear relationship to regional resistance that varies across the distribution of regional resistance performance. Finally, at the industry level, we find regional embeddedness to be important to the resistance of manufacturing and financial and business services, and sectoral embeddedness to matter more for the resistance of construction and wholesale, retail, and information technology. Our findings highlight nuances that policy makers should be aware of in planning for resilience.
The 2008 crisis significantly affected European labor markets until at least 2010 (), leading to prolonged impacts and, in some cases, hysteretical effects. However, not every region suffered the same. The Great Recession (GR), as well as the more recent COVID-19 crisis, have highlighted how systemic shocks have spatially unbalanced impacts across and within countries. The frequency of these events makes more pertinent than ever the study of how regions can absorb and recover from a shock under the notion of regional economic resilience (Bailey et al. Citation2020). The flourishing research since 2008 has seen significant conceptual and operational developments and identified a range of resilience determinants, spanning the micro- to macrolevel from individual characteristics (Doran and Fingleton Citation2016) to local industrial structures (Martin et al. Citation2016) where our contribution lies.
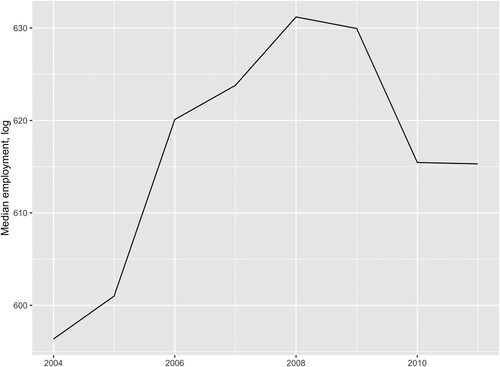
Figure 1. The evolution of median employment in NUTS-2 regions between 2004 and 2011.
To date, studies on the effects of industrial structures on economic resilience tested the role of determinants such as the local industrial mix (Martin Citation2012; Lee Citation2014; Webber, Healy, and Bristow Citation2018), regional specialization versus diversification (Fingleton and Palombi Citation2013; Di Caro Citation2017; Shutters et al. Citation2021) as well as relatedness (in terms of industries, technology, and knowledge) and path dependency (Balland, Rigby, and Boschma Citation2015; Xiao, Boschma, and Andersson Citation2018; Fusillo, Consoli, and Quatraro Citation2022). Broadly, the findings of this literatureFootnote1 suggest that a large and diversified industrial structure assists places in being more adaptive in the face of adversity not only via the reduction of risk through portfolio diversification but also via the generation of knowledge and ideas that allow places to innovate their way out of a recession. Most of these studies have identified the above effects using the colocation of firms in similar industrial classes as a signal of intersectoral connectivity but with limited information on the spatial embeddednessFootnote2 of industrial structures in their host region.
Embeddedness can generate positive externalities for local firms during growth and crisis periods, capitalizing on formal and informal institutions (Billington et al. Citation2017; Völlers, Yavan, and Franz Citation2021); cluster effects, for example, skill pools and knowledge spillovers (Delgado, Porter, and Stern Citation2010; Behrens, Boualam, and Martin Citation2019; Delgado and Porter Citation2021) or even solidarity (Wrobel Citation2015); or what Parr (Citation2002) and Parr et al. (Citation2002) refer to as activity-complex economies, for example, reduced transaction costs from the spatial proximity of interacting firms and sectors. However, strong embeddedness can also lead to lock-in effects where a cluster or local industrial structure is too inward facing and shielded from competitive pressures or global information flows, with terms such as cognitive myopia being coined in the literature (Boschma and Iammarino Citation2009; Buciuni and Pisano Citation2018). In addition, strong input–output (IO) links within a region could propagate sectoral shocks among other sectors locally (Acemoglu, Ozdaglar, and Tahbaz-Salehi Citation2013; Diodato and Weterings Citation2015), turning an industry shock into a widespread regional crisis.
Research to date is inconclusive on whether positive or negative forces dominate during recessions as well as the relationship between embeddedness and the capacity of a region to absorb a shock. Moreover, the coexistence of positive and negative externalities raises questions of whether any relationship is monotonic, consistent across the distribution of regional performance, and whether it varies at the sectoral level.
We aim to fill these gaps by examining the role of regional economic embeddedness on labor market resistance across EU and UK NUTS-2 regions during the period 2008–11. We define resistance as the difference between the pre- and post-2008 employment levels in a region and use the EUREGIO database (Thissen et al. Citation2018) to estimate sectoral embeddedness shares that are weighted and aggregated to provide forward (sales) and backward (supplies) embeddedness measures for each region. These allow us to use fixed-effects and quantile regressions to test three sets of hypotheses on the impact of the GR on firms’ supplies and product market orientation as well as the effect of embeddedness on regional and sectoral resistance to the 2008 shock.
We contribute to the existing literature in three ways. First, we provide new evidence on the role of embeddedness on regional resistance and the nuances of this relationship. We test the effect of forward and backward IO linkages across different regions in the EU and UK. Second, we examine the heterogeneity of effects from embeddedness to resistance in different parts of the distribution of regional resistance performance. Third, we shed light on the importance of sectoral versus regional embeddedness on sectoral resistance to the 2008 crisis.
We have four main findings. First, we identify a sharp drop in supplies embeddedness after 2008, with the share of local supplies dropping from above 50 percent to below and often reaching close to zero. The timing of this drop points to changing trade patterns due to the GR. This is not the case for sales embeddedness, which remains rather stable during 2000–10. Second, we find an inverted U-shaped relationship between sales and supplies embeddedness and regional resistance to the GR with different turning points for sales (56 percent) and supplies (64.5 percent) embeddedness. Third, we find that the impact of embeddedness is heterogeneous along quantiles of regional resistance performance and varies between sales and supplies embeddedness. Finally, our results on sectoral resistance point to significant variation in the importance of regional and sectoral embeddedness on the capacity of sectors to absorb the shock.
The rest of the article runs as follows. The next section provides the literature background and develops the hypotheses to be tested. This is followed by an outline of the measurement of our main variables of interest (resistance and embeddedness) and our empirical design. Results are shown in the penultimate section, and the final section summarizes the findings, and discusses policy implications and areas for further research.
Theoretical Background
Economic Resilience and Its Determinants
The notion of resilience found its way to regional economics and economic geography from ecological studies. The use of the term to explain and draw attention to the differential ability of places to avoid or overcome a crisis means it has quickly gained popularity among academics and policy makers.
Conceptually, the initial understanding of economic resilience followed the single equilibrium approach, where a local economy is expected to return to a steady state after facing a disturbance (engineering resilience). The concept further evolved to multiple equilibria and evolutionary approaches, which consider the capacity of a place to adapt and transform in the face of adversity (Martin and Sunley Citation2014; Kitsos Citation2020). Of considerable relevance to our study is the Panarchy framework of resilience that originated in ecological studies and treats socioecological systems as complex adaptive systems that follow a cycle of growth, conservation, release, and reorganization where the internal connectedness and interdependence of a system is crucial to its ability to mitigate a shock (Gunderson and Holling Citation2002; Shutters, Muneepeerakul, and Lobo Citation2015). In economic geography, some of the latest conceptual developments see resilience as the outcome of different stages corresponding to the recession and recovery part of a crisis (Sensier, Bristow, and Healy Citation2016; Martin and Gardiner Citation2019; Kitsos Citation2020). Martin and Sunley (Citation2014), for example, define resilience as a process comprised of the stages of vulnerability, which represents an economy’s exposure to shocks; resistance, which signals the capacity of a region to absorb a shock; robustness, which highlights the adaptation of local socioeconomic systems; and recoverability, which focuses on the postrecession growth path.
As the concept of resilience gained attention, empirical studies gathered evidence on its determinants. Conceivably, such a multifaceted concept is found to be affected by a wide range of factors spanning from the industrial structure of local economies to physical, institutional, and individual characteristics. Our study is positioned on local industrial structures where the existing literature is centered around three broad elements: (1) sectoral composition of local economies; (2) the diversity and specialization patterns and the relatedness; and (3) coherence of local industrial structures, and their impact on local resilience performance.
Initial expositions of the effect of local industrial ecosystems on resilience to crises have predominantly taken the form of measuring the effect of the local sectoral composition (i.e., share of employees in a particular industry) or industry characteristics on the crisis impact. Reliance on manufacturing or financial services can partly explain the spatial footprint of several shocks in the UK since the 1970s (Martin Citation2012; Lee Citation2014). For the EU, Webber, Healy, and Bristow (Citation2018) suggest that regions with significant employment shares in high demand-elastic, cyclical industries, such as textiles and creative industries, had worse resilience outcomes, while Hill et al. (Citation2010) find a negative effect of the share of employment in durables manufacturing in US metropolitan regions. On the other hand, Martin et al. (Citation2016) show that there has been a reduction in the explanatory power of local industrial structures on the resilience performance of UK regions. This is echoed by Kitsos and Bishop (Citation2018) who find no statistically significant effect for the share of employment in either manufacturing or services on the resilience of local authority districts in the UK. In contrast, Di Caro (Citation2015) evidences the importance of manufacturing for the high resilience performance of Italian regions. The variety of results above suggests that simply measuring the prominence of a sector in a local economy may not be able to capture its complex impact on resilience.
Adding more nuanced characteristics to the relationship between local industrial structures and economic resilience, studies turned to the specialization versus diversification debates. In accordance with portfolio theory, diversity is found to assist a region during a crisis in a range of spatial and research design settings. Shutters, Muneepeerakul, and Lobo (Citation2015) and Shutters et al. (Citation2021) use the colocation of occupations to generate measures of economic tightness that represent internal economic connectedness in local economies in US and German cities. High tightness is associated with specialization; Panarchy’s conservation stage; and low resilience capacity as opposed to low tightness, which signals diversity and high resilience performance. Di Caro (Citation2015, Citation2017) finds that diversity has improved the resilience of Italian regions since the 1990s, while Fingleton and Palombi (Citation2013) suggest that specialization had a negative effect on the capacity of British towns to face adverse economic conditions at the end of the nineteenth century.
Finally, a third strand of the literature focuses on the importance of relatedness and evolution in industrial structures for resilience (Martin and Sunley Citation2014; Martin et al. Citation2016; Webber, Healy, and Bristow Citation2018). Xiao, Boschma, and Andersson (Citation2017) show that both related and unrelated variety are important predictors of industrial resilience, which they define as the capacity of regions to develop new industrial specializations in response to a crisis. Balland, Rigby, and Boschma (Citation2015) show that diverse and adaptable knowledge bases can enhance the resilience of innovation in US cities. This finding is confirmed by Fusillo, Consoli, and Quatraro (Citation2022) who suggest that industrial diversity enhances resilience of US metros, but excess technological diversity can be detrimental. This echoes Rocchetta and Mina (Citation2019) who stress the role of technological coherence, measured by the colocation and closeness of patent performance, in explaining differential resilience in UK NUTS-3 regions.
Most of these approaches consider different attributes of local industrial structures based on the number of firms or employment in one or more sectors, with the underlying assumption that colocated businesses (or jobs) in similar industries have similar supply and demand characteristics with only a minority of studies being able to directly observe the interconnectivity of local sectors. Adding an IO dimension to these understandings of relatedness, Han and Goetz (Citation2019) conclude that highly interconnected US counties are more resilient to economic shocks. However, Cainelli, Ganau, and Modica (Citation2019) find that technological relatedness (proxied by similarity of inputs) enhances resilience in the short run via the diversity of input utilization, but vertical relatedness (proxied by IO flows) has a negative long-run impact due to contagion effects. Lacking regional level IO data, both studies combine national information with regional level colocation information to approximate regional IO relationships. Despite the breadth of research on the topic, the relationship between local economic resistance and the extent to which local industries are linked to each other and embedded in their region via IO relationships remains largely elusive.
Regional Embeddedness, Resilience, and Resistance
The degree of embeddedness of local industrial structures may generate positive externalities that assist a region facing a downturn. These externalities stem from the benefits to firms when they are near their suppliers and buyers and range from the building of trust to formal and informal knowledge flows, innovation, and the decrease of transaction costs. Firm-level benefits are then aggregated to strong cluster and regional resilience performance based on the interconnectedness of the local industrial economy.
At the firm level, territorial embeddedness allows businesses to engage with formal and informal institutions that generate adaptive capabilities during crises. Lengnick-Hall and Beck (Citation2005) highlight the role of deep social capital and access to resource networks as a crucial component of a business’s resilience response. They call this contextual resilience that capitalizes on trust relationships built over time in order to provide access to knowledge flows and other resources at recession periods. Völlers, Yavan, and Franz (Citation2021) build on the call from Rodríguez-Pose (Citation2020) for more research on the role of formal and informal institutions on territorial development, and document how strongly embedded German investments use these formal and informal institutions to leverage rising political risks in Turkey. Billington et al. (Citation2017) use four case studies in Norway to highlight the role of physical proximity. In their view, an organization’s host region provides the environment in which contextual resilience is built, and hence the resilience of the business and its host region is interlinked. Further linking firm and regional resilience, Soroka et al. (Citation2020) use business financial information in Cardiff, Wales, and find that locally headquartered businesses have greater attachment to the region and lower risk of closure, contributing to the region’s resilience performance.
At the cluster level, Delgado, Porter, and Stern (Citation2010) and Glaeser and Kerr (Citation2009) highlight how spatially concentrated clusters create specialized skills pools that in turn encourage firm entry and improve entrepreneurship rates, while Wrobel (Citation2015) offers evidence of solidarity and altruism among cluster firms in Germany that partly mitigated the negative impact of the GR during 2008–09. Furthermore, to the extent that local economic embeddedness, in the form of IO relationships, signals knowledge flows, increased embeddedness is expected to lead to higher innovation activity (Neffke, Henning, and Boschma Citation2011; Boschma Citation2015; Behrens, Boualam, and Martin Citation2019; Delgado and Porter Citation2021). Indeed, research on firm innovation found that both suppliers and buyers benefit from their trading partners’ innovation activity (de Jong and von Hippel Citation2009; Isaksson, Simeth, and Seifert Citation2016).
At the regional economy level, Parr (Citation2002) and Parr et al. (Citation2002) use the term activity-complex economies for the externalities that arise from IO linkages among local industries. These externalities include reduced transport costs from using inputs and/or sending goods to proximate destinations, efficiency gains on input utilization by sharing inputs or production by-products from neighboring industries, reductions in the need for inventories with more just-in-time supply-chain flexibility, and lower hierarchical coordination costs with improved knowledge flows and communication-related transaction costs (McCann Citation1995).
During crises, the adaptability and reduced average costs enabled by the above mechanisms allow local firms to absorb the downward pressure on prices that stems from increased competition and reduced demand. The specialized skills pools and enhanced entrepreneurial environment, in conjunction with the increased formal and informal ties, knowledge flows, and innovation activity, improve the adaptability of local economies and lead to the emergence of new industries and the creation of new development paths (Boschma Citation2015). As such, Delgado and Porter (Citation2021) find that the strength of clusters (defined by its economic performance), as well as its breadth (of activities), are positive contributors to the resilience of local industries during the GR. These positive effects are generated by interfirm relationships in the form of products (IO trading), employment, and knowledge flows, which are exceedingly important during downturns.
However, too much embeddedness may have negative effects on business and local resilience performance as well. Strong ties in terms of IO relationships between sectors in the same area mean extensive propagation channels that can transmit crises across sectors and space (Jovanovic Citation1987; Acemoglu, Ozdaglar, and Tahbaz-Salehi Citation2013). Additionally, having a closely knit local industrial structure with limited interaction to outside competition and/or cooperation may lead to lock-in effects, and reduce knowledge flows and the adaptive capacity of regions in the face of adversity (Grabher Citation1993; Boschma and Iammarino Citation2009; Andersson, Bjerke, and Karlsson Citation2013; Shutters, Muneepeerakul, and Lobo Citation2015).
Uzzi (Citation1997) discusses these issues as the paradox of embeddedness, while studies, such as Becattini and Rullani (Citation1996), Maskell and Malmberg (Citation2007), and Bathelt and Cohendet (Citation2014), all highlight the need for combinations of local and global knowledge networks to avoid the cognitive myopia (Buciuni and Pisano Citation2018) identified by Grabher (Citation1993) in Germany’s Ruhr Valley. Due to the extensive interconnectedness and the lack of competition and knowledge flows, businesses and regions that are too inward looking are more likely to show reduced resistance during a recession. These negative effects are behind Shutters, Muneepeerakul, and Lobo’s (Citation2015) and Shutters et al.’s (Citation2021) findings on the inverse relationship between tightness and urban resilience performance in Germany and the US.
Hypotheses
Overall, based on this evidence, we hypothesize that embeddedness has an inverted U-shaped relationship to local economic growth and resilience. On the one hand, within-region intersectoral relationships generate positive externalities that help regions during a recession. On the other hand, too strong ties may stifle knowledge creation and reduce competitiveness, leading to deeper impacts from shocks. The embeddedness of local production system has two facets: industries are embedded locally via their backward linkages (i.e., the share of intermediate inputs that are supplied locally) and via their forward linkages (i.e., the share of intermediate outputs that is sold locally) (Dietzenbacher Citation2002; Midmore, Munday, and Roberts Citation2006). Backward linkages show input dependence by sector, that is, the origin of a sector’s supplies compared to total production. Forward linkages analyze dependencies from the opposite direction, that is, the location of a sector’s output compared to total production. We distinguish between supplies and sales linkages and formulate our first set of hypotheses:
H1a: Regional sales embeddedness has an inverted U-shaped relationship to regional resistance to the 2008 crisis.
H1b: Regional supplies embeddedness has an inverted U-shaped relationship to regional resistance to the 2008 crisis.
The variety of regional responses to the 2008 shock is, among other factors, the outcome of differential between- and within-region dynamics, and indeed, the next two sets of hypotheses focus on exploring these different aspects. First, it is increasingly being understood that the impact of regional growth factors can vary along the distribution of regional growth. Costa-i-Font and Rodriguez-Oreggia (Citation2005) find that public investment can reduce regional inequalities in Mexican regions only among the top quantile of the regional income distribution, while Crespo-Cuaresma, Foster, and Stehrer (Citation2011) suggest that growth determinants, such as skills and physical investments, have varying effects on regions in different parts of the growth distribution.
Focusing on regional resilience, studies have recently started to explore the differential impact of determinants in regions along the distribution of resilience performance. Fusillo et al. (Citation2022) study the impact of related and unrelated variety on different parts of the distribution of resilience for US metro areas, while Nyström (Citation2018) and Östh et al. (Citation2018) test the heterogeneous effects of resilience determinants along the distribution of resilience for Swedish regions. Thus, it is possible that the impact of embeddedness on regional resistance varies according to a region’s resistance performance. This is particularly pertinent because we expect embeddedness to have a nonlinear relationship to resistance and be critical for the development of policy propositions, since one-size-fits-all policies are unlikely to be optimal if embeddedness affects regions differently based on their overall resistance performance. Hence, we formulate the following set of hypotheses:
H2a: The impact of regional sales embeddedness on resistance varies within the regional resistance distribution.
H2b: The impact of regional supplies embeddedness on resistance varies within the regional resistance distribution.
Second, regional resistance is the outcome of resistance at the sectoral level within each region. Beyond the spatial heterogeneity of industrial structures, trade relationships, and openness (Thissen et al. Citation2018), different sectors have varying demand, competition, location characteristics, and production technologies (Okuyama et al. Citation2004). These factors interact with the origin and transmission patterns of crises and translate into variable local impacts of recessions (Martin Citation2012; Kitsos Citation2020). For example, the 1980s crisis in the UK disproportionately affected production industries in the North and Midlands, while the one in the 1990s had greater effects on services and the economies based on service provision more prevalent in the South (Martin Citation2012). The GR is different in that it is a systemic crisis that originated in financial services and propagated to the rest of the economy but arguably with different intensity.
It is then interesting to examine sectoral resistance at the regional level and the influence that embeddedness has on it. In this case, embeddedness can take two forms. The first is the regional embeddedness discussed above that signals the knowledge flows and local anchoring of an industrial system across regions. A second form of embeddedness could focus on a sector’s embeddedness to its host region, representing knowledge flows and anchoring of that sector. The next set of hypotheses aims to identify the relationship between sectoral and regional embeddedness on the resistance performance of sectors.
H3a: Sector and regional sales embeddedness have an inverted U-shaped relationship to sectoral resistance.
H3b: Sector and regional supplies embeddedness have an inverted U-shaped relationship to sectoral resistance.
The evidence on the above hypotheses so far is scarce. Diodato and Weterings (Citation2015) suggest that embeddedness of supply chains makes Dutch regions more susceptible to internal shocks and more resistant to external ones. The closest study to ours is that of Kitsos, Carrascal-Incera, and Ortega-Argilés (Citation2019) who test the role of supplies embeddedness in the context of UK NUTS-2 regions and confirm a U-shaped relationship to employment growth during downturns. We build on this using a research design that tests the impact of both sales and supplies embeddedness on the difference between pre- and post-2008 employment levels. In addition, we test for heterogeneity of effects across the resistance distribution as well as the impact of embeddedness on sectoral resistance, which provide significant policy insights.
Empirical Framework
Measuring the Resistance of Regional Labor Markets
Operationally, there have been several alternative propositions to measure resilience from single proxies, with employment being the most popular (Martin Citation2012; Sensier, Bristow, and Healy Citation2016; Giannakis and Bruggeman Citation2020; Kitsos Citation2020), to composite indices (Pontarollo and Serpieri Citation2020; Soroka et al. Citation2020). The emphasis on labor market performance is due to both conceptual and practical reasons. Job cuts are one of the most prominent options available to businesses faced with a recession (Fingleton, Garretsen, and Martin Citation2012), while labor markets reflect wider socioeconomic conditions, with joblessness being associated with a range of social ills such as human capital depreciation, reductions in well-being and happiness, and increases in criminality (Bell and Blanchflower Citation2010). From a practical perspective, labor market statistics are more accurate and timely compared to output measures, particularly at subnational geographies.
As such, using employment data, studies measure resilience either by comparing regional to national labor market performance (Martin et al. Citation2016; Cainelli, Ganau, and Modica Citation2019; Giannakis and Bruggeman Citation2020) or by comparing the performance of a region to itself, which allows regions to individually have a downturn instead of being benchmarked to the national performance (Sensier, Bristow, and Healy Citation2016; Kitsos and Bishop Citation2018; Kitsos, Carrascal-Incera, and Ortega-Argilés Citation2019). In our case, we use the difference of employment in a region between pre- and post-2008. Given data constraints in the measurement of embeddedness (annual data available during 2000–10), we focus on the recession part of the 2008 crisis and, following Martin and Sunley (Citation2014), to the resistance aspect of the resilience process.
(1)
(1)
EquationEquation 1(1)
(1) shows our resistance measure
that is calculated for each region r and time-period t by taking the logarithm of the difference between each year’s regional employment level
during 2008–11 and the average employment for the period 2004–7
. To this difference, we add the minimum plus one in order not to lose observations due to the logarithmic transformation. Independent variables that have a positive coefficient on
will be strengthening regional resistance outcomes while the opposite will be true for negative coefficients.
Measuring Embeddedness Using Input–Output Data
An IO framework accounts for each firm’s purchases and sales whether these are from/to other firms or from other sources or to other destinations (households, government, etc.). In a multiregional setting, the location of each firm,Footnote3 as well as the origin and destination of its trade flows, are accounted for. We therefore define regional embeddedness as the share of economic activity that takes place between the firms within a specific region over the total regional production.
The data used to calculate our embeddedness measures come from the recent EUREGIO database (see Thissen et al. [Citation2018] for a full description), which provides spatially and sectorally disaggregated imports and exports information on 256 European NUTS-2 regions and 14 different sectors. Footnote4 These are the most detailed available data on trade (both goods and services) and production structures at the subnational level. EUREGIO is also consistent with the World Input–Output Database (WIOD) (Timmer et al. Citation2015) and, therefore, with data from national accounts.Footnote5 However, due to the difficulty of obtaining such disaggregated regional trade information, the main weakness of this database is its short period (from 2000 to 2010) and the small number of sectors included.
Embeddedness can be viewed from the perspective of supplies (backward) linkages or sales (forward) linkages and is expected to vary from one sector/region to another due to different technologies used, economic dynamism, and industrial orientation. The analysis below accounts for these differences by examining both sales and supplies embeddedness. These are calculated both by sector in each region and in an aggregate form representing the embeddedness level of regional industrial structures.
Starting with supplies embeddedness, this is the share of local production generated by using local inputs. It reflects the importance of intermediate sectoral interrelatedness over the total production, the direct linkages in the production process, and the technology of production by sector (how independent are the intermediate inputs used in local production). Thus, local supplies embeddedness (EquationEquation 2(2)
(2) ) can be defined as
(2)
(2) where Z are the intermediate flows between sectors i and j (n being the total number of sectors), d stands for domestic flows (e.g., transactions between sectors within the same region), and m represents imported inputs from outside the region. Supplies embeddedness, by construction, ranges between 0 and 1.
Embeddedness, though, could also be viewed with regard to the destination of sales. As discussed, having a large local customer base means that intermediate production is not subject to external factors that could limit its demand. This may be beneficial to a certain extent, but it can also signal lower competitiveness in international markets and lack of demand diversification. Accordingly, local sales embeddedness (EquationEquation 3(3)
(3) ) can be defined as
(3)
(3) where again Z are intermediate flows between sectors i and j, d stands for domestic flows, and e represents sales to sectors outside the region. Sales embeddedness also ranges between 0 and 1.
To represent the degree of regional embeddedness with a single measure Emb (EquationEquation 4(4)
(4) ) for sales or supplies embeddedness for each region (r) and year (t), we use a weighted average of sectoral embeddedness figures. The weights are the sectoral (i) shares to the total regional output and are used to avoid placing the same importance on the embeddedness of sectors with different sizes locally. Consequently, in EquationEquation 4
(4)
(4) , the embeddedness of large local sectors has greater weight than the embeddedness of smaller local sectors.
(4)
(4)
Similar to the constituent measures, the regional embeddedness measure of EquationEquation 4(4)
(4) ranges between 0 and 1.
The additionality of our embeddedness measure compared to relatedness metrics used in the literature (Xiao, Boschma, and Andersson Citation2018; Cainelli, Ganau, and Modica Citation2019) is that IO origin–destination flows allow us to quantify the strength of linkages between sectors. Hence, we can approximate how close sectors are in each region based on estimated intermediate transactions between sectors rather than the cooccurrence of industries or the adjacency of classification codes (i.e., NACE). Importantly for our study, our measure of embeddedness enables us to distinguish between sales and supplies embeddedness and study their effects on regional resistance.
Empirical Design
We examine our hypotheses in the context of 126 EU and UK NUTS-2 regions,Footnote6 considering the relationship between resistance and embeddedness while accounting for a wide set of controls such as region and time fixed effects and regional labor market conditions. To test Hypotheses H1a and H1b, we use fixed-effects regressions that control for the unobserved time and place invariant characteristics of different regions and are estimated using the following equation:
(5)
(5)
All independent variables enter the regression in lagged form and refer to year , which partly alleviates potential endogeneity issues.Footnote7
is the weighted measure of local embeddedness, and
is its squared term, which is included to test for a nonlinear relationship. Finally,
is a vector of control variables, while
represents region fixed effects (or FE),
year fixed effects, and
is the error term.
includes a set of regional socioeconomic characteristics that are related to regional employment growth and resilience (Wolfe Citation2010; Lee Citation2014; Martin and Sunley Citation2014). Gross fixed capital formation (GFCF pc (log)) proxies investment per capita in a region, which may influence employment creation. Economic growth is accounted for by including the annual growth rate of gross value added (GVA growth) for each region, while the role of human capital for employment growth is controlled by the percentage of population with a tertiary degree (Education). The share of employment in high-tech sectors indicates how technologically advanced a region is, which is expected to positively influence employment growth overall. Lastly, population density (Pop. density (log)) is used to account for agglomeration externalities arising from diversified economic activities (Jacobs’s externalities) and its benefits to employment growth, while a region’s unemployment rate controls for the labor market conditions. provides summary statistics, definitions, and data sources for the main dependent and independent variables.
Table 1 Summary Statistics and Definitions
To test the differential impact of embeddedness across the distribution of regional resistance (Hypotheses H2a and H2b), we use quantile regressions based on Koenker and Bassett (Citation1978) and EquationEquation 5(5)
(5) . The quantile regressions allow the coefficients of our independent variables to vary for different quantiles of the dependent variable and enable us to identify if embeddedness is more (or less) important in different parts of the regional resistance distribution. Quantile regressions have been widely used in labor economics and the study of regional wage and growth differentials (Costa-i-Font and Rodriguez-Oreggia Citation2005; Crespo-Cuaresma, Foster, and Stehrer Citation2011) but less so in the study of regional resistance to crises with notable exceptions (Nyström Citation2018; Östh et al. Citation2018; Fusillo, Consoli, and Quatraro Citation2022).
Finally, to examine the relationship between embeddedness and resistance at the sectoral level (Hypotheses H3a and H3b), we combine our existing data set with sectoral employment data by region from ARDECO.Footnote8 Differences in the sectoral definitions between the ARDECO and EUREGIO data sets mean that the range of sectors we can examine is restricted by our ability to match these definitions. We were able to reliably match five sectors, namely, Agriculture, Forestry, and Fishing (S1); Industry (S2); Construction (S3); Wholesale, Retail, Transport, Accommodation & Food Services, Information and Communication (S4); Financial and Business Services & Non-Market Services (S5) ().Footnote9
Table 2 Matching between Sectors in ARDECO and EUREGIO Databases
We then modify EquationEquation 5(5)
(5) as below:
(6)
(6)
EquationEquation 6(6)
(6) differs from EquationEquation 5
(5)
(5) in that we now examine the resistance of sector i, measured in a similar way to EquationEquation 1
(1)
(1) , and we introduce the embeddedness of sector i (and its square term) (Equations Equation2
(2)
(2) and Equation3
(3)
(3) ) to compare the importance of regional versus sectoral embeddedness in the resistance of each sector.
Results
Descriptive Analysis
Mapping sales embeddedness across the 256 NUTS-2 regions for the beginning and end year of the study shows a stable evolution of the measure without sharp changes (). Many regions in Italy, southern Spain, Finland, but also several in Belgium and the Netherlands show comparatively low sales embeddedness between 0.1 and 0.4. In 2010, several regions in Germany, Hungary, the UK, and Ireland experienced a slight decline in sales embeddedness, but otherwise, the measure appears rather stable. Consequently, up until 2010, there is no evidence that the GR changed the export focus of EU producers with regard to the destination of their products. This is not unexpected given the nature of EU production (high value-added products aimed at advanced economies and nontradable services sold locally) and the global effect of the GR that has impacted all markets and created downward cost pressures. Simply put, EU producers did not identify new markets for their products as a response to the GR, and hence the relative share of local versus nonlocal sales remained unchanged.
Figure 2. Local embeddedness across NUTS-2 regions.
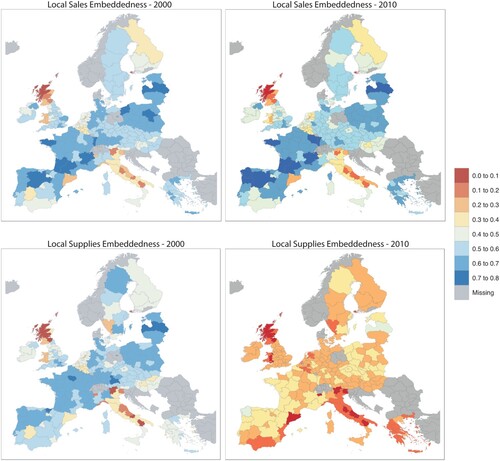
This is not the case for supplies embeddedness where a collapse is observed in the share of inputs sourced locally. In 2000, most regions (except for regions in Italy, Finland, Hungary, and Greece) had supplies embeddedness rates exceeding 0.5, while in 2010, a sharp decline meant most supplies embeddedness figures ranged between 0.2 and 0.4. In addition, regions with already low supplies embeddedness in 2000, have seen their rates drop closer to 0 in 2010. Examining further this substantial decrease in the size of supplies embeddedness, it is the result of a sharp drop in the share of local supplies from 2008 onward (). The timing of this drop suggests a significant shift in the origin of intermediate inputs related to the GR and the need to reduce input costs to remain competitive.
Figure 3. Scatter plots of embeddedness measures.
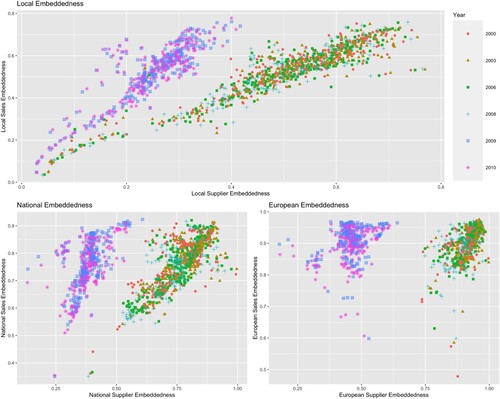
These dynamics are also consistent across larger spatial scales, namely, national and European embeddedness (instead of NUTS-2). This suggests that the share of inputs purchased locally not only decreased in regions but also in the sample countries and Europe as a whole. While the drop in supplier embeddedness ( and ) can be the outcome of different underlying dynamics, evidence suggests that some of this drop can be explained by shifting trading patterns. In particular, despite the overall decline in international trade due to the GR, it is suggested that offshoring has in fact, increased (Bems, Johnson, and Yi Citation2011; Los, Timmer, and de Vries Citation2015). Gereffi and Fernandez-Stark (Citation2010) examine the service industry and propose that the crisis caused a general contraction of demand as well as a substitution effect by which new services are offshored to developing economies in search of cost reduction. Kinkel (Citation2012) also argues that Asian countries gained attractiveness during the GR, as opposed to near-shore locations in Eastern Europe.
Overall, we find suggestive evidence that the demand-side effects of the GR, has pushed EU regional industrial systems to switch their suppliers from within to outside their own region (reducing supplies embeddedness) in the search for more cost-effective inputs. Simultaneously, the specialization of EU regions on exports to advanced economies and nontradable services, coupled with the systemic nature of the GR, meant that the recession did not shift the balance of sales between within and outside regions (keeping the sales embeddedness ratio stable).
Regression Results
Our regressions estimate the effect of embeddedness on regional resistance during the 2008 shock.Footnote10 Column (1) in shows the effect of local sales embeddedness on resistance during the period 2008–11. Sales embeddedness has a positive effect on resistance while the squared term is negative, indicating a curvilinear relationship between sales embeddedness and resistance to the GR. Overall, the results support H1a: local sales embeddedness has a positive effect on resistance to the 2008 crisis up to a level of embeddedness, after which the effect turns negative. The turning point lies at 56 percent,Footnote11 after which regions exhibit worse resistance outcomes. Column 2 tests H2b and the relationship between supplies embeddedness and resistance. Similar to sales embeddedness, the coefficients for supplies embeddedness and its squared term support H2b with the turning point lying at 64.5 percent.
Table 3 The Effect of Local Sales Embeddedness on Regional Resistance during 2008–11
shows the results of the quantile regressions and the different coefficients for sales (column 1) and supplies (column 2) embeddedness for each of the resistance quantiles. The two columns confirm the variation hypothesized in H2a and H2b with different patterns for sales and supplies embeddedness. Sales embeddedness is found to have significant and positive effects on the resistance of regions in the lower quantiles while it turns negative for the best performers (ninetieth percentile). On the other hand, supplies embeddedness shows significant and positive effects at either end of the resistance distribution with no statistically significant (albeit positive) coefficients for the middle of the regional resistance performance.
Table 4 The Effect of Local Sales Embeddedness on Regional Resistance during 2008–11 by Different Quantiles
Lastly, shows the results of our sectoral analysis (EquationEquation 6(6)
(6) ) testing the relationship between (sectoral and regional) sales (Panel A) and supplies (Panel B) embeddedness and sectoral resistance. The dependent variable in these regressions is the sectoral resistance in a region for Industry (S2); Construction (S3); Wholesale, Retail, Accommodation & Food Services, Information, and Communication (S4); Financial and Business Services, and Non-Market Services (S5). Interestingly, the results show considerable variation. The resistance of sector S2 (Industry) is heavily dependent on the sales and supplies embeddedness of the regional economy, while the resistance of S5 (Financial and Business Services, and Non-Market Services) is mainly influenced by regional sales embeddedness. The performance of S3 (Construction) is dependent on both sectoral sales embeddedness and the supplies embeddedness of the regional economy, while the resistance of S4 (Wholesale, Retail, Accommodation & Food Services, Information, and Communication) depends solely on the sectoral sales embeddedness in each region.
Table 5 Effect of Local Sales Embeddedness on Employment Growth by Sector
Discussion and Conclusions
Local industrial structure characteristics are central to the resilience of regional economies to shocks (Martin Citation2012; Balland, Rigby, and Boschma Citation2015; Martin et al. Citation2016; Fusillo, Consoli, and Quatraro Citation2022). In this article, we use the EUREGIO IO data set to calculate regional embeddedness measures, as the share of intermediate economic activity anchored to a region, taking into consideration the direction of links (forward versus backward linkages); the sectors involved; and the sector weights for each regional economy to better understand the nuances of embeddedness. We combine these measures with data from EUROSTAT and ARDECO to test a set of hypotheses using fixed-effects and quantile regressions. We add to the literature on industrial structures and resilience by providing new evidence on the evolution of sales and supplies embeddedness before and after the GR; the relationship between embeddedness and regional resistance; and, importantly, the nuances of this relationship that have significant policy implications.
First, we find that, facing the pressures of the 2008 GR, industries in EU regions focused on shifting the (local versus nonlocal) balance of their input markets rather than their product markets. Examining the measures of sales and supplies embeddedness, we find a sudden drop in 2008 for supplies embeddedness but not for sales embeddedness. This indicates that the ratio of local versus nonlocal sales remained stable during our study period, while the same ratio for supplies has changed toward larger shares of inputs from outside the region. Considering (1) the specialization of EU regions on high value-added manufacturing and (largely) nontradable services and (2) the demand-side effects of the 2008 GR that brought downward cost pressures, this adds to existing evidence (Gereffi and Fernandez-Stark Citation2010; Bems, Johnson, and Yi Citation2011; Kinkel Citation2012; Los, Timmer, and de Vries Citation2015) that during the 2008 crisis, the balance between local and nonlocal inputs has shifted to the latter.
Second, we find that when it comes to resistance to the 2008 crisis, sales and supplies embeddedness can influence the ability of a region to weather the storm of a crisis. In other words, local linkages to product (buyers) and input markets (suppliers) are useful during a recession perhaps due to knowledge flows and the reduction of transaction costs. This is in agreement and builds on previous single-country results (Kitsos, Carrascal-Incera, and Ortega-Argilés Citation2019). Sales and supplies embeddedness are positively associated with resistance up to a turning point, after which further increases of embeddedness impact negatively on regional resistance. For the average region, we calculate this turning point at 56 percent for sales embeddedness. On average, regions where more than 56 percent of their intermediate product sales come from within the region experience negative lock-in and/or propagation effects on their resistance to the GR. The respective figure for supplies embeddedness is 64.5 percent.
Third, using quantile regressions we find that the effects of embeddedness on regional resistance are heterogeneous. The evidence suggests that sales embeddedness has a positive effect on the resistance of regions that perform worse than average and a negative effect for the top 10 percent of regional resistance performers. On the other hand, increasing sales embeddedness has a positive effect on the resistance of the best and worst performing regions and limited influence on those regions in the middle of the resistance distribution.
Finally, focusing on sectoral resistance, we find that the impact of embeddedness on different sectors varies. Local sales embeddedness has a strong positive influence on manufacturing and financial services. This suggests that the resistance of these sectors depends on the linkages and knowledge flows at the regional rather than the sectoral level. Similarly, it is local rather than sectoral supplies embeddedness that boosts the resistance of manufacturing and construction. Sectoral embeddedness emerges as more important in the case of sales embeddedness for construction and S4 (wholesale, retail, accommodation, and IT) suggesting it is the sectoral linkages with customers that are a positive force in the sectors’ capacities to weather crises. We expect that one of the factors behind these results is the tradability of the sectors and their need for proximity and tight economic relations to their clients or suppliers. The resistance of predominantly tradable sectors, such as manufacturing, financial, and business services, is more reliant on the embeddedness of local economic systems while more nontradable, customer-oriented sectors, such as our S4, are more dependent on proximity to their clients and the embeddedness of the sector itself in its regional economy. The results of construction (positive effect of sectoral sales embeddedness and regional supplies embeddedness) attest to the singularity of the sector in its need to be embedded to its customer base and benefiting from being part of regional economies with strong backward linkages.
These findings have important policy implications. Generally, we are in agreement with the spirit of Soroka et al. (Citation2020) in that regions need to gain a better understanding of their local businesses and industries, their supply chains, embeddedness, and links to other sectors within and outside the region. In this article, we highlight the importance of this by showing that sales and supplies embeddedness are useful during crises but with a range of nuances. First, the curvilinear relationships suggest that there are levels of sales and supplies embeddedness after which the impact on resistance is negative. Second, our quantile regressions show that regions with relatively low resistance performance can benefit by improving both sales and supplies embeddedness, while regions with high resistance can benefit only from increasing their supplies embeddedness (up to 33 percent on average according to the coefficient in ). Finally, regions with large manufacturing, construction, or financial services sectors can increase their resistance by increasing regional sales embeddedness while, to protect wholesale, retail, and IT, regions should encourage greater sector-specific local linkages. Overall, the article highlights the need to gain data insights that will allow regions to devise policies (i.e., smart specialization strategies) to optimize the level of embeddedness for local industrial structures without risking the negative effects of lock-in.
The results and limitations of the study open interesting avenues for future research. First, updating EUREGIO with data post-2010 and, if possible, with greater sectoral disaggregation would allow us to examine the role of embeddedness on the recovery from the 2008 crisis having a more complete view of the links between embeddedness and regional resilience and better insights by sector.Footnote12 More recent data can shed light on the relationship between embeddedness and the COVID-19 economic crisis, where manufacturing sectors were significantly affected by disruptions in global supply chains, and social distancing measures constrained nonessential production of goods and services. In such a scenario, proximity between suppliers and buyers may also become an important advantage. Second, the definition and measurement of embeddedness accounts only for direct linkages, yet indirect linkages (measured by the Leontief inverse) may also play a role in creating the local synergies that enhance resilience. Finally, further study can focus on the causal mechanisms behind the differential relationship between sales and supplies embeddedness and resistance. This can take the form of case studies, looking into the sales and supplies embeddedness of key regional sectors and/or firms, and testing the different approaches to sales and supplies embeddedness as well as an instrumental variable approach.
Acknowledgements
Many thanks to Professors Jun Du and Tomasz Mickiewicz and the Paper Development Clinic of the Centre for Business Prosperity at Aston University, Professor Geoff Hewings, participants at YSI Plenary Urban and Regional Economics Working Group, Entrepreneurship and Regional Development Weekly seminar, and to Jim Murphy and three reviewers at Economic Geography. This article represents the views of the authors.
Notes
1 We discuss the conceptual and operational developments on resilience and its determinants in greater detail in “Theoretical Background.”
2 We understand regional embeddedness as the share of intermediate (business to business) economic activity taking place within a specific region and measure it in “Empirical Framework.”
3 Firms are later aggregated into sectors in IO databases depending on their primary activity.
4 See Appendix A, Table A1, in the online material for the sectors.
5 It is also the database used to feed the RHOMOLO (version 2) Spatial Computable General Equilibrium model from the Joint Research Centre of the European Commission.
6 For the regression analysis we can only consider 126 NUTS2 regions, as data availability for employment and the set of control variables is limited, especially before 2010. See Appendix A, Table A2 (in the online material) for a full list of the regions included in the regression analysis.
7 In the absence of a valid instrument and a causal research design, we discuss the relationships between embeddedness and resistance as associations rather than draw definitive conclusions on causality.
8 ARDECO is the Annual Regional Database of the European Commission’s Directorate General for Regional and Urban Policy. The database was developed by Cambridge Econometrics and is maintained by the Joint Research Centre. ARDECO can be accessed at https://knowledge4policy.ec.europa.eu/territorial/ardeco-database_en.
9 We provide descriptive statistics for the sectoral analysis variables in Appendix B (Tables B1 and B2 in the online material).
10 Full regression tables showing all the results are available in Appendix C (Tables C1 to C6 in the online material).
11 Turning points are calculated according to the quadratic formula , where the turning point occurs at
. In our case
refers to
and
to
.
12 The use of fourteen broad sectors is a trade-off dictated by the availability of data for the geography we study. Indeed, countrywide, and single country IO tables offer greater sectoral disaggregation but make large-scale, cross-country regional comparisons extremely difficult if not impossible. Given our measure of embeddedness is a regional aggregate figure, using weights for each sector’s size in each region and the fact that industrial classifications are hierarchical (detailed sectors are aggregated to broader classifications, i.e., four-digit sectors to three- and two-digit ones), we do not expect the lack of sectoral detail to affect our findings. The additionality of greater sectoral disaggregation would be that we would have more sectors to test H3a and H3b, and greater sectoral insights for the role of embeddedness on sectoral resistance.
References
- Acemoglu, D., Ozdaglar, A., and Tahbaz-Salehi, A. 2013. The network origins of large economic downturns. Working Paper 19230. Cambridge, MA: National Bureau of Economic Research.
- Andersson, M., Bjerke, L., and Karlsson, C. 2013. Import flows: Extraregional linkages stimulating renewal of regional sectors? Environment and Planning A: Economy and Space 45 (12): 2999–3017. doi: 10.1068/a45732.
- Bailey, D., Clark, J., Colombelli, A., Corradini, C., De Propris, L., Derudder, B., Fratesi, U., Fritsch, M., Harrison, J., and Hatfield, M. 2020. Regions in a time of pandemic. Regional Studies 54 (9): 1163–74. doi:10.1080/00343404.2020.1798611.
- Balland, P-A., Rigby, D., and Boschma, R. 2015. The technological resilience of US cities. Cambridge Journal of Regions, Economy and Society 8 (2): 167–84. doi: 10.1093/cjres/rsv007.
- Bathelt, H., and Cohendet, P. 2014. The creation of knowledge: Local building, global accessing and economic development—Toward an agenda. Journal of Economic Geography 14 (5): 869–82. doi: 10.1093/jeg/lbu027.
- Becattini, G., and Rullani, E. 1996. Local systems and global connections: The role of knowledge. In Local and regional response to global pressure: The case of Italy and its industrial districts, ed. F. Cossentino, F. Pyke, and W. Sengenberger, 159–74. Geneva, Switzerland: International Institute for Labour Studies.
- Behrens, K., Boualam, B., and Martin, J. 2019. Are clusters resilient? Evidence from Canadian textile industries. Journal of Economic Geography 20 (1): 1–36. doi: 10.1093/jeg/lby064.
- Bell, D. N., and Blanchflower, D. G. 2010. UK unemployment in the great recession. National Institute Economic Review 214 (1): R3–R25. doi:10.1177/0027950110389755.
- Bems, R., Johnson, R. C., and Yi, K-M. 2011. Vertical linkages and the collapse of global trade. American Economic Review 101 (3): 308–12. doi: 10.1257/aer.101.3.308.
- Billington, M. G., Karlsen, J., Mathisen, L., and Pettersen, I. B. 2017. Unfolding the relationship between resilient firms and the region. European Planning Studies 25 (3): 425–42. doi: 10.1080/09654313.2016.1276886.
- Boschma, R. 2015. Towards an evolutionary perspective on regional resilience. Regional Studies 49 (5): 733–51. doi:10.1080/00343404.2014.959481.
- Boschma, R., and Iammarino, S. 2009. Related variety, trade linkages, and regional growth in Italy. Economic Geography 85 (3): 289–311. doi: 10.1111/j.1944-8287.2009.01034.x.
- Buciuni, G., and Pisano, G. 2018. Knowledge integrators and the survival of manufacturing clusters. Journal of Economic Geography 18 (5): 1069–89. doi: 10.1093/jeg/lby035.
- Cainelli, G., Ganau, R., and Modica, M. 2019. Industrial relatedness and regional resilience in the European Union. Papers in Regional Science 98 (2): 755–78. doi: 10.1111/pirs.12377.
- Costa-i-Font, J., and Rodriguez-Oreggia, E. 2005. Is the impact of public investment neutral across the regional income distribution? Evidence from Mexico. Economic Geography 81 (3): 305–22. doi: 10.1111/j.1944-8287.2005.tb00272.x.
- Crespo-Cuaresma, J., Foster, N., and Stehrer, R. 2011. Determinants of regional economic growth by quantile. Regional Studies 45 (6): 809–26. doi: 10.1080/00343401003713456.
- de Jong, J. P. J., and von Hippel, E. 2009. Transfers of user process innovations to process equipment producers: A study of Dutch high-tech firms. Research Policy 38 (7): 1181–91. doi: 10.1016/j.respol.2009.04.005.
- Delgado, M., and Porter, M. E. 2021. Clusters and the great recession. Social Sciences Research Network. doi: 10.2139/ssrn.3829293.
- Delgado, M., Porter, M. E., and Stern, S. 2010. Clusters and entrepreneurship. Journal of Economic Geography 10 (4): 495–518. doi: 10.1093/jeg/lbq010.
- Di Caro, P. 2015. Recessions, recoveries and regional resilience: Evidence on Italy. Cambridge Journal of Regions, Economy and Society 8 (2): 273–91. doi: 10.1093/cjres/rsu029.
- Di Caro, P. 2017. Testing and explaining economic resilience with an application to Italian regions. Papers in Regional Science 96 (1): 93–113. doi: 10.1111/pirs.12168.
- Dietzenbacher, E. 2002. Interregional multipliers: Looking backward, looking forward. Regional Studies 36 (2): 125–36. doi:10.1080/00343400220121918.
- Diodato, D., and Weterings, A. B. R. 2015. The resilience of regional labour markets to economic shocks: Exploring the role of interactions among firms and workers. Journal of Economic Geography 15 (4): 723–42. doi: 10.1093/jeg/lbu030.
- Doran, J., and Fingleton, B. 2016. Employment resilience in Europe and the 2008 economic crisis: Insights from micro-level data. Regional Studies 50 (4): 644–56. doi: 10.1080/00343404.2015.1088642.
- Fingleton, B., Garretsen, H., and Martin, R. 2012. Recessionary shocks and regional employment: Evidence on the resilience of UK regions. Journal of Regional Science 52 (1): 109–33. doi:10.1111/j.1467-9787.2011.00755.x.
- Fingleton, B., and Palombi, S. 2013. Spatial panel data estimation, counterfactual predictions, and local economic resilience among British towns in the Victorian era. Regional Science and Urban Economics 43 (4): 649–60. doi: 10.1016/j.regsciurbeco.2013.04.005.
- Fusillo, F., Consoli, D., and Quatraro, F. 2022. Resilience, skill endowment, and diversity: Evidence from US metropolitan areas. Economic Geography 98 (2): 170–96. doi: 10.1080/00130095.2021.2008797.
- Gereffi, G., and Fernandez-Stark, K. A. 2010. The offshore services value chain: Developing countries and the crisis. Policy Research Working Paper WPS 5262. Washington, DC: World Bank. doi: 10.1596/1813-9450-5262.
- Giannakis, E., and Bruggeman, D. 2020. Regional disparities in economic resilience in the European Union across the urban–rural divide. Regional Studies 54 (9): 1200–13. doi: 10.1080/00343404.2019.1698720.
- Glaeser, E. L., and Kerr, W. R. 2009. Local industrial conditions and entrepreneurship: How much of the spatial distribution can we explain? Journal of Economics & Management Strategy 18 (3): 623–63. doi: 10.1111/j.1530-9134.2009.00225.x.
- Grabher, G. 1993. The embedded firm. London: Routledge.
- Gunderson, L. H., and Holling, C. S. 2002. Panarchy: Understanding transformations in human and natural systems. Washington, DC: Island Press.
- Han, Y., and Goetz, S. J. 2019. Predicting US county economic resilience from industry input-output accounts. Applied Economics 51 (19): 2019–28. doi: 10.1080/00036846.2018.1539806.
- Hill, E., Clair, T., Wial, H., Wolman, H., Atkins, P., Blumenthal, P., Ficenec, S., and Fiedhoff, A. 2010. Economic shocks and regional economic resilience. Paper presented at the Conference on Urban and Regional Policy and Its Effects: Building Resilient Regions, May 20–21, George Washington University, Washington DC.
- Isaksson, O. H. D., Simeth, M., and Seifert, R. W. 2016. Knowledge spillovers in the supply chain: Evidence from the high tech sectors. Research Policy 45 (3): 699–706. doi: 10.1016/j.respol.2015.12.007.
- Jovanovic, B. 1987. Micro shocks and aggregate risk. Quarterly Journal of Economics 102 (2): 395–409. doi: 10.2307/1885069.
- Kinkel, S. 2012. Trends in production relocation and backshoring activities: Changing patterns in the course of the global economic crisis. International Journal of Operations & Production Management 32 (6): 696–720. doi: 10.1108/01443571211230934.
- Kitsos, A. 2020. Economic resilience in Great Britain: An empirical analysis at the local authority district level. In Handbook on regional economic resilience, ed. G. Bristow and A. Healy, 190–208. Cheltenham, UK: Edward Elgar.
- Kitsos, A., and Bishop, P. 2018. Economic resilience in Great Britain: The crisis impact and its determining factors for local authority districts. Annals of Regional Science 60 (2): 329–47. doi: 10.1007/s00168-016-0797-y.
- Kitsos, A., Carrascal-Incera, A., and Ortega-Argilés, R. 2019. The role of embeddedness on regional economic resilience: Evidence from the UK. Sustainability 11 (14): 3800. doi:10.3390/su11143800.
- Koenker, R., and Bassett, G. 1978. Regression quantiles. Econometrica: Journal of the Econometric Society 46 (1): 33–50. doi:10.2307/1913643.
- Lee, N. 2014. Grim down South? The determinants of unemployment increases in British cities in the 2008–2009 recession. Regional Studies 48 (11): 1761–78. doi: 10.1080/00343404.2012.709609.
- Lengnick-Hall, C. A., and Beck, T. E. 2005. Adaptive fit versus robust transformation: How organizations respond to environmental change. Journal of Management 31 (5): 738–57. doi: 10.1177/0149206305279367.
- Los, B., Timmer, M. P., and de Vries, G. J. 2015. How global are global value chains? A new approach to measure international fragmentation. Journal of Regional Science 55 (1): 66–92. doi: 10.1111/jors.12121.
- Martin, R. 2012. Regional economic resilience, hysteresis and recessionary shocks. Journal of Economic Geography 12 (1): 1–32. doi: 10.1093/jeg/lbr019.
- Martin, R., and Gardiner,B. 2019. The resilience of cities to economic shocks: A tale of four recessions (and the challenge of Brexit). Papers in Regional Science 98 (4): 1801–32.
- Martin, R., and Sunley, P. 2014. On the notion of regional economic resilience: Conceptualization and explanation. Journal of Economic Geography 15 (1): 1–42. doi: 10.1093/jeg/lbu015.
- Martin, R., Sunley, P., Gardiner, B., and Tyler, P. 2016. How regions react to recessions: Resilience and the role of economic structure. Regional Studies 50 (4): 561–85. doi: 10.1080/00343404.2015.1136410.
- Maskell, P., and Malmberg, A. 2007. Myopia, knowledge development and cluster evolution. Journal of Economic Geography 7 (5): 603–18. doi: 10.1093/jeg/lbm020.
- McCann, P. 1995. Rethinking the economics of location and agglomeration. Urban Studies 32 (3): 563–77. doi: 10.1080/00420989550012979.
- Midmore, P., Munday, M., and Roberts, A. 2006. Assessing industry linkages using regional input–output tables. Regional Studies 40 (3): 329–43. doi:10.1080/00343400600631673.
- Neffke, F., Henning, M., and Boschma, R. 2011. How do regions diversify over time? Industry relatedness and the development of new growth paths in regions. Economic Geography 87 (3): 237–65. doi: 10.1111/j.1944-8287.2011.01121.x.
- Nyström, K. 2018. Regional resilience to displacements. Regional Studies 52 (1): 4–22. doi: 10.1080/00343404.2016.1262944.
- Okuyama, Y., Hewings, G. J., and Sonis, M. 2004. Measuring economic impacts of disasters: Interregional input-output analysis using sequential interindustry model. In Modeling spatial and economic impacts of disasters, ed. Y. Okuyama and S. E. Chang, 77–101. Berlin: Springer.
- Östh, J., Dolciotti, M., Reggiani, A., and Nijkamp, P. 2018. Social capital, resilience and accessibility in urban systems: A study on Sweden. Networks and Spatial Economics 18 (2): 313–36. doi: 10.1007/s11067-017-9375-9.
- Parr, J. B. 2002. Agglomeration economies: Ambiguities and confusions. Environment and Planning A: Economy and Space 34 (4): 717–31. doi: 10.1068/a34106.
- Parr, J. B., Hewings, G. J. D., Sohn, J., and Nazara, S. 2002. Agglomeration and trade: Some additional perspectives. Regional Studies 36 (6): 675–84. doi: 10.1080/00343400220146803.
- Pontarollo, N., and Serpieri, C. 2020. A composite policy tool to measure territorial resilience capacity. Socio-Economic Planning Sciences 70 (June): 100669. doi:10.1016/j.seps.2018.11.006.
- Rocchetta, S., and Mina, A. 2019. Technological coherence and the adaptive resilience of regional economies. Regional Studies 53 (10): 1421–34. doi: 10.1080/00343404.2019.1577552.
- Rodríguez-Pose, A. 2020. Institutions and the fortunes of territories. Regional Science Policy & Practice 12 (3): 371–86. doi: 10.1111/rsp3.12277.
- Sensier, M., Bristow, G., and Healy, A. 2016. Measuring regional economic resilience across Europe: Operationalizing a complex concept. Spatial Economic Analysis 11 (2): 128–51. doi: 10.1080/17421772.2016.1129435.
- Shutters, S. T., Muneepeerakul, R., and Lobo, J. 2015. Quantifying urban economic resilience through labour force interdependence. Palgrave Communications 1 (1): 1–7. doi:10.1057/palcomms.2015.10.
- Shutters, S. T., Seibert, H., Alm, B., and Waters, K. 2021. Industry interconnectedness and regional economic growth in Germany. IAB-Discussion Paper. Nuremburg, Germany: Institute for Employment Research of the Federal Employment Agency. https://doku.iab.de/discussionpapers/2021/dp0721.pdf.
- Soroka, A., Bristow, G., Naim, M., and Purvis, L. 2020. Measuring regional business resilience. Regional Studies 54 (6): 838–50. doi: 10.1080/00343404.2019.1652893.
- Thissen, M., Lankhuizen, M., van Oort, F., Los, B., and Diodato, D. 2018. EUREGIO: The construction of a global IO database with regional detail for Europe for 2000–2010. Tinbergen Institute Discussion Paper TI 2018-084/VI. Amsterdam, the Netherlands: Tinbergen Institute.
- Timmer, M. P., Dietzenbacher, E., Los, B., Stehrer, R., and De Vries, G. J. 2015. An illustrated user guide to the world input–output database: The case of global automotive production. Review of International Economics 23 (3): 575–605. doi:10.1111/roie.12178.
- Uzzi, B. 1997. Social structure and competition in interfirm networks: The paradox of embeddedness. Administrative Science Quarterly 42 (1): 35–67. doi: 10.2307/2393808.
- Völlers, P., Yavan, N., and Franz, M. 2021. The reaction of foreign firms to institutional changes: The case of German direct investment in Turkey. Applied Geography 134:102503. doi: 10.1016/j.apgeog.2021.102503.
- Webber, D. J., Healy, A., and Bristow, G. 2018. Regional growth paths and resilience: A European analysis. Economic Geography 94 (4): 355–75. doi: 10.1080/00130095.2017.1419057.
- Wolfe, D. A. 2010. The strategic management of core cities: Path dependence and economic adjustment in resilient regions. Cambridge Journal of Regions Economy and Society 3 (1): 139–52. doi: 10.1093/cjres/rsp032.
- Wrobel, M. 2015. ‘One for all and all for one’: Cluster, employment, and the global economic crisis. Evidence from the German mechanical engineering industry. Papers in Regional Science 94 (2): 273–94. doi: 10.1111/pirs.12065.
- Xiao, J., Boschma, R., and Andersson, M. 2017. Resilience in the European Union: The effect of the 2008 crisis on the ability of regions in Europe to develop new industrial specializations. Industrial and Corporate Change 27 (1): 15–47. doi: 10.1093/icc/dtx023.
- Xiao, J., Boschma, R., and Andersson, M. 2018. Industrial diversification in Europe: The differentiated role of relatedness. Economic Geography 94 (5): 514–49. doi: 10.1080/00130095.2018.1444989.