
Abstract
Usage-Based Insurances (UBI) enable policyholders to actively reduce the impact of vehicle insurance costs by adopting a safer and more eco-friendly driving style. UBI is especially relevant for younger drivers, who are a high-risk population. The effectiveness of UBI should be enhanced by providing in-car feedback optimised for individual drivers. Thirty young novice drivers were therefore invited to complete six experimental drives with an in-car interface that provided real-time information on rewards gained, their driving behaviour and the speed limit. Reward size was either displayed directly in euro, indirectly as a relatively large amount of credits, or as a percentage of the maximum available bonus. Also, interfaces were investigated that provided partial information to reduce the potential for driver distraction. Compared to a control no-UBI condition, behaviour improved similarly across interfaces, suggesting that interface personalisation after an initial familiarisation period could be feasible without compromising feedback effectiveness.
Practitioner Summary: User experiences and effects on driving behaviour of six in-car interfaces were compared. The interface provided information on driving behaviour and rewards in a UBI setting. Results suggest that some personalisation of interfaces may be an option after an initial familiarisation period as driving behaviour improved similarly across interfaces.
1. Introduction
Vehicle insurers traditionally determine what insurance premium to charge by assigning the insured vehicle and the driver to a set risk category, based on the characteristics and behaviours of aggregate groups. Depending on the jurisdiction, the assigning criteria may include the vehicle’s age and model along with the driver’s age, marital status, gender, place of residence, number of moving violations and self-reported annual mileage (see e.g. http://en.wikipedia.org/wiki/Vehicle_insurance). In contrast, a Usage-Based Insurance (UBI) or Pay-As-You-Drive insurance is based on a dynamic premium set via the in-car monitoring of driving behaviour. In this way, under a UBI, a driver’s premium is tailored to indications of risky behaviour at an individual level.
Many existing UBIs are purely mileage based. For instance, a customer may accept a general per-mile rate for driving that is set via a prepaid mile limit. Although publicly available investigations into the effects of UBIs are rare, it has been estimated that mileage-based insurance could lead to a reduction in mileage up to 8–10%, which could subsequently reduce the number of accidents by 12–18% due to the link between mileage and accident rate (Evans Citation2004; Bordoff and Noel Citation2008; Litman Citation2011). The positive effects of UBI could be further enhanced by linking insurance premiums to a wider range of driving behaviours than simply mileage, such as when, where and how a person drives. In this way, a driver could reduce the costs of vehicle insurance by adopting a safer and more eco-friendly – ‘smart’ – driving style (Adkins Citation2004; Litman Citation2005, 2011; Bordoff and Noel Citation2008; Bolderdijk et al. Citation2011; Lahrmann et al. Citation2012; Dijksterhuis et al. Citation2015).
For instance, in field trials by Lahrmann et al. (Citation2012) and Bolderdijk et al. (Citation2011) drivers reduced speeding behaviour substantially when being either penalised for speeding or rewarded for keeping within the speed limit. In a simulator study by Dijksterhuis et al. (Citation2015), rewards and penalties, based on driver behaviour, were combined and resulted in a reduction of the number of speeding events by over 90%. The same study also demonstrated the effectiveness of the implemented UBI system to encourage smooth driving, as time spent on harsh cornering, accelerating, braking and speeding were all reduced by over 50%. This is relevant because, in general, smooth driving can be taken as an indication of a safe driving style (Dingus et al. Citation2006; Af Wåhlberg Citation2008; Barkenbus Citation2010; Young, Birrell, and Stanton Citation2011; Simons-Morton et al. Citation2013; Dorn Citation2014).
Encouraging a smooth driving style may be especially important for young, novice drivers, who are over-represented in accident statistics; especially if male (OECD-ECMT Citation2006; Clarke et al. Citation2010; Lewis-Evans Citation2010). Young drivers tend to over-estimate their driving skills and tend to run more risks (OECD-ECMT Citation2006; Hatfield and Fernandes Citation2009). In addition to driving more at night, driving under the influence of alcohol, driving without a seatbelt and behaving more recklessly when driving with teenage passengers, young drivers show a greater tendency to speed (Williams Citation2003; Groeger Citation2006; Clarke et al. Citation2010; Lahrmann et al. Citation2012). Moreover, this group has been associated with larger longitudinal and lateral accelerations, and with maintaining shorter headways (Simons-Morton, Lerner, and Singer Citation2005; Dingus et al. Citation2006; Simons-Morton et al. Citation2011). A UBI, especially when coupled to an optimised in-car feedback strategy and interface design, may help to reduce driving behaviours that are associated with this high risk, young driver, population and this group will therefore be the focus of this study.
As mentioned above, a UBI is in essence a mechanism for delivering rewards and penalties. The behavioural effects of rewards and penalties may be mediated by many factors, such as the tendency to conform to authority, to conform to similar others, goal setting, loss aversion, or presenting benefits in reference to safety or environmental impacts (Kahneman and Tversky Citation1979; Cialdini Citation2001; Lehman and Geller Citation2005; Delhomme et al. Citation2010; Bolderdijk et al. Citation2013). However, according to the literature, the effectiveness of incentives depends on three main factors, namely the swiftness and certainty that a reward or penalty follows behaviours, and the size of the rewards or penalties (e.g. Skinner Citation1974; Abrahamse et al. Citation2005). Luckily, for the viability of UBI products, where monthly financial savings are likely to be relatively small, rewards size may be the least important factor (Skinner Citation1974; Bjørnskau and Elvik Citation1992; Zaal Citation1994). For example, in an online survey of over 200 Dutch non-UBI car insurance policyholders, it was indicated that a monthly reward of 10 euro or more would already make a UBI attractive (Lewis Evans et al. Citation2013A). In addition, UBIs, as they are based on driver monitoring, can deliver rewards and penalties immediately and with almost absolute certainty – suggesting that they could be quite effective.
However, the financial consequences of a UBI, and its link to driving behaviour, may not be immediately clear for a driver. Indeed, the most popular option for providing feedback is through a website, which is usually not visited frequently (e.g. Bolderdijk et al. Citation2011). A low website viewing frequency and the resultant delayed feedback also imply a low involvement with the product, as drivers may simply forget about it until they see the insurance bill several weeks later. As such, Dijksterhuis et al. (Citation2015) compared the provision of immediate feedback through an in-car interface to delayed feedback, of maximally one week, through a website interface which participants viewed at least once. In these conditions of feedback certainty, behavioural improvements of both groups as compared to a control group were similar, suggesting that the swiftness with which an in-car interface delivers feedback may not be strictly necessary for an effective UBI. Nevertheless, the positive changes were slightly more pronounced for the in-car feedback group. In addition, since in-car devices may be better suited to maximise feedback certainty compared to web-based feedback, these are worth considering for future use in UBI products.
The design of in-car information systems is a particularly important factor given its potential to distract and overload the driver and has been investigated in various research efforts aimed at optimising safe and eco-friendly driving behaviour for more than a decade (Jamson and Merat Citation2005; Horberry et al. Citation2006; Young, Birrell, and Stanton Citation2011; Rouzikhah, King, and Rakotonirainy Citation2013; Birrell, Fowkes, and Jennings Citation2014; Hibberd, Jamson, and Jamson Citation2015). The guiding principles include a good fit of the provided information, whether this is visual, auditory or haptic, with the driver’s mental model and actions (e.g. Stanton and Young Citation2005). An intuitive interface requires less resources to process, leading to less potential for conflict with primary task of safely controlling the vehicle (Jamson and Merat Citation2005). Similarly, simplicity is preferred over more complicated designs, also by drivers themselves (e.g. Fors, Kircher, and Ahlström Citation2015). In Dijksterhuis et al. (Citation2015), the design of the UBI visual interface was aimed at optimising clarity, ease-of-use and minimising the distraction of several interface elements, assessed through an online survey (n = 119; Lewis-Evans et al. Citation2013B). One of the aims of the current study was to investigate if further simplification of the in-car feedback is still effective in altering driving behaviour. Feedback elements from the interface, namely up-to-date monetary progress, behavioural information and the current speed limit, were therefore deleted or altered in various combinations from the base interface to form six different interfaces.
Money is a medium for acquiring desired outcomes (e.g. consumer products). Therefore, in addition to informing drivers directly about the financial consequences of their driving behaviour, other reward mediums could also be considered, such as providing points (see e.g. Lahrmann et al. Citation2012). The advantage of using a non-monetary medium is that its magnitude may be varied more freely, notwithstanding the consideration that reward size is considered less important than reward swiftness and certainty in the literature (e.g. Skinner Citation1974; Zaal Citation1994) which are already optimised when delivering immediate information through an in-car device. A large reward medium has been shown to affect an individual’s inference of the actual impact of the rewarded behaviour on the desired outcome. In other words, consumers overvalue the importance of a reward medium of high numerical value, and could therefore invest more effort into the pursuit of receiving it (Hsee et al. Citation2003; Van Osselaer, Alba, and Manchanda, 2004; Bagchi and Li Citation2011). Since large numbers are usually associated with other large outcomes, we hypothesise that substituting feedback on monetary rewards with a large number of points will enlarge UBI effects. Finally, since the difference between the current earnings and the (maximum) reward is an important piece of information in investigations into the effects of loyalty programmes (Bagchi and Li Citation2011), we looked into the effects of providing participants with a percentage of the maximum amount that they could earn during driving.
2. Method
2.1. Participants
A total of 33 participants were recruited through social media and poster announcements throughout the University of Groningen. Given the focus of this study on young and novice drivers, and to avoid including very inexperienced drivers, participants were required to be 18–25 years of age and to have held their driver’s licence from one to a maximum of five years. Upon examining driving experience, it turned out that three participants had reported unusual high total mileages of 50.000, 80.000 and 300.000 km, representing a distance to the group’s median mileage of more than twice the interquartile range. Since such high total mileages indicate experienced rather than novice drivers, these participants were not further analysed, leaving 30 participants (12 male) in the data pool. The average age of these 30 participants was 21.3 years (SD = 1.7), and they had held their driver’s licence for 2.8 years (SD = 1.1) on average. Fourteen participants reported driving less than 100 km per month and 12 participants reported driving around 100–300 km per month. The remaining four participants reported a monthly mileage between 500 and 900 km. The median reported total mileage across the group was 4000 km (IQR = 9500).
2.2. Procedure and instructions
Upon arrival at the experimental site at the University of Groningen, a participant was informed in general terms of the experimental design, asked to sign an informed consent, and to fill in a survey that collected basic demographic data. In addition, participants were informed in full detail of the monetary rewards system and told that they would receive €10 plus €3 depending on how they drove, with a maximum of €0.50 being available per experimental drive. The participants then completed eight relatively short, identical, drives, all within one experimental session. In this session participants completed a practice drive, drove with each of six different user interfaces (UIs), and drove with an empty control interface. During the first practice drive, the participants were given the opportunity to get used to the simulator and to get used to receiving in-car information via the UBI system, but did not yet receive rewards for complying with the set UBI driving thresholds (UI type A; see Figure (A)). The order of the remaining seven drives was balanced across participants according to a randomised Latin square. During the practice drive and the control drive, participants were informed that their driving behaviour would not be linked to rewards and penalties. After each drive, participants were requested to rate several items with respect to the drive and the interface they were exposed to during that drive. Once the participants had finished all the drives, they were asked to fill out a final brief questionnaire in reference to their preferences, in terms of the different interfaces, before being fully debriefed and receiving the full €13 despite being told that they would have to earn the extra three euro. The experimental session lasted for about 90 min. Ethics approval to conduct the experiment was granted by the University of Groningen Psychology Ethics Committee.
Before each drive participants were instructed to drive as they would drive in their own vehicle and were reminded of the UBI system and the driving behaviours linked to this system. In addition, the particular UI version for each drive was explained to them. One way for participants to earn the maximum monetary reward would be to drive very slowly, since the reward increased with each second of smooth driving. Therefore, some time pressure was applied by asking the participants to complete each drive within 6 min, although participants were not informed whether or not they had actually completed the drive within this period of time at any point, nor was a timer visible to the participants within in the simulator.
2.3. Material
2.3.1. The driving simulator
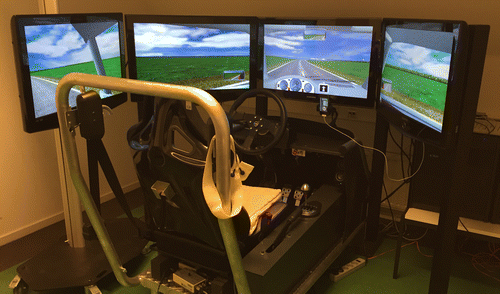
The experiment was completed with the University of Groningen STSoftware© driving simulator, which consists of a fixed-base car mock-up with functional steering wheel, indicators and pedals. The road environment and traffic were displayed on three 32-inch screens, which provide a viewing angle of 210° in total. In addition, an extra screen mounted to the side provided the participants with an extra 70° and allowed them to shoulder check the blind spot on the left side of the car (See Figure ).
Figure 1. The Groningen driving simulator, with the UBI device (the iPod) mounted on the simulator frame.
During each of the eight simulated drives, the participants drove through the same village, which took around 7.6 min to complete on average. During each of these identical drives, the participant interacted with other traffic and navigated ten intersections. Intersections could either be with or without intersecting traffic, with or without right of way as indicated by traffic signs and road markings, or with or without traffic lights. Traffic at the fifth encountered intersection was specifically programmed to result in a gap-acceptance task, as participants had to navigate through a stream of vehicles intersecting from both directions (see e.g. Brookhuis, de Waard, and Samyn Citation2004). The intersecting traffic started with a gap time of one second that then increased by one second with every gap. The accepted gap time and the distance to the approaching cars during that accepted gap was recorded automatically by the simulator. Other traffic consisted of a stream of medium density oncoming traffic and a car that followed the participant’s vehicle during most of the drive, in order to create some feeling of pressure. The task of navigating the route was simple and identical for each drive. Participants drove straight on during most of the drive, and route instructions were verbally given once per drive (i.e. ‘Turn Right’) via a small navigation device located on top of the virtual dashboard (see Figure ).
2.3.2. Rewards, penalties and thresholds
The UBI system ran in a Node.js Server-Side JavaScript environment on the simulator computer. During the drives, participants could earn extra money or lose it again, based on their driving behaviour. Participants were rewarded with €0.0015 per second if they drove smoothly and stayed within the speed limit. However, passing thresholds for unsafe driving for at least 0.5 s resulted in a penalty of €0.03 per second. When the participant’s vehicle was not in motion, rewards or penalties were not administered by the UBI system. Four behavioural thresholds for unsafe driving were defined. To start with, speeding was defined as driving at least 5 km/h faster than the current speed limit. Next, harsh cornering and harsh braking were defined as a lateral acceleration or deceleration of over 3.0 m/s2. This threshold of 3.0 m/s2 was taken from the 2.5 m/s2 limit used by Ullberg (Citation2009) and then adjusted so it felt appropriate for car modelled by the driving simulator (see e.g. Bonsall, Liu, and Young (Citation2005) for other threshold value suggestions). While this does mean that the 3.0 m/s2 limit is somewhat subjective and specific to the driving simulator software used, it is also a somewhat conservative limit with other research suggesting that around 1.5 m/s2 acceleration or deceleration corresponds to smooth driving (Bonsall, Liu, and Young Citation2005). In addition, the baseline threshold for harsh accelerations was decreased with a factor of 0.0112 at speeds below 60 km/h and decreased with an additional factor of 0.0112 for speeds above 60 km/h, based on an investigation on a similar system for trucks by Ullberg (Citation2009; see also Dijksterhuis et al. Citation2014, 2015).
2.3.3. Feedback delivery
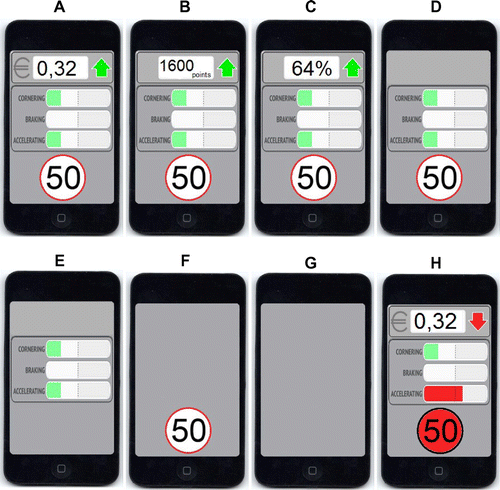
Real-time behavioural and monetary feedback was provided through one of six versions of a UI. The UI ran a HTML5 web platform communicating with the control software over web sockets and was presented to the participants on a dash mounted 5th-generation iPod touch via a ‘Kiosk Pro Lite’ application (see Figure ). In addition, at the end of each of the six experimental drives, a summary of received rewards, penalties and related driving behaviours was displayed on the same device.
All versions of the UBI interface are shown in Figure . To start with, UI A is identical to the interface as used for a previous study (Dijksterhuis et al. Citation2015). The top pane of UI A shows the continuously updating total amount of earned money and a green/red arrow pointing up/down indicating if money is currently being earned/lost. The middle pane provides real-time feedback on cornering (lateral acceleration in either direction), braking and acceleration behaviour. In addition, a vertical dashed line in each bar indicates the threshold value of that particular behaviour and the bar changes colour from green to red when this value is exceeded. In the bottom pane, the current speed limit was shown which flashed red in case the speed limit was broken, acting as an intelligent speed advisor. On UI B, instead of the total amount of earned money, a large number of points were shown, using a simple multiplication factor of 5000. For UI C, a percentage of the maximum amount (which was €0.50 per drive) was shown in the top pane. Next, the upper pane of UI D was blocked from view. On interface E, both the upper and lower pane was blocked from view, leaving only the three bars indicating current driving behaviour values in view. UI F only showed the speed advisor and UI G represented the control interface when participants received no feedback, nor could they earn or lose rewards. Finally, UI H in Figure illustrates the UI elements in penalty mode, when two thresholds are passed simultaneously (speeding and rapid acceleration). Multiple thresholds being crossed still resulted in the normal rate of decrease (€0.03 per second).
Figure 2. Illustrations of all interface types in ‘reward’ mode (A–F), the control interface (G) and an example of the interface’s ‘penalty’ mode (H). (A–E, H) All text on the interfaces were translated from Dutch for the readers’ convenience.
2.3.4. Questionnaires
The questionnaire (in Dutch) used for the experiment was carried out online via an ASUS Transformer Pad TF300T tablet running the Android operating system, version 4.1.1. The questionnaire contained the instructions about the experiment, explained the monetary and behavioural details of the UBI system emphasising that smooth driving behaviour was important (i.e. which behaviours it was linked to, and how much reward or penalty per second it could result in), and basic demographic questions about the participant’s age and driving experience. The questionnaire then further introduced the idea of UBI and asked participants if they would be interested in setting their insurance premium based on driving data collected by a UBI system (exactly half of the participants answered that they were indeed interested).
After each drive, except for the practice drive, participants were asked to rate the difficulty risk, and level of distraction experienced on a scale running from one to seven, where one indicated the complete absence of experienced distraction/risk/difficulty and seven indicated extreme levels. In addition, for all six experimental interface types, ratings of perceived clarity, ease of use, accurateness and distraction were requested on the same one to seven point scale. Finally, after experiencing all of the interfaces, participants’ personal preferences were further probed by providing them with a ‘forced choice’ question where they were asked to pick what they considered to be the best (or least-worst) and the worst interface (or least-best). The terms worst and best were not further defined to the participants.
2.4. Data sampling and analysis
Three data sources may be discerned. Firstly, subjective measures: ratings for the UIs and the drives in general, and the outcome of the forced choice question. As mentioned above, these were acquired after each drive and after completing all drivers. Secondly, parameters that were directly related to the UBI system were sampled at a rate of 10 Hz: accelerating, braking, cornering and speeding behaviour in addition to the monetary performance that resulted from these behavioural measures. To account for differences in the time it took participants to complete a particular drive, the monetary results per minute were analysed, rather than the total amount of earned money. Furthermore, for these UBI parameters, the percentage of the total driving time that participants spent exceeding the threshold values was analysed. Finally, the effects on driving behaviours that were not directly related to the UBI rewards were also analysed, namely, the average total driving speed, the standard deviation of the driving speed (with speed being sampled at a rate of 10 Hz by the simulator) and the accepted gap time when navigating the fifth intersection on route.
To test differences in the number of most liked and the most disliked interfaces, chi-square tests were used. Next, before testing differences between the various interface conditions, the distribution for each dependent variable in each of the seven UI conditions was visually inspected and further checked through the Shapiro–Wilk test for normality. Since significant deviations from normality were found in most conditions for subjective ratings, UBI-related parameters, and accepted gap time, the non-parametric Friedman test was employed for these variables. However, for mean driving speed and the mean of the standard deviation of driving speed, the number of normality deviations was limited to one and two respectively, and therefore, parametric repeated measures MANOVA’s were employed to test these driving behaviours.
If appropriate, differences in outcome variables were further investigated using pairwise comparisons. In case of the nonparametric variables, a Wilcoxon Signed Ranks Test was used to compare each UI pair. Similarly, mean differences (t-tests) were tested in case of parametric variables. To compensate for familywise error rate, the p-values of all pairwise comparisons were corrected according to the Bonferonni method by multiplying it with the number of pairs. In this way, alpha could be set to 5% for all tests, which were carried out using IBM SPSS Statistics 22.
3. Results
3.1. Subjective measures
To start with, Figure shows all mean subjective ratings as acquired directly after each drive. As can be seen on the left-hand side of Figure , both perceived driving difficulty and risk were low for all interfaces (median ratings of 1 or 2) and did not differ much between interface types (see Table for the statistical results and Figure for an illustration of all the interfaces). Ratings of ease of use and perceived accuracy were also similar across interfaces, mostly relatively high, and did not significantly differ between drives. However, tests for the other ratings did reveal some differences.
Figure 3. Median ratings for all questions and interface types. Interface type (A, B, C, D, E, F and G) correspond to Figure .
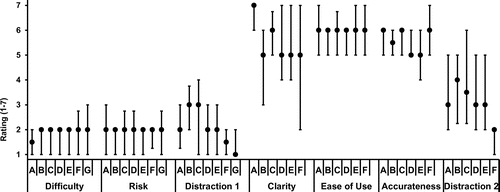
Table 1. Friedman test results and pairwise Wilcoxon Signed Ranks tests comparisons (Figure ). Only if Friedman’s test yielded a significant result were pairwise comparisons performed, and only significant pairwise test results are shown in the bottom of the table. UI = User interface type (A–G correspond to Figure ), G = the control (empty) interface.
Firstly, even though the mean ratings on perceived distraction were relatively low (see Figure ; also for definitions of the rating items), post hoc analyses revealed several differences, mainly pointing to the fact that the control drive (UI G), during which an empty interface was shown, was perceived as less distracting than most other drives (a median rating of 1 vs. a median rating of 2 or 3 for the UI A, B, C and D; see Table ). Secondly, driving with UI F, which only contained the maximum speed limit, was rated as less distracting than all the other UIs (a median rating of 2 vs. a median rating between 3 and 4 for the other UIs).
Finally, UI type affected clarity ratings, even if all median scores were in the high to very high range, between 5 and 7. Post hoc analyses confirm that UI A was perceived as clearer (median of 7, which was the maximum score) than all other interfaces (see Table ). Also, the percentage-based UI (C) was rated as clearer than the credit/points-based UI (C).
Upon completing all drives, participants were asked to pick the best and worst interface after the experiment (‘forced choice’, see Section 2.3.4) and differences were found for both (best design: χ2(5) = 15.18, p = .010; worst design: χ2(5) = 23.21, p < .001). Zooming in on those differences, interface type F was clearly most often picked as the worst by the participants (45%). Votes for the best design were distributed across more interfaces, as interface type A, C and D, were all picked relatively often (27, 18 and 27%).
3.2. Objective measures
Performance in terms of monetary rewards and losses and the underlying driving behaviours are shown in Figure . To start with, a main effect of interface type on earnings was found (Figure (A) and Table ). This was mainly caused by the relatively low median net earnings during the control drive (€0.045/min), while the net earnings as a result of driving with any of the experimental interface types (A–F) were more similar, ranging between €0.059 and €0.061 per min.
Figure 4. Median monetary earnings and the underlying monitored driving behaviours. (A) Median net monetary earnings per minute, gains minus losses. (B) The median percentage of time that each of the driving behaviour criteria were passed. (A–B) Interface type (A–G) correspond to Figure .
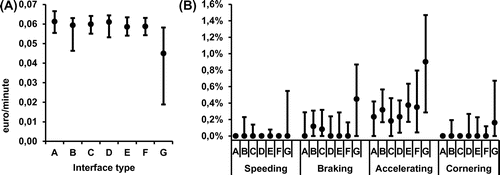
Table 2. Friedman test results and pairwise Wilcoxon Signed Ranks tests comparisons (Figure ). Only if Friedman’s test yielded a significant result were pairwise comparisons performed, and only significant pairwise test results are shown in the bottom of the table. UI = User interface type (A–G correspond to Figure ), G = the control (empty) interface.
Directly reflecting the monetary earnings are the percentages of time that any of the penalty criteria were exceeded (Figure (B)). As can be seen in Figure (B), the largest contributor to monetary losses for UI types A–F was harsh acceleration behaviour, as the median percentage of the time that drivers exhibited this behaviour ranged from 0.18% for UI C to 0.90% for UI G. In contrast, median values for penalised cornering and speeding behaviour were 0.0% for most conditions. Only when driving with the empty control UI (G) did the median of the time spent on harsh cornering increase to 0.16%. Moving on to harsh braking behaviour, which varied between 0.0 and 0.45%, it is again clear that the main effect is largely caused by the high median percentage in during the control ride, as all significant pairwise comparisons involved UI G.
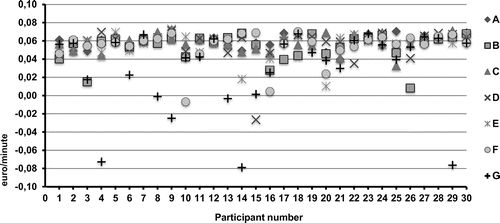
Inter-individual differences are explored in Figure , showing that there were a total of eight drives during which participants were losing money, out of a total of 7 × 30 = 210 drives (about 4% of all drives). Six of these were in the control condition (UI G). It also shows that for the majority of participants (approx. 21), monetary earnings while driving with interface type G were in a similar range as the other drives, indicating that a small subgroup was in fact responsible for the low monetary score as show in Figure (A).
Figure 5. Net monetary earnings per participant and interface type (A–G).
Next, when driving with interfaces A–F, participants drove, on an average, at a speed of about 38.4 km/h which increased to 40.8 km/h on average during the control condition (Figure (A) and Table ). Consequently, pairwise comparisons only revealed differences with the control interface (UI G). The standard deviation of driving speed (Figure (B)) shows a somewhat different pattern as driving with the UI that only showed the maximum speed limit (type F), lead to somewhat less variation in driving speed as compared to the empty control interface (UI G; 15.21 km/h). Also, the differences between UIs in median accepted gap times (Figure (C)), which varied between 6.5 and 8.0 s, turned out to be significant. Pairwise comparisons however did not reveal specific differences, although the largest contributors to the main effect were the relatively low median gap time (6.0 s) when driving with UI E (which only showed driving behaviour) and the high median gap time (8.0 s) when driving with UI F (which only showed the current speed limit) (Table ).
Figure 6. Mean driving speed (A), mean standard deviation of driving speed (B) and the median accepted gap time (C). In (A, B) the whiskers represent standard error. In (C) the whiskers represent the interquartile range.
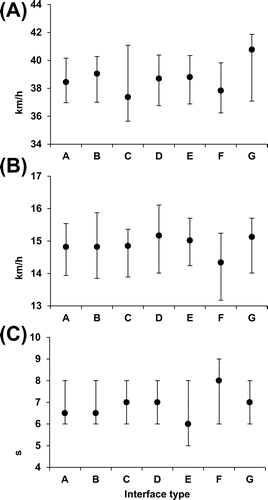
Table 3. Test results for mean driving speed, standard deviation of the driving speed and accepted gap time (Figure ). For the speed variables, repeated measures MANOVA’s were employed, for accepted gap time the Friedman test was employed. Only if the main test yielded a significant result were pairwise comparisons performed, and only significant pairwise test results are shown in the bottom of the table. ηp2 (partial eta-squared) represents the effect size. Interface type (A–G correspond to Figure ), UI G is the control, empty interface.
4. General discussion
A Pay-As-You-Drive or UBI premium is determined by the driving behaviour of the individual policyholder. Several studies have suggested that UBIs may have substantial economic, environmental and safety benefits for both the individual driver and for society at large (Adkins Citation2004; Litman Citation2005, 2011; Bordoff and Noel Citation2008; Bolderdijk et al. Citation2011; Lahrmann et al. Citation2012; Dijksterhuis et al. Citation2015). The effectiveness of a UBI may be affected by the way that feedback on driving behaviour and monetary rewards is delivered to the driver. A previous study by the authors demonstrated that a continuously updating in-vehicle interface is a good way of making sure that drivers see and use this feedback immediately (Dijksterhuis et al. Citation2015). However, in-car information provision may potentially lead to driver distraction (Jamson and Merat Citation2005; Horberry et al. Citation2006). The current study therefore expanded on the previous study by exploring if the original interface could be simplified. In addition, a UBI system may capitalise on medium maximisation, suggesting that people may be affected by the substitution of relatively small amounts of monetary reward with a larger amount of points (Hsee et al. Citation2003; van Osselaer, Alba, and Manchanda Citation2004). Finally, UBI effectiveness may be enhanced by showing drivers the distance to the maximum available reward (Bagchi and Li Citation2011).
To begin with, participants earned more money, mainly as a result of displaying less longitudinal and lateral accelerations when driving under UBI conditions as compared to the control condition. In addition, average driving speed was reduced under UBI conditions. These behavioural data confirm other research suggesting that an in-car UBI interface may positively influence driving behaviour (Adkins Citation2004; Litman Citation2005, 2011; Bordoff and Noel Citation2008; Bolderdijk et al. Citation2011; Lahrmann et al. Citation2012; Dijksterhuis et al. Citation2015). To put it differently, since most participants had already experienced driving with one or more interfaces when the control condition occurred, this observation may also be taken as an indication that changes in driving behaviour are partly reversed when the UBI system is removed. This reversal is in line with both our previous study (Dijksterhuis et al. Citation2015) and field investigations during which participants were exposed to a UBI for several months (Bolderdijk et al. Citation2011; Lahrmann et al. Citation2012).
Taken together, this suggests that the potential of UBIs for permanently changing driving behaviours may be relatively low, unless shown to the driver frequently. One way of achieving this is through in-car feedback. However, maximising feedback certainty outside the car can already be effective, indicating that continuous feedback may not be necessary (Dijksterhuis et al. Citation2015). In addition, effective UBI implementation in terms of shaping safer driving habits, may require a broader multidimensional approach, including interventions aimed at changing driving attitudes, e.g. through social marketing and training, similar to what is suggested in eco-driving literature (Barkenbus Citation2010; Harvey, Thorpe, and Fairchild Citation2013; Lauper et al. Citation2015).
When looking at specific changes of driving behaviours as a result of driving with UBI, it turned out that the time that participants exhibited harsh braking was reduced most notably (about 93% as compared to the control drive). Also, harsh accelerating behaviour occurred less (about 69%). Cornering behaviour, while pairwise comparisons did not reveal a difference with the control condition, hardly occurred at all during the UBI drives. This pattern of sizable changes is roughly comparable to Dijksterhuis et al. (Citation2015). However, in the previous study, speeding behaviour was the largest contributor to monetary losses, while in the current study, this behaviour was hardly shown at all by the majority of the participants. This difference in results can be explained by the longer route used in the previous study, which included rural and highway driving conditions. Especially when driving on the highway, participants seemed more inclined to set a fixed speed, occasionally above the speed limit, for relatively long periods of time during the control drives. Since the UBI system in both studies was time based, this lead to larger penalties in the previous study.
Interestingly, a large part of the UBI effects was caused by a relatively small number of participants. As it turned out, about two-thirds of the participants did not show a decrease in monetary rewards during the control drive. On the one hand, this could suggest that the positive influence of driving with a UBI system was transferred to ‘without-UBI’ driving. On the other hand, it could indicate that the personal driving style of most participants is already largely corresponding with the UBI system. Put differently, a UBI may especially affect a relatively small subset of drivers whose normal driving style fall outside the bandwidth of safe driving behaviour as established by a UBI system. This is an interesting finding and more elaborate investigations aimed at identifying individuals for whom a UBI is likely to have a large impact could help to further optimise design and effectiveness.
Differences between the interfaces, in terms of driving behaviour, were limited to UI F (which only showed the speed limit and is discussed later) and could be an indication that participants were not really affected by the substitution of feedback on monetary rewards with a percentage of the maximum, or with a relatively large amount of points. This could imply that the conversion factor as used for the current study, was not high enough. On the other hand, it may simply imply that participants were aware of the conversion factor, since they drove with all six interfaces in a relatively short time. The link between an indirect medium such as points and a more direct medium such as money is usually not as clear for participants in the literature on medium maximisation (Hsee et al. Citation2003; van Osselaer, Alba, and Manchanda Citation2004; Bagchi and Li Citation2011). Speculatively, since individuals may be more averse to losing what they already have than to not attaining a reward, framing the reward system somewhat differently may have yielded larger effects (Kahneman and Tversky Citation1979). For example, by giving drivers the highest score to begin with and then subtracting points in case of deviant behaviour. On the other hand, since the current set-up entailed both gaining points and the risk of losing them again, loss aversion may have already been a salient factor while driving with the UBI system. It would however be a very interesting topic for future research.
Omitting information elements from the UI did not have a substantial impact on monetary performance and the underlying driving behaviours, except when driving with the UI that functioned as an intelligent speed advisor. As it turned out, the standard deviation of driving speed decreased and accepted gap time increased somewhat when driving with this interface, indicating a safer driving style, perhaps as a result of a stronger focus on monitoring driving speed. Maintaining the general positive effect of driving with UBI also implies that the information flow from the original interface could be simplified into just an intelligent speed advisor without negative consequences for improving behaviour. That is, a simplified interface may act as a reminder that a UBI system is active, once drivers have also practised with the full system, as was the case during this experiment. It also indicates that high awareness of the connection between driving behaviours and the reward system is a necessary condition of a UBI’s effectiveness. For future studies, it would be worthwhile to further investigate ways of simplifying feedback while maintaining high awareness of the system. For example, whether a simple reminder of UBI while driving, combined with more detailed feedback just prior or after a drive could be just as effective as a richer, constant, flow of information.
The experiences of driving with the various interface types indicate that driving with the majority of interfaces was perceived as more distracting than driving with the empty interface. It should be noted that these drives were still not rated as very distracting, with ratings averaging between 1.8 and 2.8 on a seven point scale. Given that a rating of one was ‘not distracting at all’ these ratings are not particularly high. While the difference may have been significant, it unsurprisingly indicates that the presence of any feedback is more distracting than no feedback at all. Of course, while subjective ratings of interfaces provide a starting point for assessing the potential for driver distraction, people generally tend to underestimate how distracted they are, and therefore, other proxies of driver distractions, such as glance time off road should be considered for future research (Sodhi, Reimer, and Llamazares Citation2002; Victor, Harbluk, and Engström Citation2005).
Having said that, the interface that only showed the intelligent speed advisor was rated as the least distracting, which is in line with the general ergonomics rule that providing less information is usually better. Other subjective measures tended to be less favourable for this interface, e.g. it was selected most often as the worst interface design. Perhaps, this can be explained by the relatively large discrepancy between the provided information and the actual rewarded behaviours, and indicates that not providing all performance indicators was not the preferred design from the user’s point of view. Then again, driving with this interface had a somewhat larger safety effect on driving behaviour than the other interfaces, as drivers picked larger gaps between cars before intersecting a stream of cars and longitudinal driving behaviour was somewhat smoother. In short, the various subjective and objective effects of the intelligent speed advisor are somewhat contrasting.
Preferences for ‘best design’ were more distributed across interface designs, although the interface that only showed feedback on acceleration behaviour was favoured the least and the original full interface was favoured the most. The original interface, displaying all information elements, was also rated to be clearer than all other interfaces. This may be contributed to a training effect, since participants practised with this interface, which is a possibility that cannot be ruled out given the experimental design. In general, however, ratings tended to be favourable across interfaces, as perceived driving difficulty and risk was usually low and ratings of accurateness and ease of use high. Taken together, the subjective data seem to imply that, while the original interface is preferred in terms of clarity and the speed advisor interface is preferred in terms of being perceived as least distracting, the offering of some degree of personalisation of in-car interfaces to drivers under UBI schemes may be feasible.
The limitation of exposing participants to several interfaces in close temporal proximity was already discussed above in terms of potential carry-over effects and emphasise the need to assess generalisability and sustainability of behavioural effects of driving with a UBI system in real-world conditions. The relatively small sample size should also be acknowledged, as should the relatively short driving times. It may have been that over longer driving times and with more participants, different results may or may not have been obtained. Another potential limitation of the current experiment is that the amount of money that participants could earn per second (€0.0015) is rather large compared to what can be expected in real UBI. However, given that the total amount of money that could be earned was relatively small, this may not be an issue. Finally, unlike with a real UBI, participants of the experiment never had to pay any costs, which is a necessary restriction due to ethical concerns for most experimental research, and emphasises the need to study effects of a UBI system with real insurance products.
4.1. Conclusion
The results presented in this paper confirm the general potential of UBIs for stimulating driving behaviour that is rewarded by an in-car feedback system, although the set-up of the experiment somewhat hinders drawing clear conclusions on behavioural differences between interfaces. Nonetheless, simplifying behavioural and monetary feedback did not lead to less safe driving behaviour and usability ratings on most interfaces were favourable and comparable. The experimental set-up ensured that drivers were aware of the complete reward system all the time, also when part of the information was hidden. Since behavioural differences between interfaces were small, although slightly favouring the UI that only showed the current speed limit, in these conditions of consequence awareness, the results of this study can be seen as an indication that personalisation to some extent of the interface’s design may be an option, assuming that drivers are first familiarised with the full system.
Funding
This work was supported by the Dutch Ministry of Infrastructure and Environment in consultation with Univé insurance.
Acknowledgements
The authors of this paper would like to acknowledge the invaluable work of Jeroen Meijer and Peter van Wolffelaar who were instrumental in the creation of the in-car and web-based feedback system used in this experiment. Also, the reviewers are thanked for their helpful suggestions during the publication process.
Disclosure statement
No potential conflict of interest was reported by the authors.
References
- Abrahamse, W., L. Steg, C. Vlek, and T. Rothengatter. 2005. “A Review of Intervention Studies Aimed at Household Energy Conservation.” Journal of Environmental Psychology 25 (3): 273–291.10.1016/j.jenvp.2005.08.002
- Adkins, K. T. 2004. Two Essays in Applied Economics: Pay-as-You-Go Auto Insurance and Privatized Military Housing. Monterey, CA: Naval Postgraduate School.
- Af Wåhlberg, A. E. 2008. “Driver Celeration Behaviour and Accidents – An Analysis.” Theoretical Issues in Ergonomics Science 9 (5): 383–403.10.1080/14639220701596722
- Bagchi, R., and X. Li. 2011. “Illusionary Progress in Loyalty Programs: Magnitudes, Reward Distances, and Step-size Ambiguity.” Journal of Consumer Research 37 (5): 888–901.10.1086/656392
- Barkenbus, J. N. 2010. “Eco-driving: An Overlooked Climate Change Initiative.” Energy Policy 38 (2): 762–769.10.1016/j.enpol.2009.10.021
- Birrell, S., M. Fowkes, and P. Jennings. 2014. “Effect of Using an in-vehicle Smart Driving Aid on Real-world Driver Performance.” IEEE Transactions on Intelligent Transportation Systems 15 (4): 1801–1810.10.1109/TITS.2014.2328357
- Bjørnskau, T., and R. Elvik. 1992. “Can Road Traffic Law Enforcement Permanently Reduce the Number of Accidents?” Accident Analysis and Prevention 24 (5): 507–520.10.1016/0001-4575(92)90059-R
- Bolderdijk, J., J. Knockaert, E. M. Steg, and E. T. Verhoef. 2011. “Effects of Pay-as-You-Drive Vehicle Insurance on Young Drivers’ Speed Choice: Results of a Dutch Field Experiment.” Accident Analysis and Prevention 43 (3): 1181–1186.10.1016/j.aap.2010.12.032
- Bolderdijk, J. W., L. Steg, E. S. Geller, P. K. Lehman, and T. Postmes. 2013. “Comparing the Effectiveness of Monetary versus Moral Motives in Environmental Campaigning.” Nature Climate Change 3 (4): 413–416.
- Bonsall, P., R. Liu, and W. Young. 2005. “Modelling Safety-related Driving Behaviour—Impact of Parameter Values.” Transportation Research Part a: Policy and Practice 39 (5): 425–444.10.1016/j.tra.2005.02.002
- Bordoff, J., and P. Noel. 2008. Pay-as-You-Drive Auto Insurance: A Simple Way to Reduce Driving-Related Harms and Increase Equity. Hamilton Project Discussion Paper. 2008–09 The Hamilton Project, The Brookings Institution (2008). Retrieved from http://www.brookings.edu/~/media/Research/Files/Papers/2008/7/payd-bordoffnoel/07_payd_bordoffnoel.PDF
- Brookhuis, K. A., D. de Waard, and N. Samyn. 2004. “Effects of MDMA (Ecstasy), and Multiple Drugs Use on (Simulated) Driving Performance and Traffic Safety.” Psychopharmacology 173: 440–445.10.1007/s00213-003-1714-5
- Cialdini, R. B. 2001. Influence: Science and Practice. Boston, MA: Allyn & Bacon.
- Clarke, D. D., P. Ward, C. Bartle, and W. Truman. 2010. “Killer Crashes: Fatal Road Traffic Accidents in the UK.” Accident Analysis & Prevention 42 (2): 764–770.
- Delhomme, P., J. Chappé, K. Grenier, M. Pinto, and C. Martha. 2010. “Reducing Air-pollution: A New Argument for Getting Drivers to Abide by the Speed Limit?” Accident Analysis & Prevention 42 (1): 327–338.
- Dijksterhuis, C., B. Lewis-Evans, L. H. Jelijs, D. de Waard, K. A. Brookhuis, and O. M. Tucha. 2014. “The Simulator Studies.” Report PAYD-4, ‘Feedback from Pay-as-You-Drive Insurance, Both outside and inside the Car’ Project, University of Groningen, The Netherlands.
- Dijksterhuis, C., B. Lewis-Evans, L. H. Jelijs, D. de Waard, K. A. Brookhuis, and O. M. Tucha. 2015. “The Impact of Immediate or Delayed Feedback on Driving Behaviour in a Simulated Pay-as-You-Drive System.” Accident Analysis & Prevention 75: 93–104.
- Dingus, T. A., S. G. Klauer, V. L. Neale, A. Petersen, S. E. Lee, J. D. Sudweeks, …, and R. R. Knipling. 2006. The 100-Car Naturalistic Driving Study, Phase II-Results of the 100-Car Field Experiment. (No. HS-810 593). Department of Transportation, Washington, DC. Retrieved from http://www-nrd.nhtsa.dot.gov/departments/human%20factors/driver-distraction/PDF/100CarMain.pdf
- Dorn, L. 2014. Divisional Keynote Lecture at the 28th International Congress of Applied Psychology, Paris, July 8–13, 2014.
- Evans, L. 2004. Traffic Safety. Bloomfield Hills, MI: Science Serving Society.
- Fors, C., K. Kircher, and C. Ahlström. 2015. “Interface Design of Eco-driving Support Systems–Truck Drivers’ Preferences and Behavioural Compliance.” Transportation Research Part C: Emerging Technologies 58: 706–720.10.1016/j.trc.2015.03.035
- Groeger, J. A. 2006. “Pay as You Learn: The Potential of Using Vehicle Electronics Data for a Pay as You Learn Approach for Long Term Improvements in Driving Skill.” Proceedings of the 13th ITS World Congress,London. 8-12 October 2006.
- Harvey, J., N. Thorpe, and R. Fairchild. 2013. “Attitudes towards and Perceptions of Eco-driving and the Role of Feedback Systems.” Ergonomics 56 (3): 507–521.10.1080/00140139.2012.751460
- Hatfield, J., and R. Fernandes. 2009. “The Role of Risk-propensity in the Risky Driving of Younger Drivers.” Accident Analysis & Prevention 41 (1): 25–35.
- Hibberd, D. L., A. H. Jamson, and S. L. Jamson. 2015. “The Design of an in-vehicle Assistance System to Support Eco-driving.” Transportation Research Part C: Emerging Technologies 58: 732–748.10.1016/j.trc.2015.04.013
- Horberry, T., J. Anderson, M. A. Regan, T. J. Triggs, and J. Brown. 2006. “Driver Distraction: The Effects of Concurrent in-vehicle Tasks, Road Environment Complexity and Age on Driving Performance.” Accident Analysis and Prevention 38 (1): 185–191.10.1016/j.aap.2005.09.007
- Hsee, C. K., F. Yu, J. Zhang, and Y. Zhang. 2003. “Medium Maximization.” Journal of Consumer Research 30 (1): 1–14.10.1086/374702
- Jamson, A. H., and N. Merat. 2005. “Surrogate in-vehicle Information Systems and Driver Behaviour: Effects of Visual and Cognitive Load in Simulated Rural Driving.” Transportation Research Part F: Traffic Psychology and Behaviour 8 (2): 79–96.10.1016/j.trf.2005.04.002
- Kahneman, D., and A. Tversky. 1979. “Prospect Theory: An Analysis of Decision under Risk.” Econometrica: Journal of the Econometric Society, 263–291.10.2307/1914185
- Lahrmann, H., N. Agerholm, N. Tradisauskas, T. Næss, J. Juhl, and L. Harms. 2012. “Pay as You Speed, ISA with Incentives for Not Speeding: A Case of Test Driver Recruitment.” Accident Analysis and Prevention 48: 10–16.10.1016/j.aap.2011.03.014
- Lauper, E., S. Moser, M. Fischer, E. Matthies, and R. Kaufmann-Hayoz. 2015. “Psychological Predictors of Eco-driving: A Longitudinal Study.” Transportation Research Part F: Traffic Psychology and Behaviour 33: 27–37.10.1016/j.trf.2015.06.005
- Lehman, P. K., and E. S. Geller. 2005. “Behavior Analysis and Environmental Protection: Accomplishments and Potential for More.” Behavior and Social Issues 13 (1): 13–32.10.5210/bsi.v13i1.33
- Lewis Evans, B., A. den Heijer, C. Dijksterhuis, D. de Waard, K. A. Brookhuis, and O. M. Tucha. 2013A. “Univé Customer Survey: Pay-as-You-Drive (PAYD) Insurance.” Report PAYD-2, ‘Feedback from Pay-as-You-Drive Insurance, Both outside and inside the Car’ Project, University of Groningen, The Netherlands. Accessed http://www.rug.nl/research/portal/publications/unive-customer-survey-payasyoudrive-payd-insurance(25133df5-ae76-46f5-a9e0-1452fce98896).html.
- Lewis-Evans, B. 2010. “Crash Involvement during the Different Phases of the New Zealand Graduated Driver Licensing System (GDLS).” Journal of Safety Research 41 (4): 359–365.10.1016/j.jsr.2010.03.006
- Lewis-Evans, B., C. Dijksterhuis, P van Wolffelaar, J. Meijer, D. de Waard, K. A. Brookhuis, and O. M. Tucha. 2013B. “Pay-as-You-Drive Insurance User Interface Survey.” Report PAYD-3, ‘Feedback from Pay-as-You-Drive Insurance, Both outside and inside the Car’ Project. University of Groningen, the Netherlands. Accessed http://www.taels.net/docs/PAYD_UI_survey_results_summary.pdf
- Litman, T. 2005. “Pay-as-You-Drive Pricing and Insurance Regulatory Objectives.” Journal of Insurance Regulation 23 (3): 35–53.
- Litman, T. 2011. Pay-as-You-Drive Pricing for Insurance Affordability. Victoria Transport Policy Institute. Retrieved from http://www.vtpi.org/payd_aff.pdf
- OECD-ECMT. 2006. “Young Drivers: The Road to Safety.” OECD—Organisation for Economic Co-Operation and Development & ECMT—European Conference of Ministers of Transport, Joint OECD/ECMT Transport Research Centre, Paris.
- van Osselaer, S. M., J. W. Alba, and P. Manchanda. 2004. “Irrelevant Information and Mediated Intertemporal Choice.” Journal of Consumer Psychology 14 (3): 257–270.10.1207/s15327663jcp1403_7
- Rouzikhah, H., M. King, and A. Rakotonirainy. 2013. “Examining the Effects of an Eco-driving Message on Driver Distraction.” Accident Analysis & Prevention 50: 975–983.
- Simons-Morton, B., N. Lerner, and J. Singer. 2005. “The Observed Effects of Teenage Passengers on the Risky Driving Behavior of Teenage Drivers.” Accident Analysis & Prevention 37 (6): 973–982.
- Simons-Morton, B. G., M. C. Ouimet, Z. Zhiwei, S.L. Lee, S. E. Klauer, J. Wang, Chen R., Albert P.E., T. E. Dingus. (2011). Risky Driving Among Novice Teenagers and Their Parents." American Journal of Public Health, 101 (12), pp. 2362–2367.10.2105/AJPH.2011.300248
- Simons-Morton, B. G., C. R. Bingham, M. C. Ouimet, A. K. Pradhan, R. Chen, A. Barretto, and J. T. Shope. 2013. “The Effect on Teenage Risky Driving of Feedback from a Safety Monitoring System: A Randomized Controlled Trial.” Journal of Adolescent Health 53 (1): 21–26.10.1016/j.jadohealth.2012.11.008
- Skinner, B. F. 1974. About Behaviorism. New York: Knopf.
- Sodhi, M., B. Reimer, and I. Llamazares. 2002. “Glance Analysis of Driver Eye Movements to Evaluate Distraction.” Behavior Research Methods, Instruments, & Computers 34 (4): 529–538.10.3758/BF03195482
- Stanton, N. A., and M. S. Young. 2005. “Driver Behaviour with Adaptive Cruise Control.” Ergonomics 48 (10): 1294–1313.10.1080/00140130500252990
- Ullberg, C. F. 2009. Harsh Driving Detection Using FMS-Standard (Master's thesis, Royal Institute of Technology, Stockholm, Sweden).
- Van Osselaer, S. M., J. W Alba, & P. Manchanda. (2004). Irrelevant information and mediated intertemporal choice. Journal of Consumer Psychology, 14 (2).
- Victor, T. W., J. L. Harbluk, and J. A. Engström. 2005. “Sensitivity of Eye-movement Measures to in-vehicle Task Difficulty.” Transportation Research Part F: Traffic Psychology and Behaviour 8 (2): 167–190.10.1016/j.trf.2005.04.014
- Williams, A. F. 2003. “Teenage Drivers: Patterns of Risk.” Journal of Safety Research 34 (1): 5–15.10.1016/S0022-4375(02)00075-0
- Young, M. S., S. A. Birrell, and N. A. Stanton. 2011. “Safe Driving in a Green World: A Review of Driver Performance Benchmarks and Technologies to Support ‘Smart’ Driving.” Applied Ergonomics 42 (4): 533–539.10.1016/j.apergo.2010.08.012
- Zaal, D. 1994. Traffic Law Enforcement: A Review for the Literature (No. 53). Melbourne: Monash University Accident Research Centre.