
 ?Mathematical formulae have been encoded as MathML and are displayed in this HTML version using MathJax in order to improve their display. Uncheck the box to turn MathJax off. This feature requires Javascript. Click on a formula to zoom.
Abstract
How humans will adapt and respond to the introduction of autonomous vehicles (AVs) is uncertain. This study used an agent-based model to explore how AVs, human-operated vehicles, and cyclists might interact based on the introduction of flawlessly performing AVs. Under two separate experimental conditions, results of experiment 1 showed that, despite no conflicts occurring between cyclists and AVs, modelled conflicts among human-operated cars and cyclists increased with the introduction of AVs due to cyclists’ adjusted expectations of the behaviour and capability of human-operated and autonomous cars. Similarly, when human-operated cars were replaced with AVs over time in experiment 2, cyclist conflict rates did not follow a linear reduction consistent with the replacement rate but decreased more slowly in the early stages of replacement before 50% substitution. It is concluded that, although flawlessly performing AVs might reduce total conflicts, the introduction of AVs into a transport system where humans adjust to the behaviour and risk presented by AVs could create new sources of error that offset some of AVs assumed safety benefits.
Practitioner summary: Ergonomics is an applied science that studies interactions between humans and other elements of a system, including non-human agents. Agent-Based Modelling (ABM) provides an approach for exploring dynamic and emergent interactions between agents. In this article, we demonstrate ABM through an analysis of how cyclists and pedestrians might interact with Autonomous Vehicles (AVs) in future road transport systems.
Abbreviations: ABM: agent-based model; AV: autonomous vehicle; ODD; overview, design concepts and details; RW: rescorla-wagner
1. Introduction
The health benefits and reduction in chronic disease from increased physical activity gained through active transport are well established (Woodcock et al. Citation2011). However, in places where the poor separation between motorised vehicles and vulnerable road users exists, injury rates per kilometre travelled are comparatively higher than those where physical separation is present (Morrison et al. Citation2019; World Health Organization Citation2018). Worldwide, more than half of road traffic deaths occur among vulnerable road users who interact with motorised vehicles (World Health Organization Citation2018). It is therefore difficult for cities to encourage increased rates of cycling without experiencing concomitant (though not proportional) increases in cycling crashes (Bhalla et al. Citation2007; Stevenson et al. Citation2016). While investment in separated cycling infrastructure is one solution to this problem, high financial and political costs are often associated with these policies in already car-dominated countries such as the United States, Canada, Australia, and New Zealand, when they are perceived to divert funding and priority away from motor vehicles (Pucher, Dill, and Handy Citation2010; Reynolds et al. Citation2009).
As an alternative to costly infrastructure changes, the deployment of autonomous vehicles (AVs) has been forwarded as a potential solution to the issue of mixed-mode interaction (Combs et al. Citation2019; Millard-Ball Citation2018). If AVs can learn to accurately identify other vehicles and vulnerable road users and either evade, avoid or recover from situations leading to crashes, the benefits in terms of reduced injuries and trauma could be significant (Combs et al. Citation2019; Parkin et al. Citation2016). However, the prospect of coordination among networked AVs with vehicle-to-vehicle communication in controlled environments is very different to that of AVs interacting with non-networked and less predictable humans in situ – something Hancock (Citation2019) refers to as mixed equipage. And while the idea of ‘flawless’ or perfectly performing AVs that do not crash exists, the technology required to ensure AVs can operate safely in the extreme variety of unpredictable and novel situations vehicles face, to ‘learn’ (in an algorithmic sense) from these experiences, and to then make acceptably ‘moral’ decisions in the case of inevitable collisions, is far from ready (Hancock Citation2018). Indeed, the introduction of AVs may lead to new types of crashes due to the pitfalls of automation (De Winter Citation2019).
Further, once deployed, community expectations hold that AVs will be safer than human drivers (Anderson et al. Citation2018; Fagnant and Kockelman Citation2014). In this context, the financial and legal consequences for AV manufacturers’ vehicles contributing to crashes may also be higher than for fallible human drivers (Anderson et al. Citation2018) and recovery outcomes for people injured as a result of AV errors potentially worse given resulting external attributions of responsibility for crashes (Pollanen et al. Citation2020; Thompson, Berk, et al. Citation2014; Thompson et al. Citation2015; Thompson, O’Donnell, et al. Citation2014).
Putting technological barriers aside, even if AV manufacturers achieve ‘flawlessly performing’ vehicles that never collide with humans, humans’ responses to the introduction of AVs is uncertain. A great strength of humans, and other intelligent animals (Legagneux and Ducatez Citation2013), is adaptability; we learn to understand, manipulate and exploit our environment. Consistent with other learned behaviours across alternate domains, if AVs behave differently around humans (i.e., to drive conservatively to avoid collisions at all costs), humans may learn to behave differently around AVs than they had previously around manually operated cars that bear the threat of injury (Brooks Citation2017; Millard-Ball Citation2018). This dynamic adaptation could lead to new situations and crash risks not previously present or imagined in the transport system. Whilst many pessimists have focussed on imperfect AVs and their safety impacts (Hancock Citation2018; Salmon Citation2019), few have considered the potentially adverse safety impacts of perfect automation within environments containing other imperfect actors. Indeed, recent detailed analyses of the potential of AV technology to prevent over 3300 recorded vehicle vs pedestrian crashes in the United States specifically notes the limitations of statistical models not being able to capture human and other drivers’ adaptation to the presence of AVs over the period of introduction (Combs et al. Citation2019).
There have been many models of traffic safety developed previously, which have taken on a variety of forms (Young et al. Citation2014). Overwhelmingly, these models have taken a static, top-down approach where the risk of a crash (and consequent crashes) is estimated using probabilities or risk gradients based on vehicle behaviours such as speed, angle, and the modelled physical proximity of vehicles to one another. Given that most of these efforts have developed from an engineering perspective, it is perhaps logical that many have been produced as extensions to existing traffic simulation models frequently used by traffic engineers designed for understanding traffic flow in applied situations (e.g. AIMSUN or VISSIM (Aimsun Citation2020; PTV Group Citation2020)). While efforts are regularly made to calibrate risk profiles to real-world data in these models (Davis and Morris Citation2009), the perceptual or skill errors leading to crashes that individual drivers experience remain black-box processes; we may know the risk of crashing between two vehicles crossing paths is x, but we still do not know why. Although game-theoretical models have addressed this gap to some extent by including static representations of cognitive frameworks in negotiated traffic conflict situations (e.g. Bjørnskau Citation2017; Elvik Citation2014; Millard-Ball Citation2018), to our knowledge, there are no traffic conflict or crash simulation models that approach the subject from the alternative perspective; that of dynamic individual cognitive and learning frameworks and manipulation of the factors that lead to perceptual errors that produce risky behaviours and consequent crashes.
The goal of this paper is, therefore, to better understand patterns of potential crashes (referred to in the model as ‘conflicts’) between vulnerable road users (namely cyclists) and manually-driven cars (cars) following the introduction of AVs into the transport system. We aim to explore changes in car-cyclist conflict frequency associated with the introduction of AVs into an existing transport system under conditions where 1) AVs perform ‘flawlessly’, 2) human drivers adapt to the presence of cyclists, and 3) cyclists adapt to the presence of AVs. The second goal of this paper is to demonstrate how this question can be tackled using methods of computational social science, namely, agent-based modelling. A third and final goal of the paper is to demonstrate the agent-based modelling method and its potential utility in assisting to answer questions in the field of ergonomics more broadly.
2. Method
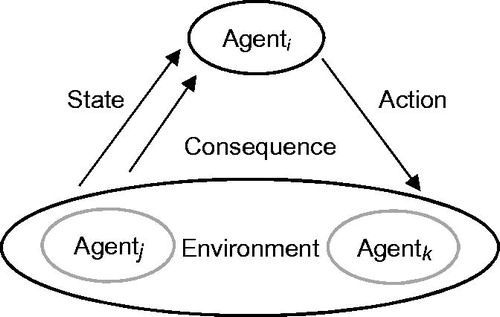
This work used agent-based modelling, henceforth referred to as ABM. While the flexibility of ABM means that exceptions to any fast definition can likely be found, for the reader new to ABM, we would describe it in the following simplified manner: Agent-based modelling is a computational method that enables the exploration of interactions between multiple independent synthetic ‘agents’ or entities of interest. These agents generally make decisions and take actions in relation to a set of flexible rules governed by preferences, other agents’ observed behaviour, and in response to the potentially evolving nature of the environment they inhabit, which is also influenced by other agents in a bottom-up process. Although exogenous factors may also play a role in shaping the environment, the actions agents take influence their local environment. In turn, the environment has consequences for the agent, influences their state, and in turn, influences decisions and actions made by agents at subsequent time-points (see ). Agents can be modelled as independent entities at any scale; from individuals to populations, organisations or countries. Of interest in most ABMs related to socio-technical systems is the dynamic interplay between modelled agents at an individual scale and how this affects patterns of behaviour and performance of systems at a macro scale. Models are run dynamically over ‘time steps’ which can be used to represent any relevant time scale (i.e. from seconds to hours, to years or simply ‘moments’). For the first introduction to ABM, readers are referred to Gilbert (Citation2008).
Figure 1. Depiction of the dynamic relationship between agents, their actions, the environment, consequences for the agent and consequences for the agents’ state.
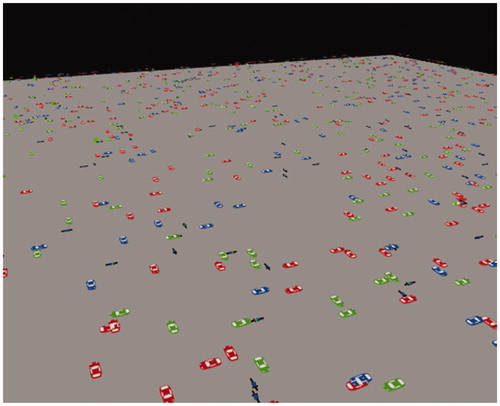
The present model is an adaptation of a previously published (Thompson, Savino, and Stevenson Citation2016) ABM of behavioural adaptation by car drivers to the increased presence of cyclists represented within a simple, ‘Manhattan grid’ configuration consisting of 4356 unsignalised intersections, constructed in Netlogo (Wilensky Citation2016) (see ). A detailed description of the present model following principles adapted from the ‘ODD Protocol’ (Grimm et al. Citation2010) is available in Appendix A. In the prior model, drivers became increasingly aware of cyclists as more cyclists entered the road system, and, through an individual reinforcement learning and adaptation process represented by Rescorla–Wagner (RW) learning algorithms encoded within each agent (Rescorla and Wagner Citation1972), adapted their driving behaviour and likelihood of driving safely around cyclists in response. The RW learning model is representative of ‘classical conditioning’ whereby pairs of stimuli (e.g. roads and cyclists) are perceived together by an observer (e.g. a driver) to the extent that when presented with one stimulus (roads), the learner then expects the second, conditioned stimulus (e.g. cyclists), which may then trigger a conditioned response (e.g. more careful observance or driving behaviour). As with other representations of classical conditioning processes, observers also possess the capacity to have associations between stimuli extinguished if items are perceived independently.
Figure 2. Top-down, angled view of the Netlogo model showing the position of vehicles and vehicle classes represented in the system.
In this paper, we extended the representation from Thompson, Savino, and Stevenson (Citation2016) to include an additional class of vehicle (AVs) by also providing cyclists with an ability to learn to recognise and adapt behaviour towards both human-driven cars (cars) and AVs. The process of adaptation for cyclists also followed an RW configuration, with each cyclist possessing an accuracy of perception, a desire to act well, a memory for previous events, a maximum level of association between stimuli, a timescale for building up knowledge, and a timescale for forgetting (i.e. a memory span).
2.1. Model context
An important distinction should be made for readers more familiar with traffic simulation models as are common within the engineering literature and typically devoted to crash risk estimation and safety (e.g. see Young et al. Citation2014). Firstly, expectations related to the accurate representation of spatio-temporal elements of the model should be put to one side. The model does not attempt accurate representation of time, speed, nor origin-destination matrices. Rather, it seeks to represent features related to learning and cognition in respect of interactions between vehicle operators of various classes; human and non-human. In this respect, it is more-so a model of learning and interaction applied to the transport domain than a traffic simulation model.
Secondly, the model does not attempt an accurate representation of traffic volumes but attempts to create a critical number of interactions between simulated vehicle operators that exposes only the variables of interest to analysis. Here, an analogy can be made with the well-known ‘El Farol Bar’ model (Arthur Citation1994) – one of the first to explore the outcomes of inductive reasoning and bounded rationality among computational agents. Within the El Farol Bar model, agents decide whether they will attend a bar based on how crowded they think it will be and this decision is based on their previous experience of attending that bar. The focus of the model is, therefore, the decision-making of agents and the macro patterns of behaviour their collective reasoning produces. Days of the week, time of day, hangovers experienced by the agents, or other features that might be used in models targeted for more pragmatic purposes (e.g. organising adequate bar-staff rosters) are ignored. Despite these exclusions, the model is instructive for its intended purposes in the tradition that it is designed to be both wrong and useful (Box Citation1976).
2.2. Model assumptions and scope
Assumptions made in the model were that AVs acted flawlessly by exhibiting extreme care, perfect identification of other vehicles, and always yielded to other human-driven cars and cyclists. AVs never collided with other vehicles. Human drivers acted identically to the manner they had done in Thompson, Savino, and Stevenson (Citation2016); while desiring to drive as safely as they could around cyclists, their performance was occasionally imperfect, and their skill-levels changed in response to increasing or decreasing exposure to cyclists, consistent with the behavioural adaptation hypothesis (Jacobsen, Ragland, and Komanoff Citation2015). The mean number of conflicts for the population of drivers was equivalent to the inverse of the mean level of adaptation drivers had achieved at any time; more adaptation to cyclists, less conflict risk.
Cyclists’ adaptation in the model consisted of them learning that AVs would not crash into them. This was akin to cyclists developing schemata which influence their perceptual exploration and actions on the environment (Plant and Stanton Citation2013; Salmon et al. Citation2014). In the model, cyclist schemata incorporated flawless AVs that do not represent a safety risk; with increasing exposure, cyclists learned that they could safely progress through intersections without needing to yield to AVs because AVs operated perfectly. Like human drivers, however, cyclists’ perceptions were not without error; they did not always recognise the difference between manually driven cars and AVs and occasionally put themselves in the path of human drivers that did not have the same capacity to avoid a collision (i.e. perfectly safe performance) that AVs possessed. This capacity to recognise AVs in the road environment was represented through the value of saliency, described below.
Across the transport system, where cyclists encountered increasing numbers of AVs, an increased association between the act of cycling and the expectation of encountering an AV at an intersection occurred. Under these conditions, the association was expressed as a function of time, V(tk).
Considering a given population of n cyclists, mean association to AVs at time tk can be expressed as:
(1)
(1)
Where for an individual cyclist, i, the association is:
(2)
(2)
For the change in association we assume a relationship of the form
(3)
(3)
In this equation, the values of and
represent the saliency of AVs that exist in the road environment and saliency of the road environment, respectively (i.e. how identifiable AVs are (
and how identifiable to the cyclist it is that the AV is on a road shared by them (
)). Changes to the value of these variables can be imagined as efforts to make AVs more or less distinguishable from ‘normal’ cars or making cyclists more or less visible (e.g. through the use of lights or high visibility clothing) to drivers. It is assumed that the value of road saliency for cyclists is 1 at all times, indicating that cyclists always recognise that the AV is on the road. The value of
represents the maximum possible association cyclists can achieve between cycling and expectation that cars are autonomous (AVs), and
is the association strength between cycling and expectation of encountering an AV for the ith cyclist at the previous time step. In addition to these features, cyclists also held a fixed level of intention to ride safely around cars
and a capacity to do so
which assumed a range between 0 (no intention or capacity to ride safely) and 1 (maximum intention and capacity) for each variable, respectively. These factors had the effect of moderating the impact of learned behaviour on risk-taking and therefore conflicts in a manner analogous to the final stages of the theory of planned behaviour (Ajzen Citation2011) (i.e. intention and actual behavioural control).
For cyclists in the model, the association between cycling and expectation of interacting with AVs remained stable for the period equivalent to a cyclist’s memory span, m. Cyclists’ memory spans were not infinite and the continued absence of AVs beyond a cyclist’s memory span resulted in a loss of association for individual cyclists. Such ‘extinction’ could occur at any stage in the learning process. Consistent with the Rescorla-Wagner model of conditioning, the decrease in association between cycling and expectation of interacting with an AV for individual cyclists also followed EquationEq. (3)(3)
(3) , but with λ set to 0, reflecting the minimum possible association between ‘between cycling and expectation that cars are autonomous (i.e. no expectation of encountering an AV)’. This resulted in the final formulation of
as follows:
(4)
(4)
All other relationships in the model are consistent with those outlined in Thompson, Savino, and Stevenson (Citation2016) (see Appendix A), including behavioural adaptation by human drivers to the presence of cyclists. shows values associated with each agent class and characteristics within the model. In each trial, values for individual agent characteristics across vehicle saliency, capacity, and care were drawn from a normally-distributed range with a mean as indicated, and a standard deviation of 0.1. Where individual agent characteristics exceeded 1.0 for care, capacity and vehicle saliency, or was less than 0, the value was re-drawn.
Table 1. Factors, notation, and settings associated with each trial under each experimental condition.
To test the effect that the introduction of AVs had on bicycle vs vehicle conflicts, the model was run using two experimental approaches. In the first, a ‘pre vs post’ comparison of conflict frequency was made between conditions consisting of a population of 2000 cars and 500 bicycles. The change in conflict frequencies was monitored before and after 500 additional AVs were deployed in the system at time-step 100 of 200. In the second approach, an additional 500 manually driven cars were added to the system at time 100 instead of AVs. The decision to add an additional 500 (25%) vehicles was taken to consider the effect of the policy change, only, and was not designed to reflect realistic assumptions.
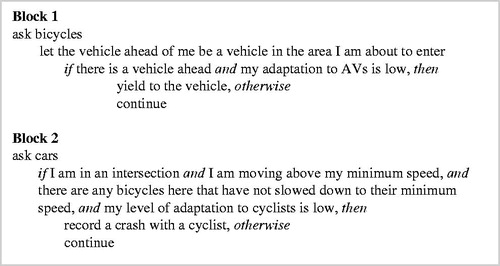
uses pseudo-code to describe the interaction of cyclists among cars and AVs at intersections and the likelihood that cars crash into cyclists. Code block 1 shows the likelihood that cyclists would slow down and yield for vehicles at intersections is dependent upon their level of association (V) at that time point. Code block 2 demonstrates that if a cyclist and car find themselves at the same position in an intersection, the likelihood that conflict is recorded is dependent upon the driver’s level of adaptation to cyclists at that time point.
Figure 3. Pseudo-code associated with behaviour of cyclists (Block 1) and cars (Block 2) at intersections as it relates to crash-risk.
In the second experimental approach, an original population of 2000 manually driven cars was exchanged for AVs over 2000 time-steps. Cyclist numbers remained constant at 500 in each experiment. The values of factors contained within the RW formula for cyclists was varied across trials to determine how this contributed to changes in overall learning (V) among cyclists to AVs and consequent crash rates (i.e. from the RW learning model).
shows the conditions under which each experimental condition was run, including variation in elements contained within the RW learning model described, above. In total, the model was run under a total of 243 separate conditions, 81 under the ‘pre vs post’ AV deployment approach, 81 under the pre vs post manual deployment approach, and 81 under the ‘trade’ approach, varying the strength of parameters described in .
3. Results
Results presented below represent mean statistics for the combination of all varied parameters across all model runs. Additional detail is also presented showing variation in model outputs taking into account differences between trials in agents’ memory span and learning rate as moderated by the saliency of (1) bicycles to drivers and, (2) of AVs to cyclists. We present these results separately to demonstrate the sensitivity of the model outputs to input parameters. Examples of how other researchers might want to tune model parameters for their own purposes could be where a researcher wishes to cap the level of saliency associated with a group of cyclists who do not use lights at night, or where the researcher wishes to model the increase in sensitivity to the presence of cyclists among drivers who have been primed to expect cyclists on the road through education campaigns (e.g. Dalton, Sumner, and Jones Citation2020). To allow for adequate model ‘burn-in’, pre vs post comparisons in experiment 1 are made between time-steps 50–100 (pre-condition) and 100–150 (post-condition).
3.1. Experiment 1: addition of 500 AVs to an existing population of vehicles vs 500 manually driven cars at time-step 100
Results of experiment 1 demonstrated that after the addition of 500 AVs at time-step 100, the mean number of conflicts in the simulated road system between manually-driven cars (cars) and cyclists increased from 54.73 (SD = 0.53) per time-step to 56.13 (SD = 0.92) (see ). Importantly, this increase occurred despite AVs operating ‘flawlessly’ and never colliding with any cyclists. Rather, the increased conflict frequency occurred between manually operated cars and modelled cyclists due to cyclists’ adjusted, imperfect expectations about the behaviour and capability of manually-operated and autonomous cars they were exposed to (see later in the text). Cyclists that had become accustomed to the safe behaviour of AVs occasionally mistook them for manually driven cars and expected them to operate as AVs did. Consequently, some cyclists failed to yield and were more likely to experience conflicts with drivers, particularly if the drivers had low levels of adaptation to cyclists. These effects were independent of the learning rate controlled by features such as vehicle saliency.
Figure 4. Mean count of car vs cyclist conflicts per time-step with additional deployment of AVs or Manual cars at time-step 100.
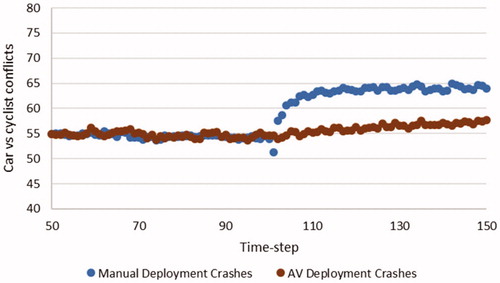
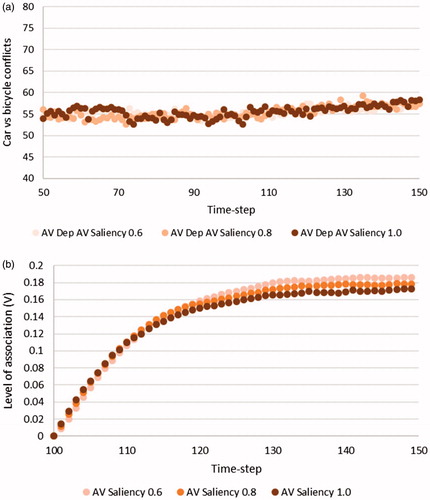
Figure 5. (a) Mean count of car vs cyclist conflicts per time-step with additional deployment of 500 AVs at time-step 100 under each of 3 AV saliency conditions, 0.6, 0.8, and 1.0. (b) Mean association between AVs and the road environment recorded for simulated cyclists per time-step with additional deployment of 500 AVs at time-step 100 under each of 3 AV saliency conditions, 0.6, 0.8, and 1.0.
By comparison, the introduction of 500 manually driven cars into the model at time-step 100 increased mean crash rates from 54.51 (SD = 0.41) to 62.94 (SD = 2.20). This result suggests that although the inclusion of AVs into the system increased overall conflicts, it did so to a considerably lesser extent than adding manually driven vehicles under our assumptions.
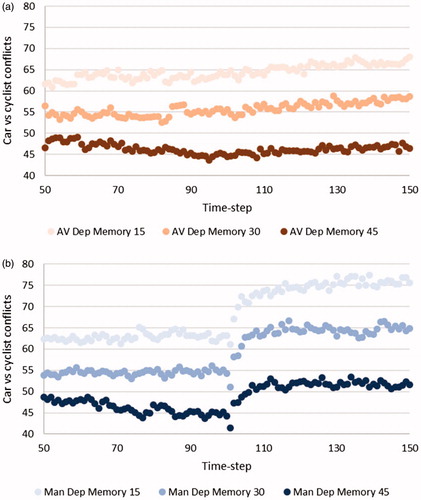
Closer inspection of these results reveals their sensitivity to model assumptions. show how the memory span of agents in the model affects total recorded conflicts pre and post-deployment. The effect of longer modelled memory spans (e.g. 45 time-steps) among agents is to dampen the impact of post-deployment bicycle vs car conflicts in the pre- vs post-conditions. This is because drivers with longer memories are less likely to forget having seen cyclists (i.e. levels of V remain elevated – see Appendix A). This effect outweighed the impact of cyclists’ increased memory for having observed AVs.
Figure 6. Mean count of car vs cyclist conflicts per time-step with additional deployment of (a) 500 AVs at time-step 100 under each of 3 memory span conditions of 15, 30, and 45 time-steps. (b) 500 manually-driven cars at time-step 100 under each of 3 memory span conditions of 15, 30, and 45 time-steps.
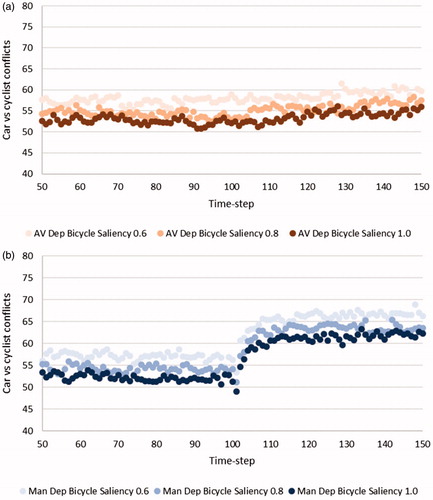
Comparison of results under varying conditions of cyclist saliency (i.e. β values associated with cyclists) also demonstrates the reduction in conflict frequency between manually driven cars and cyclists associated with greater cyclist saliency in both the pre-and post-deployment scenarios (see ).
Figure 7. Mean count of car vs cyclist conflicts per time-step with additional deployment of (a) 500 AVs at time-step 100 under each of 3 bicycle saliency conditions, 0.6, 0.8, and 1.0. (b) 500 manually-driven cars at time-step 100 under each of 3 bicycle saliency conditions, 0.6, 0.8, and 1.0.
Finally, comparison of results under varying conditions of AV saliency (i.e. β values associated with AVs) across the pre-and post-deployment scenarios (see ) showed little observed difference in conflict frequency between manually driven cars and cyclists under the three conditions (0.6 saliency M = 55.86, SD = 1.01, 0.8 saliency M = 56.21, SD = 1.13, 1.0 saliency M = 56.15, SD = 1.15). shows the mean strength of association (V) for cyclists across conditions in the post-deployment phase. This demonstrates that so long as learning occurred among cyclists and remained strong (i.e. V remained high) the rate of learning was less consequential for the frequency of conflicts, at least in the short-term post AV deployment. Interestingly, a lower (and therefore slower) learning rate ultimately produced a higher mean association level; a phenomenon familiar to many researchers in the fields of AI and machine learning where learning rates are tuned down toward the end of trials. Results for the manual-car deployment scenario are not shown as no AVs were deployed in that scenario.
3.2. Experiment 2: gradual introduction of AVs
Results of experimental condition 2, where manually driven cars were gradually traded for AVs over the course of 2000 time-steps, demonstrated another perspective. When manually driven cars were exchanged for AVs over time, cyclist conflicts did not follow a proportional linear reduction in frequency. We fitted a cubic spline with natural end-point conditions to the data points at time-step x = 0, 500, 1000, 1500 and 2000. Coefficients of the fitted spline function in the first segment [0, 500] show the function is concave, indicating the reduction in conflicts is non-linear and accelerates as more human drivers are replaced by AVs (see ). This phenomenon was caused by two functions of the model.
Figure 8. Count of car vs cyclist conflicts per time-step with trade of manually driven cars for AVs at a rate of 1 per time-step over 2000 total time-steps alongside a fitted cubic spline curve and risk of car vs cyclist conflicts per manually driven car.
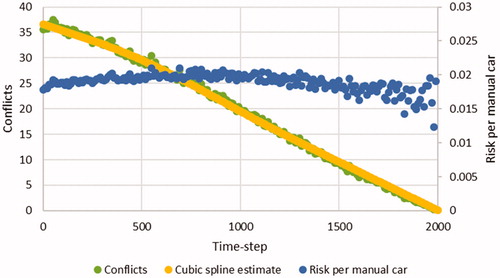
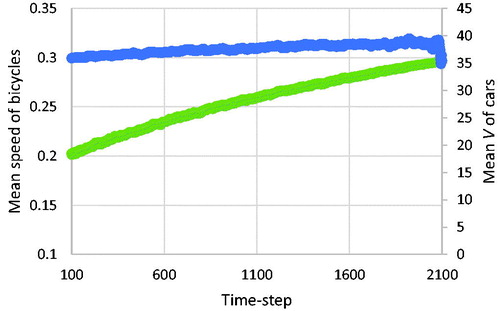
Firstly, the initial non-linear reduction in conflicts per time-step and increase in crash-risk per time-step for manually driven cars was driven by the same behavioural adaptation function responsible for the increase in conflicts observed in experiment 1; cyclists that had adapted to AVs failed to yield to manually driven cars. This trend was most noticeable up to around time-step 500–1000 (25–50% of replacement) as confirmed by the fitted cubic spline curve. However, the rate of conflict reduction accelerated after this period alongside a reduction in risk of cyclist conflicts per manually driven car. This latter effect was driven by an increase in an average speed of bicycles throughout the network who were no longer stopping to give way to AVs as frequently, which consequently exposed remaining manually driven car drivers to more cyclists (see ). This resulted in a gradual increase in the level of association and behavioural adaptation to cyclists (and increased safety) among car drivers in the closing stages of replacement. While this result is consistent with results of prior models studying the behavioural adaptation hypothesis (Thompson, Savino, and Stevenson Citation2016) it is unclear whether it would hold in a real-world environment (see Section 4.4)
Figure 9. Mean speed of bicycles per time-step and mean association strength (V) of manually driven cars.
4. Discussion
The interaction between AVs and vulnerable road users is likely to represent a topic of considerable interest to road safety researchers and the travelling public over the next few decades (Hancock Citation2018; Kyriakidis et al. Citation2019; Salmon and Read Citation2019). Whilst most safety concerns relate to imperfect AVs that may not interact well with cyclists and pedestrians, other drivers or AV operators, we are unaware of other studies that have deliberately considered the negative safety impacts of well-designed and optimally functioning AVs in the context of interactions with imperfect humans outside the vehicle. In this study, we used ABM to explore potential road user behaviours and road safety outcomes during a transition period to flawlessly performing AVs under conditions of dynamic learning among vehicle classes.
The findings highlight that under conditions where humans (e.g. cyclists) adapt to AVs acting flawlessly, new sources of error could emerge that off-set the total safety benefits of AVs to some extent. The ABM demonstrated that even if AVs perceive and act perfectly, contributing no collisions from their own actions, if humans consequently adapt to a lower-risk environment created by their presence, it could increase the risk of conflicts between cyclists and manually driven cars during the transition. This could occur where vulnerable road users do not appropriately distinguish between AVs and manually driven cars. In particular, the modelling demonstrates that, under our assumptions, the introduction of additional AVs into a fleet of manually driven cars and cyclists of a static number could increase total cyclist conflicts due to increased risk-taking by cyclists. In an alternative ‘trade’ scenario that gradually replaces manually driven cars with AVs, we show that the reduction in total conflicts might not decrease proportionately with the introduction of perfectly performing AVs, but may decrease more slowly initially, before accelerating towards the end of the transition period (after 50% replacement). These results suggest that clear perceptual distinctions between AVs and manual vehicle classes may be required at the point of mass deployment to ensure safety benefits of AVs are not off-set by behavioural adaptation.
4.1. The influence of schemata on road user interactions
There is evidence in the ergonomics and safety science literature that aligns with the present study’s findings. In previous work examining the interactions between different road users, Salmon et al. (Citation2014) demonstrated the critical role that road users’ previous experience and schemata play in creating safe and unsafe interactions between drivers and cyclists. In short, the experience of previous interactions with other road users has a strong influence on road users’ expectations and interactions with one another. For example, a cyclist’s schemata of how drivers behave at intersections direct where they look, what they perceive, and ultimately how they will behave. Accordingly, features of the schemata-based perceptual cycle model (Neisser Citation1976) and Norman’s (Citation1981) schema-related error taxonomy are consistent with the model’s outputs. Based on repeated interactions with flawless AVs, cyclists will likely build AV schemata that create a strong expectation of flawless behaviour and low risk, which in turn will influence how they behave around AVs. Faulty activation of schema errors, specifically data driven activation errors (Norman Citation1981), whereby the AV schemata is triggered by manually driven cars which look similar to AVs, will result in cyclists behaving as they do around AVs. The paradox here is that, as AVs increase in number, cyclists’ ‘flawless AV’ schemata will be strengthened, and collisions with manually driven cars could become more likely as cyclists’ interactions with manually driven cars decrease. The schema explanation further explains adaptation by human drivers to the new cyclist behaviour in the second experimental approach; whereby drivers will be more likely to look for cyclists in the environment and take care to avoid collisions with them based on previous experience of their more risky behaviour around road vehicles (both AVs and manually driven cars).
4.2. AVs as unruly technologies
In discussion of the benefits of a transition to AVs, it is often reported that around 90% of road crashes are caused by human error (Infrastructure Victoria Citation2018; Parker et al. Citation1995). Perhaps concerningly, however, an implicit assumption underlying the use of this statistic for the justification of vehicle autonomy is that removal of humans from the driving task will reduce road crashes and trauma by a proportional extent (Fagnant and Kockelman Citation2014). This ignores an important element of accident causation across safety domains (e.g. patient, workplace & transport safety) that introduction of new technology designed for safety can also introduce new sources of risk and error of unknown severity and likelihood (Battles and Keyes Citation2002). These so-called ‘unruly technologies’ are a common contributory factor in major incidents (Dekker Citation2011; Grant et al. Citation2018). Moreover, there are previous examples of unruly technologies contributing to road trauma through the creation of new safety issues, including mobile phones and airbags (Salmon, McClure, and Stanton Citation2012). It is therefore critical that further studies are undertaken to explore the different emergent behaviours and risks associated with AVs. Whilst a focus on inadequate AVs is important (e.g. Hancock Citation2018), this study has highlighted that a focus on the potential adverse impacts of optimally functioning AVs is also warranted. This represents a significant gap in current AV research and further exploration is encouraged.
4.3. Agent-based modelling in ergonomics
By enabling the integration of a set of dynamic factors to be combined in a single computational model, the methods employed here demonstrate the utility of using ABM combined with learning algorithms to provide insight into emergent risk that would be difficult through discourse alone, or by using alternative modelling methods at the level of a functioning system. Indeed, while there is a long history of ergonomics studies in road safety (e.g. Brown Citation1979; Salmon and Read Citation2019; Stanton and Young Citation2005; Waard et al. Citation1995; Wagenaar and Reason Citation1990; Young et al. Citation2014) and more recent examples that have employed game-theoretic principles to explore interactions at non-signalised intersections (Bjørnskau Citation2017; Elvik and Bjørnskau Citation2017; Fox et al. Citation2018; Millard-Ball Citation2018) to date few have employed dynamic learning algorithms to explore the emergent behaviours associated with the introduction of new technologies or interventions as has been shown here. We hope this work highlights how ergonomics researchers and practitioners can explore and obtain new insights into phenomena through the combined use of ABM alongside existing models of learning and interaction both in road safety and in other ergonomics application areas.
4.4. Study limitations and future work
The limitations of this work are many and should be clearly noted. We explored results within a simulated, artificial transportation system where interaction between vehicle classes is restricted to simplified non-signalised intersections and the cognitive capabilities of agents are restricted to abstract (though well-established) learning principles. Human drivers’ adaptation to AVs is also not modelled, and no attempt has been made to realistically model travel demand, congestion, AV adoption patterns or other aspects that may come to mind for the reader familiar with traditional transportation modelling research. However, there are two responses to these limitations. Firstly, though what is left out of the model is substantial, what has been included is beyond what many models using traditional methods can integrate in terms of dynamic transition and behavioural adaptation among and between vehicles. Secondly, the ABM platform enables iterative improvement such that researchers interested in including omitted factors or relationships can do so, particularly because the code for the model is available for other researchers to access and utilise through an online repository (https://bit.ly/2YW76s9). In this respect, the model is open to the common criticism of many ABMs that it is at once ‘too complex’ and also ‘too simple’ (Waldherr and Wijermans Citation2013).
5. Conclusion
Humans are highly proficient at learning and adapting quickly to new environments, resulting in novel patterns of interaction. Regardless of whether AVs can learn to operate flawlessly in a transport system or not, humans will display new behaviours in response to AVs’ presence, especially when there are incentives (such as reducing travel time) to manipulate interactions. Such adaptation creates potentially novel crash situations and risks that are not typically in-scope of discussion when considering the safety benefits of AVs, which tend to focus on the role of vehicles or vehicle operators, only (Hancock Citation2018). Understanding how humans might adjust to future technological change in transport (and other domains) is challenging and requires methods that are both exploratory and empirical. We contend that dynamic modelling methods, including ABM, that can incorporate humans’ potential responses to AVs behaviour can be a highly useful method in the toolbox of ergonomics researchers.
Disclosure statement
No potential conflict of interest was reported by the author(s).
Additional information
Funding
References
- Aimsun. 2020. Aimsun: Aimsun. Retrieved from https://www.aimsun.com/
- Ajzen, I. 2011. “The Theory of Planned Behaviour: Reactions and Reflections.” Psychology & Health 26 (9): 1113–1127. doi:10.1080/08870446.2011.613995.
- Anderson, J. M., N. Kalra, K. D. Stanley, and J. Morikawa. 2018. Rethinking Insurance and Liability in the Transformative Age of Autonomous Vehicles. Santa Monica, CA: RAND Corporation.
- Arthur, W. B. 1994. “Inductive Reasoning and Bounded Rationality.” The American Economic Review 84 (2): 406–411.
- Battles, J. B., and M. A. Keyes. 2002. “Technology and Patient Safety: A Two-Edged Sword.” Biomedical Instrumentation & Technology 36 (2): 84–88.
- Bhalla, K., M. Ezzati, A. Mahal, J. Salomon, and M. Reich. 2007. “A Risk-Based Method for Modeling Traffic Fatalities.” Risk Analysis 27 (1): 125–136. doi:10.1111/j.1539-6924.2006.00864.x.
- Bjørnskau, T. 2017. “The Zebra Crossing Game – Using Game Theory to Explain a Discrepancy between Road User Behaviour and Traffic Rules.” Safety Science 92: 298–301. doi:10.1016/j.ssci.2015.10.007.
- Box, G. E. P. 1976. “Science and Statistics.” Journal of the American Statistical Association 71 (356): 791–799. doi:10.2307/2286841.
- Brooks, R. 2017. “Robotic Cars Won’t Understand us, and we Won’t Cut Them Much Slack.” IEEE Spectrum 54 (8): 34–51. doi:10.1109/MSPEC.2017.8000288.
- Brown, I. 1979. “Can Ergonomics Improve Primary Safety in Road Transport Systems?” Ergonomics 22 (2): 109–116. doi:10.1080/00140137908924595.
- Combs, T. S., L. S. Sandt, M. P. Clamann, and N. C. McDonald. 2019. “Automated Vehicles and Pedestrian Safety: Exploring the Promise and Limits of Pedestrian Detection.” American Journal of Preventive Medicine 56 (1): 1–7. doi:10.1016/j.amepre.2018.06.024.
- Dalton, A. M., F. Sumner, and A. P. Jones. 2020. “Digital Screen Use for a Road Safety Campaign Message Was Not Associated with Road Safety Awareness of Passers-by: A Quasi-Experimental Study.” Journal of Safety Research 72: 61–66. doi:10.1016/j.jsr.2019.12.005.
- Davis, G. A., and P. Morris. 2009. “Statistical versus Simulation Models in Safety: Steps toward a Synthesis Using Median-Crossing Crashes.” Transportation Research Record: Journal of the Transportation Research Board 2102 (1): 93–100. doi:10.3141/2102-12.
- De Winter, J. 2019. “Pitfalls of Automation: A Faulty Narrative? Commentary on Hancock (2019) Some Pitfalls in the Promises of Automated and Autonomous Vehicles.” Ergonomics 62 (4): 505–508. doi:10.1080/00140139.2019.1563334.
- Dekker, S. 2011. Drift into Failure: From Hunting Broken Components to Understanding Complex Systems. Farnham, UK: Ashgate Publishing Company.
- Elvik, R. 2014. “A Review of Game-Theoretic Models of Road User Behaviour.” Accident Analysis and Prevention 62: 388–396. doi:10.1016/j.aap.2013.06.016.
- Elvik, R., and T. Bjørnskau. 2017. “Safety-in-Numbers: A Systematic Review and Meta-Analysis of Evidence.” Safety Science 92: 274–282. doi:10.1016/j.ssci.2015.07.017.
- Fagnant, D. J., and K. Kockelman. 2014. “Preparing a Nation for Autonomous Vehicles: Opportunities, Barriers and Policy Recommendations.” Paper Presented at the Transportation Research Board 93rd Annual Meeting, Washington, DC, January 12–16.
- Fox, C., F. Camara, G. Markkula, R. Romano, R. Madigan, and N. Merat. 2018. “When Should the Chicken Cross the Road?: Game Theory for Autonomous Vehicle-Human Interactions.” Paper presented at the 4th International Conference on Vehicle Technology and Intelligent Transport Systems, Madeira, Portugal, March 16–18.
- Gilbert, N. 2008. Agent-based models. Sage.
- Grant, E., P. M. Salmon, N. J. Stevens, N. Goode, and G. J. Read. 2018. “Back to the Future: What Do Accident Causation Models Tell us about Accident Prediction?” Safety Science 104: 99–109. doi:10.1016/j.ssci.2017.12.018.
- Grimm, V., U. Berger, D. L. DeAngelis, J. G. Polhill, J. Giske, and S. F. Railsback. 2010. “The ODD protocol: a review and first update.” Ecological Modelling 221 (23): 2760–2768. doi:10.1016/j.ecolmodel.2010.08.019.
- Grimm, V., G. Polhill, and J. Touza. 2017. “Documenting social simulation models: The ODD protocol as a standard.” In Simulating Social Complexity, 349–365. Springer.
- Hancock, P. A. 2018. “Some Pitfalls in the Promises of Automated and Autonomous Vehicles.” Ergonomics 62 (4): 479–495. doi:10.1080/00140139.2018.1498136.
- Hancock, P. A. 2019. “Some Promises in the Pitfalls of Automated and Autonomous Vehicles: A Response to Commentators.” Ergonomics 62 (4): 514–520. doi:10.1080/00140139.2019.1586103.
- Infrastructure Victoria. 2018. “Advice on automated and zero emissions vehicle infrastructure.” Accessed 1 September 2019. https://www.infrastructurevictoria.com.au/wp-content/uploads/2019/04/Advice-on-automated-and-zero-emissions-vehicles-October-2018.pdf
- Jacobsen, P. L., D. R. Ragland, and C. Komanoff. 2015. “Safety in Numbers for Walkers and Bicyclists: Exploring the Mechanisms.” Injury Prevention 21 (4): 217–220. doi:10.1136/injuryprev-2015-041635.
- Kyriakidis, M., J. C. F. de Winter, N. Stanton, T. Bellet, B. van Arem, K. Brookhuis, M. H. Martens, K. Bengler, J. Andersson, N. Merat, N. Reed, M. Flament, M. Hagenzieker, and R. Happee. 2019. “A Human Factors Perspective on Automated Driving.” Theoretical Issues in Ergonomics Science 20 (3): 223–249. doi:10.1080/1463922X.2017.1293187.
- Legagneux, P., and S. Ducatez. 2013. “European birds adjust their flight initiation distance to road speed limits.” Biology Letters 9. doi:10.1098/rsbl.2013.0417.
- Millard-Ball, A. 2018. “Pedestrians, Autonomous Vehicles, and Cities.” Journal of Planning Education and Research 38 (1): 6–12. doi:10.1177/0739456X16675674.
- Morrison, C. N., J. Thompson, M. C. Kondo, and B. Beck. 2019. “On-Road Bicycle Lane Types, Roadway Characteristics, and Risks for Bicycle Crashes.” Accident Analysis & Prevention 123: 123–131. doi:10.1016/j.aap.2018.11.017.
- Neisser, U. 1976. Cognition and Reality: Principles and Implications of Cognitive Psychology. New York, NY: W.H. Freeman & Co Ltd.
- Norman, D. A. 1981. “Categorization of Action Slips.” Psychological Review 88 (1): 1–15. doi:10.1037/0033-295X.88.1.1.
- Parker, D., J. T. Reason, A. S. Manstead, and S. G. Stradling. 1995. “Driving Errors, Driving Violations and Accident Involvement.” Ergonomics 38 (5): 1036–1048. doi:10.1080/00140139508925170.
- Parkin, J., B. Clark, W. Clayton, M. Ricci, and G. Parkhurst. 2016. Understanding Interactions between Autonomous Vehicles and Other Road Users: A Literature Review. University of the West of England, Bristol. Available from: http://eprints.uwe.ac.uk/29153.
- Plant, K. L., and N. A. Stanton. 2013. “The Explanatory Power of Schema Theory: Theoretical Foundations and Future Applications in Ergonomics.” Ergonomics 56 (1): 1–15. doi:10.1080/00140139.2012.736542.
- Pollanen, E., G. J. M. Read, B. Lane, J. Thompson, and P. Salmon. 2020. “Who is to Blame for Crashes Involving Autonomous Vehicles? Exploring Blame Attribution across the Road Transport System.” Ergonomics. Advance online publication.
- PTV Group. 2020. “VISSIM.” Accessed 1 September 2019. http://vision-traffic.ptvgroup.com/en-us/home/
- Pucher, J., J. Dill, and S. Handy. 2010. “Infrastructure, Programs, and Policies to Increase Bicycling: An International Review.” Preventive Medicine 50 (1): S106–S125. doi:10.1016/j.ypmed.2009.07.028.
- Rescorla, R. A., and A. R. Wagner. 1972. “A Theory of Pavlovian Conditioning: Variations in the Effectiveness of Reinforcement and Nonreinforcement.” Classical Conditioning II: Current Research and Theory 2: 64–99.
- Reynolds, C. C., M. A. Harris, K. Teschke, P. A. Cripton, and M. Winters. 2009. “The Impact of Transportation Infrastructure on Bicycling Injuries and Crashes: A Review of the Literature.” Environmental Health 8 (1): 47. doi:10.1186/1476-069X-8-47.
- Salmon, P. M. 2019. “The Horse Has Bolted! Why Human Factors and Ergonomics Has to Catch up with Autonomous Vehicles (and Other Advanced Forms of Automation).” Ergonomics 62 (4): 502–504. doi:10.1080/00140139.2018.1563333.
- Salmon, P. M., M. G. Lenné, G. H. Walker, N. A. Stanton, and A. Filtness. 2014. “Exploring Schema-Driven Differences in Situation Awareness between Road Users: An on-Road Study of Driver, Cyclist and Motorcyclist Situation Awareness.” Ergonomics 57 (2): 191–209. doi:10.1080/00140139.2013.867077.
- Salmon, P. M., R. McClure, and N. A. Stanton. 2012. “Road Transport in Drift? Applying Contemporary Systems Thinking to Road Safety.” Safety Science 50 (9): 1829–1838. doi:10.1016/j.ssci.2012.04.011.
- Salmon, P. M., and G. J. M. Read. 2019. “Many Model Thinking in Systems Ergonomics: A Case Study in Road Safety.” Ergonomics 62 (5): 612–628. doi:10.1080/00140139.2018.1550214.
- Stanton, N. A., and M. S. Young. 2005. “Driver Behaviour with Adaptive Cruise Control.” Ergonomics 48 (10): 1294–1313. doi:10.1080/00140130500252990.
- Stevenson, M., J. Thompson, T. H. de Sá, R. Ewing, D. Mohan, R. McClure, I. Roberts, G. Tiwari, B. Giles-Corti, X. Sun, M. Wallace, and J. Woodcock. 2016. “Land Use, Transport, and Population Health: Estimating the Health Benefits of Compact Cities.” The Lancet 388 (10062): 2925–2935. doi:10.1016/S0140-6736(16)30067-8.
- Thompson, J., M. Berk, M. O’Donnell, L. Stafford, and T. Nordfjaern. 2014. “Attributions of Responsibility and Recovery within a No-Fault Injury Compensation Scheme.” Rehabilitation Psychology 59 (3): 247–255. doi:10.1037/a0036543.
- Thompson, J., M. Berk, M. O’Donnell, L. Stafford, and T. Nordfjaern. 2015. “The Association between Attributions of Responsibility for Motor Vehicle Accidents and Patient Satisfaction: A Study within a No-Fault Injury Compensation System.” Clinical Rehabilitation 29 (5): 500–508. doi:10.1177/0269215514546009.
- Thompson, J., M. O’Donnell, L. Stafford, T. Nordfjaern, and M. Berk. 2014. “Association between Attributions of Responsibility for Motor Vehicle Crashes, Depressive Symptoms, and Return to Work.” Rehabilitation Psychology 59 (4): 376–385. doi:10.1037/rep0000012.
- Thompson, J., G. Savino, and M. Stevenson. 2016. “A Model of Behavioural Adaptation as a Contributor to the Safety-in-Numbers Effect for Cyclists.” Transportation Research Part A: Policy and Practice 85: 65–75. doi:10.1016/j.tra.2015.12.004.
- Waard, D. D. E., M. Jessurun, F. J. Steyvers, P. T. Reggatt, and K. A. Brookhuis. 1995. “Effect of Road Layout and Road Environment on Driving Performance, Drivers’ Physiology and Road Appreciation.” Ergonomics 38 (7): 1395–1407. doi:10.1080/00140139508925197.
- Wagenaar, W. A., and J. T. Reason. 1990. “Types and Tokens in Road Accident Causation.” Ergonomics 33 (10–11): 1365–1375. doi:10.1080/00140139008925338.
- Waldherr, A., and N. Wijermans. 2013. “Communicating Social Simulation Models to Sceptical Minds.” Journal of Artificial Societies and Social Simulation 16 (4): 13.
- Wilensky, U. 2016. “Netlogo Version 6.0 (Version 6.0). Il: Centre for Connected Learning and Computer-Based Modeling, Northwestern University.” Accessed 1 September 2019. ccl.northwestern.edu/netlogo
- Woodcock, J., O. H. Franco, N. Orsini, and I. Roberts. 2011. “Non-Vigorous Physical Activity and All-Cause Mortality: Systematic Review and Meta-Analysis of Cohort Studies.” International Journal of Epidemiology. 40 (1): 121–138. doi:10.1093/ije/dyq104.
- World Health Organization. 2018. Global Status Report on Road Safety 2018. Geneva, Switzerland: World Health Organization.
- Young, W., A. Sobhani, M. G. Lenné, and M. Sarvi. 2014. “Simulation of Safety: A Review of the State of the Art in Road Safety Simulation Modelling.” Accident Analysis & Prevention 66: 89–103. doi:10.1016/j.aap.2014.01.008.
