
Abstract
Locomotive engineers need to detect auditory warning signals for safe and effective job performance. We measured the levels and spectra of the warning signals and noises present in Dutch train cabins to evaluate the effectiveness of these signals. Audio-recordings were made in six train types during normal operation. Signal detectability was estimated using the Detectsound software and compared against ISO 7731. Signal detectability was also measured in six normally-hearing individuals in a laboratory setting. Signal levels ranged between 68 and 84 dBA. Noise levels ranged between 53 and 77 dBA. The acoustical requirements for signal detectability were not met in multiple driving conditions, especially at higher speed. Sufficient signal-to-noise ratio’s were achieved in the laboratory measurements, but difficulties can be expected in unfavourable driving situations or when the engineer suffers from hearing loss. Acoustical, environmental, or work modifications might be required to prevent situations with insufficient audibility in hearing-impaired engineers.
Practitioner summary: The audibility of the warning signals in Dutch trains was evaluated by comparing signal and noise spectra. The results showed that sufficient audibility is not always guaranteed. Under laboratory conditions, normally-hearing individuals could compensate for the suboptimal acoustic circumstances, but acoustical, environmental, or work modifications might be required to prevent situations with insufficient audibility in hearing-impaired engineers.
Introduction
In many occupations, employees fulfil auditory tasks, such as speech communication and sound detection (Semeraro et al. Citation2015). This can be very challenging in some working settings, for example when high noise levels are present (Giguere et al. Citation2008). For locomotive engineers (train drivers), speech communication and sound detection are important for safe and effective job performance (Zoer, Sluiter, and Frings-Dresen Citation2014). An engineer needs to communicate to the signaller, conductor, and others by answering calls, making announcements, and using communication equipment. Detection of warning signals is required to be warned in case of events that can compromise safety (Zheng et al. Citation2007). The signals aim to alert the driver at passing a sign and to verify whether the engineer is still alert for safe driving (Fenner Citation2002; Scaccabarozzi et al., Citation2017). In Dutch train cabins, the Automatic Train Protection (ATP) system applies a bell-like signal combined with a warning light in the console in case of failure to stop for a stop signal, failure to reduce speed at a caution signal, or failure to comply to the local speed limit. The Driver’s Safety Device (DSD), also known as “the dead man’s switch,” produces a buzzer-type auditory warning and is a fail-safe in case the driver becomes incapacitated.
Earlier, the appropriateness of the sound environment of Dutch locomotive cabins for speech communication was assessed, using the Speech Transmission Index (STI) (Houben, Sorgdrager, and Dreschler Citation2007). The STI values were 0.69 for communication using a transceiver and 0.76 for communication using a mobile phone, exceeding the value of 0.5 that is required for acceptable speech communication. It was concluded that the working environment of Dutch locomotive cabins meets the acoustic standards for speech communication. The appropriateness of the acoustic environment of Dutch locomotive cabins for warning signal detection has not yet been investigated, despite its importance for safe and effective job performance. Failure to detect the warning signals will result in decreased safety and decreased operational effectiveness (Semeraro et al. Citation2015; Merat et al. Citation2002). If the DSD or ATP signal is missed, the emergency breaking system will automatically reduce speed or bring the train to a full stop.
To guarantee that a locomotive engineer is capable of performing the required auditory tasks, pure tone audiometry is applied prior to employment as well as on a periodical basis (Tufts, Vasil, and Briggs Citation2009). In this study, normal hearing is defined as having hearing thresholds between 1000 Hz and 4000 Hz below 25 dB HL, because an engineer passes the hearing screening without being referred for additional hearing assessments when hearing thresholds are measured at 25 dB HL or lower on the frequencies 1000, 2000, and 4000 Hz at the better ear. When a driver passes the hearing screening, sufficient hearing for safe and effective job performance is concluded. It is thus assumed that train drivers with hearing thresholds below 25 dB Hearing Level (HL) are capable of signal detection in the train cabin. This assumption has not yet been validated.
To evaluate the detectability of warning signals in a specific work-setting, the signal level should be taken into account (Edworthy Citation1994; Giguère et al., Citation2008). If the signal level is too low, the warning signal cannot attract proper attention. According to ISO 7731, a warning signal level is advised to be at least 65 dBA to ensure audibility (ISO Citation2003). If the level is too high, the sound can be distracting, can hinder speech communication, or even can cause startle reactions (Edworthy Citation1994; Giguère et al., Citation2008). ISO 7731 therefore states that the maximum sound level of a warning signal should not exceed 118 dBA (ISO Citation2003). Additionally, the background noise at each workplace should be taken into account, including the level, spectrum, and type of the noise (Edworthy Citation1994; Giguère et al., Citation2008). A train cabin is a noisy working environment with A-weighted estimated noise levels between 70 and 93 dBA (Lie et al. Citation2013; Peng et al. Citation2019). Driving speed can influence the ambient noise level, since the overall exterior sound emission increases with driving speed and several of the internal noise sources depend on driving speed, such as the motor and cooling ventilator (Kurze, Diehl, and Weißenberger Citation2000; Pronello Citation2003). Noise levels have been shown to differ between Italian train types (Pronello Citation2003), but this has not yet been investigated for Dutch trains. Furthermore, it is unknown if the effect of driving speed on the noise level is similar in different train types.
Computerised tools have been developed to model the expected signal detectability in a specific work setting (Giguère et al., Citation2008). These models are often based on masked thresholds, defined as the signal level that is just detectible in the presence of the workplace noise (Zheng et al. Citation2007; Giguère et al., Citation2008). In accordance with ISO 7731, a signal level of 10–15 dB above masked threshold has been proposed to warrant signal detectability (ISO Citation2003; Laroche et al. Citation1992). There is no model available yet that computes the detectability of the warning signal in the work situation of Dutch locomotive engineers. We therefore aim to specify the acoustic characteristics of the warning signals and the noise levels present in Dutch train cabins and to evaluate the effectiveness of these warning signals when presented to normal hearing locomotive engineers.
Materials and methods
This study comprises a cross-sectional and observational design. Acoustical measures were carried out to obtain the level and spectrum of the warning signals and the ambient noise in different Dutch locomotive cabins.
Setting
The measurements took place from April 2006 to March 2007. Six types of trains were included, specifically: Materieel64 (Mat’64), Locomotief1800 (Loc1800), Sprinter, Motorrijtuig DubbelDeks Materieel (mDDm), InterCity Materieel (ICM), and Verlengd InterRegio Materieel (V-IRM). All trains had electric engines and were exclusively used for conveyance of passengers. For each train type, measurements were performed in two or three different trains with a different locomotive engineer operating within the standard schedule. To avoid possible bias of too low or too high accelerations, the engineers were told that the sound measurements would be used to investigate the audibility of warning signals and not to judge their driving skills or sound exposure. The railroad tracks were selected to be representative for the Netherlands and thus did not contain hills. The train speed at which was measured depended on the railroad tracks that were selected. Since the highest noise levels were expected at maximum speed, at least two measurements were performed at maximum speed in each of the train types. The maximum speed is 120 kilometres per hour (km/h) in the Sprinter and V-IRM, and 130 km/h in the other trains. The measurements were performed under dry weather conditions with a maximum wind speed of 35 km/h.
Acoustical measurements
The acoustical data were collected by sound recordings on digital tape. The on-site measurement set-up consisted of a calibrated sound level meter (B&K 2260 SLM with calibrator B&K 4230) connected to a portable Digital Audio Tape (DAT)-recorder (Tascam DAP). Prior, during, and after the on-site measurements, the recording system was calibrated and checked with a B&K Sound Calibrator Type 4231. The level of the calibration tone was recorded on the Tascam DAT recorder in the same way as the real measurements were made. This recorded calibration-tone was then used to determine the correct level of the DAT recordings during the off-line analysis. The acoustical data were digitally transferred to a computer that was connected to an Echo Gina 24/96 sound card. A-weighting and octave band filtering were applied in compliance with respectively IEC 61260 Class 1 and IEC 61260 (Couvreur C. Octave Citation1997). The DSD and ATP signals were measured in all trains. If adjustable, the volume setting of the warning signal was set at maximum. The DSD signal was measured in quiet. The ATP signal does not occur in quiet and was therefore measured at the lowest speed at which the signal occurs. Unlike the DSD, the ATP signal decays over time. The ATP recordings were therefore averaged over the first 200 milliseconds after onset. This duration roughly corresponds to the human integration time for tonal signals (Viemeister Citation1996).
Laboratory measurements
Six subjects (one male; five female) took part in the laboratory measurements. The detectability of the DSD and ATP signal was assessed in the ambient noise of six train types. All participants had normal hearing, defined by pure-tone detection thresholds from 250 to 8000 Hz via air conduction below 25 dB HL. Prior to taking part in the study, informed consent was provided.
A stepwise two-alternative forced choice adaptive approach was used to determine the Signal-to-Noise Ratio (SNR) at which 50% of the warning signals can be detected. We will refer to this outcome measure as the SNR50. The noise level was fixed at a presentation level that corresponds with the real-live noise level at the train’s maximum speed. The signal level varied and started at a level of 30 dB Sound Pressure Level (SPL) above the expected SNR50. After each correct response, the signal level decreased with a step size of 4 dB SPL until the individual failed to detect the signal correctly. Then, the signal level increased again and followed a one-up one-down procedure with a 2 dB stepsize. The test was continued until five reversals were obtained. The test was programmed in Matlab (The Mathworks, 2005).
The detection test was performed in a sound-isolated booth in a free field setting. The individual was sitting in a chair in the middle of the booth and was surrounded by six omnidirectional speakers at 0, 45, 80, 180, 280, and 315 degrees, and a subwoofer. All subjects were instructed to push the button when a signal was heard, even if the signal was very soft. All individuals completed the test twelve times, since the SNR50 was determined for the DSD and ATP signal separately in the ambient noises of six train types. The testing order of the noises and warning signals was counterbalanced across subjects.
Statistical analyses
The acoustical measurements were analysed in in Matlab with the Statistical Toolbox (The Mathworks, 2005) and with Statistica (StatSoft, 2009). Descriptive statistics were calculated for the level and spectrum of the warning signals and the noise field, as well as for the laboratory measurements. For all train types, octave band spectra in dB SPL as well as the A-weighted equivalent sound pressure level in dBA (LAeq) were presented when driving 80 km/h, 100 km/h and when driving at maximum speed. Differences in ambient noise levels between the train types were investigated using a repeated measures analysis with train type, driving speed, and the interaction between train type and driving speed as independent variables. This analysis was performed with the Statistical Package for Social Sciences (SPSS) version 25.0 (Armonk New York USA).
The detectability of the DSD and ATP signal was estimated with the Detectsound software (Zheng et al. Citation2003) that has been developed to evaluate the efficacy of auditory warning signals in noisy workplaces (Laroche et al. Citation1991). Using this software, the detectability of acoustic warning signals in real-life conditions can be predicted. A validation study has revealed that the mean error in estimating detection thresholds in continuous noise fields is typically within 1 dB with a standard deviation of less than 2.5 dB (Zheng et al. Citation2007). To run Detectsound, the acoustic characteristics of the ambient noise at the workplaces and the warning signals should be obtained in 1/3 octave band levels from 125 to 1,25,000 Hz (Laroche et al. Citation1991). Warning-signal detectability is predicted for each workplace by comparing the spectral content of the warning signal with the predicted optimal range, also known as “the design window.” Therefore, the masked detection threshold is calculated according to the acoustical characteristics of the noise and the hearing status of the receivers (Zheng et al. Citation2003; Proulx, Laroche, and Latour Citation1996). In ISO 7731, a signal level is proposed of 10–15 dB above the masked threshold, and a warning signal is advised to have signal components in the range of 500–2500 Hz (ISO Citation2003). In line with these recommendations, the lower and upper limit of the design window are respectively 12 and 25 dB above the masked detection threshold for the detection of the warning sound in the given noise field in frequencies ranging from 125 to 3150 Hz (Zheng et al. Citation2003). In ISO 7731, it is proposed that at least one spectral component should reach the design window (ISO Citation2003), but several authors have suggested that more than one component is required to account for the common fluctuations in background noise of many workplaces (Zheng et al. Citation2007; Laroche et al. Citation1999; Patterson Citation1990; Hung and Hétu Citation1996; Hetu Citation1996). The advised number of spectral components required varies from three to four. We consider the spectral requirements for audibility met, when the warning signal has a minimum of three spectral elements (spectral levels measured in 1/3 octave bands) within the design window.
Results
Descriptives
Warning signal
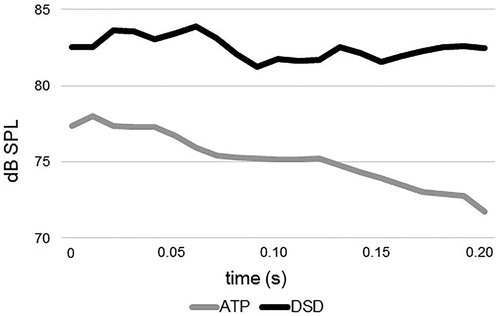
An overview of the level and spectrum of the DSD and ATP signal is presented in . The LAeq varies between the train types from 71.7 to 84.2 dBA for the DSD signal and from 68.2 dBA to 81.5 dBA for the ATP signal. The level of the DSD signal remains relatively constant over time, whereas the level of the ATP signal decreases (). The high frequency components of the ATP signal are about 4.5 dB higher at onset than the average level that was used in the calculations.
Figure 1. Octave-band spectra in dB SPL of the dead man’s switch and automatic train protection system in six Dutch train types. Additionally, the A-weighted equivalent sound pressure levels are shown. Two line graphs plotting the spectrum of the auditory warning signals present in Dutch train cabins
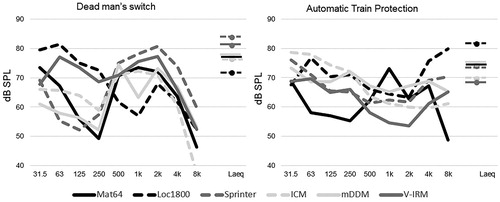
Figure 2. Decay in sound pressure level in dB SPL for ATP and DSD measured in Mat64. The ATP signal was filtered with a high-pass filter and a cut-off frequency of 400 Hz. Line graph plotting the decay in sound pressure level for the DSD and the ATP signal in 0.2 seconds. Unlike the level of the DSD signal, the level of the ATP signal decreases.
Noise-field
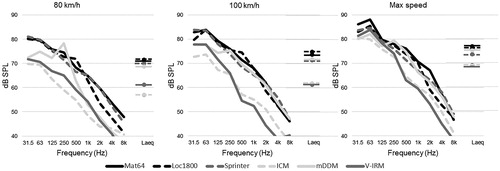
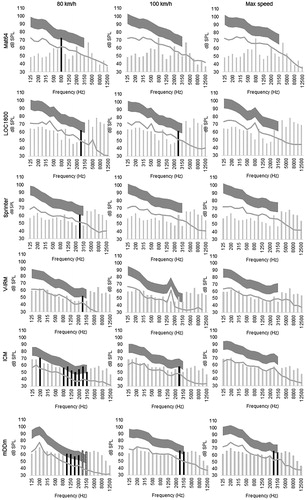
In total, 63 noise field measurements took place in 14 different trains with driving speed ranging from 40 to 130 km/h. The noise can be regarded as continuous noise. presents for each of the six train types the mean octave-band spectra and the mean LAeq of the background noise for the driving speeds 80 km/h, 100 km/h and for the maximum speed. When driving at 80 km/h, measured LAeq values range from 57.0 to 70.3 dBA. When driving at maximum speed, LAeq values range from 67.3 to 77.1 dBA. The differences in LAeq between the three driving speeds differ between the train types and this speed dependence is the largest in the ICM and the smallest in the Sprinter. No obvious changes in spectrum are observed when increasing the driving speed, except in the mDDm. When driving 100 or 130 km/h rather than 80 km/h, higher spectral noise levels were observed between 1 and 8 kHz. The results of the generalised linear model show that LAeq varies significantly between the different train types (df = 5, F = 29.70, p < .001) and driving speeds (df = 11, F = 6.80, p < .001). Additionally, the interaction term is significant (df = 18, F = 2.16, p = .032), which indicates that the effect of speed depends on the train type. The post-hoc tests reveal that three pairs of trains do not differ significantly from each other, specifically Loc1800 & Mat64, Mat64 & Sprinter, and ICM & V-IRM. The LAeq of Loc1800, Mat64, and the Sprinter are significantly higher than the LAeq of the ICM and the V-IRM. The LAeq of the Loc1800, is significantly higher than the LAeq of the Sprinter. Since LAeq significantly differs between the train types, we will evaluate the signal detectability of the different trains separately.
Figure 3. Octave-band spectra in dB SPL of the ambient noise field in six Dutch train types when driving at 80 km/h, 100 km/h, and when driving at maximum speed: 120 km/h for Sprinter and V-IRM and 130 km/h for the other trains. Additionally, the A-weighted equivalent sound pressure levels are shown. Three line graphs displaying the level and the spectrum of the ambient noise in six Dutch train types when driving at different speeds. At higher speed, higher noise levels are observed.
Estimation of signal detectability
DSD
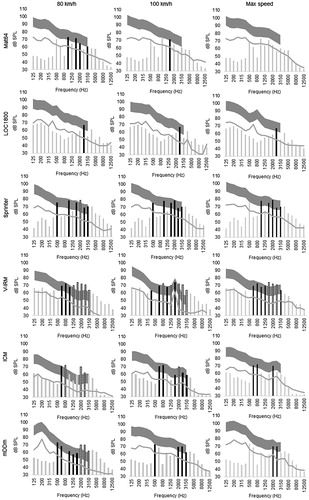
The results of the Detectsound model predictions for the DSD signal are presented in . At least three spectral elements are observed within the design window in five of the six train types when driving at 80 km/h, in four of the six train types with a driving speed of 100 km/h, and in three of the six train types when driving at maximum speed. Spectral elements exceeding the design window are observed in four train types when driving 80 km/h, in two train types with a driving speed of 100 km/h and in one train type when driving 80 km/h. The signal peaks exceeded the design window at all driving speeds in the V-IRM. For the other train types, the outcome of the Detectsound model varied between the different driving speeds.
Figure 4. Output of the Detectsound software modelling the predicted detectability of the DSD signal in six Dutch train types when driving at 80 km/h, 100 km/h, and when driving at maximum speed. Spectral elements that fall within the design window are black and spectral elements that exceed the design window contain stripes. Eighteen bar-line graphs plotting the predicted detectability of the DSD signal in six Dutch train types driving at three different speeds.
ATP
The results of the Detectsound model predictions for the ATP signal are visualised in . At least three spectral elements are observed within the design window in two of the six train types when driving 80 km/h, specifically the ICM and mDDm. None of the model predictions at a higher driving speed resulted in at least three spectral elements within the design window. Except from in the mDDm with a driving speed of 80 km/h, no signal peaks are observed exceeding the design window.
Figure 5. Output of the Detectsound software modelling the predicted detectability of the ATP signal in six Dutch train types when driving at 80 km/h, 100 km/h, and when driving at maximum speed. Spectral elements that fall within the design window are black and spectral elements that exceed the design window contain stripes. Eighteen bar-line graphs plotting the predicted detectability of the ATP signal in six Dutch train types driving at three different speeds.
Signal detectability in a laboratory setting
All subjects completed the experiment. There was no missing data. The A-weighted SNR50 for the DSD and ATP signal in the background noises of the six train types are expressed in dB SNR in . For detecting the DSD signal, the SNR50 ranged from −32.8 to −23.4 dB SNR. For detecting the ATP signal, the SNR50 ranged from − 47.4 to −25.0 dB SNR. Except for one train type, the SNR50 was lower for detecting the ATP signal compared to the DSD signal.
Table 1. Mean A-weighted signal-to-noise ratio’s at which 50% of the warning signals were detected correctly by 6 normally hearing individuals.
Discussion
This study examined the acoustic characteristics of the warning signals and the ambient noise in Dutch train cabins to evaluate the effectiveness of these warning signals when presented to normal hearing locomotive engineers. The DSD and ATP signal were shown to have different acoustic characteristics and the ambient noise levels depended on train type and driving speed. Although the DSD and ATP signals both contained more sound energy than the background noise, the model predictions indicated that the detectability of the signals was critical in a number of conditions.
The levels of the warning signals were - in accordance with the advice in ISO 7731 – larger than 65 dBA and softer than 118 dBA. A spectral analysis indicated that the measured DSD signals did adhere to the ISO requirements, but the ATP signals did not, because most sound energy was measured above 4000 Hz. The measured intensity of the background noise varied from 53.2 to 77.1 dBA. This is roughly in line with an earlier study that reported maximum noise exposure levels between 70 and 80 dBA for locomotive engineers in Norway (Lie et al. Citation2013). Higher maximum noise levels were measured in Chinese trains, varying from 88 to 93 dBA (Peng et al. Citation2019). The significant effect of train type and driving speed on the noise level confirmed the results of Kurze et al. (Citation2000) and Pronello (Citation2003).
According to ISO 7731, warning signals will be clearly detectable by normal hearing employees if the signal energy in one or more 1/3 octave bands is more than 13 dB higher than the effective-masked-threshold (ISO Citation2003). The Detectsound analysis showed that this criterion is fulfilled for the DSD signal in all trains, except for the Mat64 when driving at maximum speed. For the ATP, this criterion is not fulfilled in most trains when driving at maximum speed. The ISO method only takes into account the highest signal component and ignores other spectral components. Using the Detectsound criterion of having at least three signal peaks within the design window for detection, we anticipated on the fact that detection of tonal signals may be better when multiple spectral peaks are more than 13 dB higher than the effective-masked-threshold (Edworthy Citation1994).
The lack of spectral elements within the design window does not necessarily mean that the signal is inaudible, which is shown by the results of the laboratory measurements. The SNR50 varied from −23.4 to -47.4 dB SNR, indicating that the warning signals remain audible when adjusted at levels significantly below the level of the background noise. Contrary to the Detectsound analysis, the outcomes of the laboratory measurements were more favourable for the ATP signal than for the DSD signal in most trains. A reason might be that we averaged the ATP measurements over the first 200 ms, although the sound level of the ATP signal decays over time. The higher onset of the ATP signal might result in better signal detectability than the analysis of the short-time averaged level suggests. Another explanation is that Detectsound may underestimate signal detectability when signal peaks are present at higher frequencies. According to ISO 7731, it is advised to include warning signals with signal components in the range of 500 to 2500 Hz when designing a warning signal (ISO Citation2003). In line with this recommendation, the Detectsound model does not take spectral elements above 3100 Hz into account, anticipating on employees with high-frequency hearing loss due to presbyacusis and/or noise exposure (Giguère et al., Citation2008). For the DSD signal, the prominent signal peaks were present between 500 and 4000 Hz and thus fall mostly within the spectrum of the design window. Contrary, the most prominent peaks of the ATP signal were present between 4000 and 8000 Hz.
In this study, we focussed on the spectral elements of the warning signals, although the temporal structure of a warning signal can influence detectability (Misdariis et al., Citation2013). We observed distinctive differences in temporal characteristics between the two warning signals. The ATP signal decays over time and the DSD signal does not, which might facilitate discrimination between the two signals (Edworthy Citation1994; Graham Citation1999). Moreover, the ATP signal is presented once if a change in speed is required and three times when the change in speed is accomplished. If the maximum speed is exceeded, the ATP is presented with a longer duration of approximately three seconds. The ATP signal might be easier to detect if it is presented three times or with a longer duration. However, a detailed analysis of the temporal structure of the warning signals was beyond the scope of this study.
Some study limitations need to be mentioned. First, the criteria from the Detectsound model and the ISO are based on warning signals that can occur unexpectedly. In a train cabin, the auditory signals occur often and are thus expected and very well-known by the driver. However, because it is vital that a locomotive engineer does not miss these warning signals, even in very tense situations, the detection models used are deemed relevant. Second, since the acoustical measurements took place in 2006 and 2007, the measurements in this study do not cover all train types that are currently in use. Also, all Mat64s have been decommissioned in 2016. The result that the detectability of the DSD and ATP signal was critical in the Mat64 is therefore less relevant for current practice. The train equipment of the included trains has not changed, with the exception that it used to be possible to open the window in some locomotive cabins, but at present these windows cannot be opened anymore. This does not influence the applicability of our results, since all measurements were performed with closed windows. Third, the experimental design did not allow full control over the selection of the railway tracks. Consequently, the number of measurements and the measured driving speed differed between the train types. Fourth, it is not possible to use these measurements to obtain an accurate estimate of the daily noise exposure of locomotive engineers. However, since the average measured sound levels were much lower than 80 dBA, it is reasonable to assume that prolonged driving on these trains does not exceed the current Dutch and European first action level of 80 dBA averaged over an eight-hour shift (STB10053, 2006; Directive 2003/10/EC).
The large differences in predicted signal detectability between different driving situations suggest that it is important to take different driving situations into account when evaluating signal detectability inside a train cabin. Having high enough signal levels to ensure good signal detectability at maximum speed can imply that signals are too loud at lower speed rates. Warning signals that automatically adjust their level according to the background noise may therefore be warranted. Also, it is important to not only focus on detectability, but also evaluate the subjective experience of locomotive engineers. A signal with good audibility at high driving speed, may be experienced as annoying at a lower speed. Although it is likely that the results of this study reflect the real-life working situation of Dutch locomotive engineers, situations may occur in daily practice that make signal detection even harder. For example higher noise levels have been associated with passing vehicles at station platforms (Neitzel et al. Citation2009) and with crossing a tunnel (Dinno, Powell, and King Citation2011; Phan and Jones Citation2017). Since the underlying physical mechanism for detecting an alarm in noise might depend on the SNR (Karunarathne et al. Citation2018), we need to be careful with generalizing the results to other SNR’s.
Contrary to an earlier study that assessed the acoustic requirements for speech communication in Dutch train cabins (Houben, Sorgdrager, and Dreschler Citation2007), we found that the acoustic requirements for warning signal detectability were not always met. Thus, the fact that a workplace fulfils the acoustic conditions for speech communication, does not necessarily mean that the conditions for another hearing critical task, detecting warning signals, are also fulfilled. This stresses the importance of evaluating the acoustical requirements for different hearing critical jobs separately. By assessing the acoustical requirements in multiple work-settings, the work settings can be identified in which performance of the hearing critical job is the most critical. This has the advantage that acoustical or environmental work modifications can then be undertaken to ensure safe and effective job performance in all work settings. Further, identification of the most hearing critical work situations is useful for designing auditory fitness for job assessments. If an employee is capable of fulfilling an auditory task sufficiently in the most unfavourable acoustic environment, it is likely that the same task will also be successfully fulfilled in a less noisy environment. This method could be used to assess multiple workplaces in which hearing critical jobs are performed, such as the workplace of police officers, firefighters, and coast guard employees.
This research revealed that the noise levels in Dutch train cabins range between 53.2 and 77.1 dBA, depending on the train type and driving speed. Although the levels of the auditory warning signals are higher than the background noise levels, the acoustical requirements for signal detectability were not met in multiple driving conditions, especially at higher speed. Normally hearing subjects who can make use of high frequency signal peaks were able to compensate for the suboptimal acoustic conditions, but difficulties can be expected in unfavourable driving situations or when the engineer suffers from hearing loss. To ensure safe and effective job performance in all driving situations, the detectability of warning signals in Dutch train cabins warrants further attention, particularly when hearing loss is present. Acoustical, environmental or work modifications might be required to prevent situations with insufficient audibility in hearing-impaired engineers.
Acknowledgment
No external funding was received for this study.
Disclosure statement
No potential conflict of interest was reported by the author(s).
References
- Couvreur C. Octave. 1997. “Matlab toolbox, available at MathWorks File Exchange central.” http://www.mathworkscom/matlabcentral/fileexchange.
- Dinno, A., C. Powell, and MM. King. 2011. “A Study of Riders' Noise Exposure on Bay Area Rapid Transit Trains.” Journal of Urban Health: Bulletin of the New York Academy of Medicine 88 (1): 1–13. doi:10.1007/s11524-010-9501-1.
- Edworthy, J. 1994. “The Design and Implementation of Non-Verbal Auditory Warnings.” Applied Ergonomics 25 (4): 202–210. doi:10.1016/0003-6870(94)90001-9.
- Fenner, D. 2002. “Train Protection.” IEE Review 48 (5): 29–33. doi:10.1049/ir:20020504.
- Giguère C, Laroche C, Al Osman R, Zheng Y, editors. 2008. “Optimal installation of audible warning systems in the noisy workplace.” Proceedings of the 9th International Congress on Noise as a Public Health Problem (ICBEN). Dortmund, Germany.
- Giguere, C., C. Laroche, SD. Soli, and V. Vaillancourt. 2008. “Functionally-Based Screening Criteria for Hearing-Critical Jobs Based on the Hearing in Noise Test.” International Journal of Audiology 47 (6): 319–328. doi:10.1080/14992020801894824.
- Graham, R. 1999. “Use of Auditory Icons as Emergency Warnings: evaluation within a Vehicle Collision Avoidance Application.” Ergonomics 42 (9): 1233–1248. doi:10.1080/001401399185108.
- Hetu, R. 1996. “La Planification de la Signalisation Acoustique en Milieu Industriel: critères de Conception Des Avertisseurs Sonores de Danger.” Canadian Acoustics 24: 3–18.
- Houben, R., B. Sorgdrager, and W. A. Dreschler. 2007. Lawaaibelasting en auditief functioneren van machinisten. Expertise Centrum Gehoor & Arbeid. Report No. https://pure.amc.nl/en/publications/lawaaibelasting-en-auditief-functioneren-van-machinisten(749e6c99-c3fa-40d4-9ea9-5e0c345eba16)/export.html.
- Hung, TQ., and R. Hétu. 1996. “A Plan for Acoustic Signalling in Industrial Areas-Criteria for the Design of Warning Signals.” Canadian Acoustics 24 (2): 3–17.
- ISO. 2003. Ergonomics–Danger Signals for Public and Work Areas–Auditory Danger Signals. Geneva: International Organization for Standardization.
- Karunarathne, B., T. Wang, RH. So, AC. Kam, and R. Meddis. 2018. “Adversarial Relationship between Combined Medial Olivocochlear (MOC) and Middle-Ear-Muscle (MEM) Reflexes and Alarm-in-Noise Detection Thresholds under Negative Signal-to-Noise Ratios (SNRs).” Hearing Research 367: 124–128. doi:10.1016/j.heares.2018.07.013.
- Kurze, U., R. Diehl, and W. Weißenberger. 2000. “Sound Emission Limits for Rail Vehicles.” Journal of Sound and Vibration 231 (3): 497–504. doi:10.1006/jsvi.1999.2538.
- Laroche, C., HT. Quoc, R. Hétu, and S. McDuff. 1991. “Detectsound’: A Computerized Model for Predicting the Detectability of Warning Signals in Noisy Workplaces.” Applied Acoustics 32 (3): 193–214. doi:10.1016/0003-682X(91)90003-W.
- Laroche, C., M. Hodgson, L. Ritmiller, and S. Forshaw. 1999. “Audibility of Signals and Alarms in a Coast Guard Environment.” Canadian Acoustics 27 (3): 114–115.
- Laroche, C., R. Hétu, T. Hung, and J-M. Rouffet. 1992. “DETECTSOUND'anddBOHS': A Software Package for the Analysis of Health and Safety in Noisy Workplaces.” Canadian Acoustics 20 (3): 39–40.
- Lie, A., M. Skogstad, T. Johnsen, B. Engdahl, and K. Tambs. 2013. “Hearing Status among Norwegian Train Drivers and Train Conductors.” Occupational Medicine 63 (8): 544–548. doi:10.1093/occmed/kqt114.
- Merat, N., A. Mills, M. Bradshaw, J. Everatt, and J. Groeger. 2002. “Allocation of Attention among Train Drivers.” Contemporary Ergonomics 6: 185–190.
- Misdariis N, Gruson A, Susini P, editors. 2013. “Detectability Study of Warning Signals in Urban Background Noises: A First Step for Designing the Sound of Electric Vehicles.” Proceedings of Meetings on Acoustics ICA2013; ASA. Montréal, Canada.
- Neitzel, R., RR. Gershon, M. Zeltser, A. Canton, and M. Akram. 2009. “Noise Levels Associated with New York City's Mass Transit Systems.” American Journal of Public Health 99 (8): 1393–1399. doi:10.2105/AJPH.2008.138297.
- Patterson, RD. 1990. “Auditory Warning Sounds in the Work Environment.” Philosophical Transactions of the Royal Society of London B, Biological Sciences 327 (1241): 485–492.
- Peng, Y., C. Fan, L. Hu, S. Peng, P. Xie, F. Wu, and S. Yi. 2019. “Tunnel Driving Occupational Environment and Hearing Loss in Train Drivers in China.” Occupational and Environmental Medicine 76 (2): 97–104. doi:10.1136/oemed-2018-105269.
- Phan, L. T., and R. M. Jones. 2017. “Chicago Transit Authority Train Noise Exposure.” Journal of Occupational and Environmental Hygiene 14 (6): D86–D91. doi:10.1080/15459624.2017.1285490.
- Pronello, C. 2003. “The Measurement of Train Noise: A Case Study in Northern Italy.” Transportation Research Part D: Transport and Environment 8 (2): 113–128. doi:10.1016/S1361-9209(02)00036-6.
- Proulx, G., C. Laroche, and J. Latour. 1996. “Audibility Problems with Fire Alarms in Apartment Buildings.” Journal of Safety Research 3 (27): 199.
- Scaccabarozzi, D, L. Mazzola, M. F. Bocciolone, F. Resta, and B. Saggin, editors. 2017. “Monitoring of Train Driver's Alertness: A Feasibility Study.” 2017 IEEE International Instrumentation and Measurement Technology Conference (I2MTC); IEEE. Turin, Italy.
- Semeraro, H. D., Z. L. Bevis, D. Rowan, R. M. van Besouw, and A. J. Allsopp. 2015. “Fit for the Frontline? Identification of Mission-Critical Auditory Tasks (MCATs) Carried out by Infantry and Combat-Support Personnel.” Noise & Health 17 (75): 98–107. doi:10.4103/1463-1741.153401.
- Tufts, J. B., K. A. Vasil, and S. Briggs. 2009. “Auditory Fitness for Duty: A Review.” Journal of the American Academy of Audiology 20 (9): 539–557. doi:10.3766/jaaa.20.9.3.
- Viemeister, N. 1996. “Auditory Temporal Integration: What is Being Accumulated?” Current Directions in Psychological Science 5 (1): 28–32. doi:10.1111/1467-8721.ep10772699.
- Zheng, Y., C. Giguère, C. Laroche, and C. Sabourin. 2003. “Detectsound Version 2: A Software Tool for Adjusting the Level and Spectrum of Acoustic Warning Signals.” Canadian Acoustics 31 (3): 76–77.
- Zheng, Y., C. Giguère, C. Laroche, C. Sabourin, A. Gagné, and M. Elyea. 2007. “A Psychoacoustical Model for Specifying the Level and Spectrum of Acoustic Warning Signals in the Workplace.” Journal of Occupational and Environmental Hygiene 4 (2): 87–98. doi:10.1080/15459620601115768.
- Zoer, I., JK. Sluiter, and MH. Frings-Dresen. 2014. “Psychological Work Characteristics, Psychological Workload and Associated Psychological and Cognitive Requirements of Train Drivers.” Ergonomics 57 (10): 1473–1487. doi:10.1080/00140139.2014.938130.
