
 ?Mathematical formulae have been encoded as MathML and are displayed in this HTML version using MathJax in order to improve their display. Uncheck the box to turn MathJax off. This feature requires Javascript. Click on a formula to zoom.
Abstract
As frequency and severity of heat waves are increasing, personal cooling systems are being considered as a tool to mitigate heat strain in workers in various occupational settings. This study assessed cooling capacities (C; W·h·m−2) of various commercially available vests using different cooling concepts. Measurements were conducted over 8 h in a climatic chamber (Ta: 35 °C, RH: 35 %) using a thermal manikin (Ts: 35 °C). Cooling power (P) and duration of efficient cooling (tc) determined the C value of each vest. Among the cooling concepts the active cooling vests were the most efficient, extracting 331 W·h·m−2, followed by the vests with phase change material (PCM) inserts, hybrid and evaporative vests, extracting a maximum of 164 W·h·m−2, 146 W·h·m−2 and 113 W·h·m−2, respectively. While some vests with PCM inserts provided intense but shorter cooling, evaporative vests provided mild but longer cooling throughout.
Practitioner summary: The study assessed the cooling capacity of commercially available vests, using a thermal manikin. The vests present an affordable solution in various occupational settings where air-conditioning is not an option. A range of cooling capacities among different cooling concepts and vests of the same category were noted.
Abbreviations: ACVs: air-cooled vests; LCVs: liquid-cooled vests; ECVs: evaporative cooling vests; HCVs: hybrid cooling vests; PCVs: phase-change cooling vests; PCM: phase change material; C: cooling capacity; Rt: thermal resistance; Re: evaporative resistance; Re (%): relative evaporative resistance; P: cooling power; Pmax: maximal cooling power; Pavg: average cooling power; tc: cooling duration; AUC: area under the curve; Ta: ambient temperature; RH: relative humidity; va: chamber air flow; Ts: manikin surface temperature
Introduction
Undeniably, global warming, a human-induced climate change outcome, is an issue of major concern facing our planet. Rising temperatures accompanied by increased frequency and duration of heat waves (Morabito et al. Citation2017; Pogačar et al. Citation2018) are expected to continue in the twenty-first century, with some regions suffering more than others. Europe is one of the regions (Giorgi and Lionello Citation2008) where the rising temperatures will detrimentally impact the health of the population, especially in occupational settings (Kjellstrom, Holmer, and Lemke Citation2009). Consequently, labour productivity could also suffer (Casanueva et al. Citation2020; Ciuha et al. Citation2019; Flouris et al. Citation2018). In the scope of the ongoing European Commission Horizon 2020 Heat-Shield project, several strategies for mitigating occupational heat stress are being evaluated. The project is primarily focussed on five European industries, including agriculture, construction, manufacturing, tourism and transportation, as these are the key industries, representing 40 % of the European gross domestic product (GDP) and employing over 50 % of its population (OECD Citation2017). In these industries the workforce is exposed either directly to the ambient conditions (agriculture, construction, tourism) or to other sources of heat (manufacturing, transportation), such as that generated by machinery. Common to all these industrial sectors is that the heat strain on the workers is augmented during periods of heat waves, due to exposure to increased ambient temperatures at work, coupled with the inability to recover from the work-induced heat strain at home (Ciuha et al. Citation2019). In many working scenarios, air-conditioning might not be an option (agriculture, construction, manufacturing), as it either does not provide sufficient cooling or it presents a substantial financial burden (manufacturing). As such, personal cooling strategies, including cooling vests, could provide an efficient and economically viable solution (Barwood, Newton and Tipton Citation2009; Bomalaski et al. Citation1995; Cadarette et al. Citation1990;Caldwell, Patterson, and Taylor Citation2012; Chinevere et al. Citation2008; Ciuha et al. Citation2016; McLellan, Frim, and Bell Citation1999; Shapiro et al. Citation1982; Yi, Zhao, and Chan Citation2017).
The use of cooling vests in thermally stressful environments has been the focus of many studies, including workers in contact with fire (Barr, Gregson, and Reilly Citation2010) or wearing protective clothing (Cadarette et al. Citation2006; McLellan, Frim, and Bell Citation1999). The functionality of such vests in industrial sectors is, however, poorly studied. There are no standards to which such vests should comply, nor is there a recommended testing strategy for evaluating the cooling power and operational time (i.e. cooling capacity) of commercially available cooling vests. Managers responsible for the safety and wellbeing of workers have no methods available with which to objectively compare cooling vests and thus be able to decide which would be the optimal solution for a specific type of work and working environment. Void of their cooling capacity, the material and design of a vest has an inherent resistance to the transfer of heat from the skin to the environment (thermal resistance), and represents a barrier for evaporation of sweat from the skin surface (evaporative resistance). Thus, an inefficient cooling vest can become a burden by adding an additional layer of insulation and a barrier for evaporation of sweat from the body. All vests will contribute such a burden once their cooling capacity is exhausted or impaired.
Currently, choosing an appropriate vest for a specific condition can be challenging, as there is a wide variety of cooling vest types available and the choice relies mainly on manufacturers’ descriptions of their products.
Cooling vests can be categorised according to the cooling concept used (Barwood et al. Citation2009; Craig and Moffitt Citation1974; Duffield et al. Citation2003; Mokhtari Yazdi and Sheikhzadeh Citation2014; Vernieuw, Stephenson, and Kolka Citation2007): air-cooled vests (ACVs), liquid-cooled vests (LCVs), evaporative cooling vests (ECVs), phase-change cooling vests (PCVs) and hybrid cooling vests (HCVs).
ACVs provide a constant flow of either ambient or compressed air into the vest’s microenvironment and thus promote heat dissipation by evaporation of sweat and convection. Consequently, their efficiency is affected by wetness of the skin and vapour pressure of the ambient air. ACVs allow a limited range of movement, if connected to a fixed source of air, or unlimited movement, if they incorporate a battery-powered fan. They can deliver air at either ambient temperature or cooled air, with former offering limited cooling in hot and humid conditions or while wearing personal protective clothing, due to restricted convective and evaporative heat loss. Furthermore, during the Covid-19 pandemic, the safety of using ACVs must also be considered, as the air being sucked from the ambient into the microenvironment and exiting at the neck and mouth can increase the risk of infection (e.g. health workers dealing with Covid-19 or Ebola patients), unless a highly efficient filter is used (Kuklane et al. Citation2015).
LCVs circulate cooled liquid, typically water, through small tubes embedded into the inner fabric layer of the vest, close to the skin. The water is pumped from a bladder or a container, stored either in the back pocket of the vest (portable) or in a dissociate unit/container (stationary).
ECVs require a wet surface of the vest, thus enhancing the evaporation from the surface of a vest or a shirt. Evaporative cooling at the surface of the vest presumably increases the temperature gradient between the skin surface and the surface of the vest, thus enhancing heat loss from the skin (Havenith et al. Citation2013).
PCVs incorporate inserts filled with a phase-change material (PCM) or gel, which changes its phase from solid to liquid when it absorbs heat, and from liquid to solid when it dissipates heat. The former physical mechanism is utilised to extract heat from the body primarily by conduction, making PCVs particularly beneficial in hot and humid environments and when worn underneath protective clothing, where evaporative and convective heat loss is not possible or restricted (Maley et al. Citation2020).
HCVs combine two or more of the cooling concepts described above.
In contrast to PCVs and ECVs, which have limited operational duration, ACVs connected to a fixed air source and LCVs provide unhindered and continuous cooling but require auxiliary equipment and a constant power source for their operation. Mobile ACVs and LCVs are, however, powered by a rechargeable battery, therefore their operational time is limited by the battery’s capacity.
PCVs and ECVs are thus classified as passive cooling garments, whereas ACVs and LCVs as active cooling garments.
The aim of this study was to evaluate the cooling capacity of various commercially available vests of different cooling concepts. The measurements were conducted in controlled ambient conditions inside a climatic chamber using a whole-body thermal manikin. Based on an extensive market analysis more than 80 different cooling vests were identified, reviewed, and classified according to the cooling concept used. Representative vests in each category were evaluated with the thermal manikin.
Methodology
Cooling vests
Based on a market analysis, typical cooling vests from each of the five categories shown in were included in this study.
Table 1. Basic information of the cooling vests, categorised according to the cooling concept used.
The thermal manikin
The Jozef Stefan Institute whole-body thermal manikin was used to evaluate the selected cooling vests. The manikin, made of aluminium, weighs 59.6 kg, and consists of 21 segments, of which 19 can be individually controlled. The total surface area of the manikin is 1.74 m2, whereas the total contact area (the area in contact with the clothing ensemble) is 1.58 m2. The torso is divided into two segments, front and back torso. The total surface area of the torso is 0.57 m2, and the total contact area is 0.54 m2. In the present evaluation, all manikin segments were heated, the head however served only as a heat guard and was therefore excluded from the calculations.
The cooling vests were tested in combination with a baseline clothing ensemble comprising: men’s boxer briefs (18 % spandex, 82 % polyester cationic; Kalenji, Decathlon, France), men’s long-sleeve T-shirt (100 % cotton; Adidas, Germany) and men’s trousers (100 % polyamide; Quechua, Decathlon, France). The sizes of the purchased cooling vests were determined based on recommendations, provided by the manufacturer. If needed, the snug fit of the vest was assured by using clips.
Experimental protocol
The emphasis of this study was on the evaluation of the cooling capacity (C) of the selected cooling vests. Duration of these measurements was tailored to the length of a standard 8-h workday. The aim was to assess both the continuous cooling power and the operational time of each cooling vest. In addition, standardised measurements of thermal (Rt) and evaporative resistances (Re) were also conducted. Before the C and Re experiments, the inactive cooling vests were stored in the climatic chamber (≥ 1 h) maintained at the same ambient conditions as that required during the experiments.
Cooling capacity (C)
Cooling power (P; W·m−2) and cooling duration (tc; min) of each cooling vest provided a value of the vest’s cooling capacity under given ambient conditions. During the assessment, ambient temperature (Ta) in the climatic chamber (Institut Zoran Rant d.o.o., Škofja Loka, Slovenia) was maintained at 35 °C, and relative humidity (RH) at 35 %. Air flow within the chamber (va) was 0.2 m·s−1. To eliminate the temperature gradient and heat transfer between the ambient and the manikin, the manikin surface temperature (Ts) was set at the same level as Ta (at 35 °C). Consequently, no heating was generated by the heaters in the manikin segments at baseline (P = 0 W·m−2). When an active cooling vest was donned on the pre-heated manikin, the decrease of the Ts activated the heaters to re-establish and maintain the set Ts. Once stabilised, the heat delivered by the heaters (P; W·m−2) to the surface area of the manikin segments covered by the cooling vest, equalled the heat extracted from the region by the cooling vest. P of the relevant segments was continuously monitored by bespoke software (MAK Elektronik, Medvode, Slovenia), with data sampled at 30 s intervals. When P reached 0 W·m−2, the cooling capacity of the vest at the given ambient condition was exhausted. To evaluate the cooling capacity of each vest, two 8-h long experiments were conducted with each vest to ensure repeatability of results (coefficient of variation < 10 %).
Thermal resistance (Rt)
The aim of the measurements was to evaluate the insulation of the vest when losing its cooling capacity. For this purpose, the vests were not activated during this assessment. In the climatic chamber Ta was set at 15 °C, RH at 50 % and va at 0.4 m·s−1. Once dressed, Ts was heated to 35 °C. These conditions established a temperature gradient and heat transfer between the manikin and the ambient. The Rt was determined based on the power, supplied to different manikin segments, once stabilised at 35 °C. Rt was calculated for the overall body for two conditions. In one condition the thermal manikin wore only the baseline clothing ensemble (Control), whereas in the second condition the cooling vest was added to the baseline clothing condition (Vest). The test could have been conducted using the torso segment of the manikin only, but the design of the vests was not the same, with some covering only a portion of the torso segment, and others overlapping with other segments. For this reason, it was decided to conduct the tests with the whole-body thermal manikin, evaluating the Rt of the clothing ensemble, which either included a vest, or not. The Rt of each cooling vest was expressed as a relative increase (%) compared to the Control condition. In this manner, we derived the magnitude of the increase in Rt that would occur once the cooling vest was no longer active. Thermal insulation (Rt; °C·m2·W−1) was calculated for each condition, and the Rt of each cooling vest expressed as an increase (%) relative to the control condition (manikin wearing only the baseline clothing ensemble). This analysis provided information of the relative amount of additional thermal insulation that would be provided by a cooling vest, once its cooling capacity was exhausted.
PCM and gel inserts were all thermally equilibrated to room temperature (22 °C) before the onset of each trial. The reason for this was to ensure the PCM inserts with melting points (Tm) at 15 °C and lower would be in the liquid (inactive) phase, when tested inside the chamber. IH vest was tested with PCM inserts having different Tm (IH 6.5, IH 15, IH 21 and IH 29). The Rt was, however, assessed only with PCM inserts with Tm of 15 °C (IH 15), identical to Ta. It was anticipated that the Rt for this specific vest would be identical in combination with PCM inserts with other Tm (IH 6.5, IH 21, IH 29), if tested at Ta, equal to their Tm (Zhao et al. Citation2013).
For each cooling vest three 30-min measurements were conducted to ensure repeatability of results (coefficient of variation < 10 %). To determine the Rt of each cooling vest, the serial method as surface area-weighted thermal insulation (ISO Citation2004) was used:
(1)
(1)
(2)
(2)
Rt: total Rt of the clothing ensemble with the stationary manikin (°C·m2·W−1); fi: fraction of the total manikin surface area presented by the surface area of segment i; Tsi: skin surface temperature of the body segment i of the manikin (°C); Ta: air temperature within the climatic chamber (°C); ai: surface area of the body segment i of the manikin (m2); Pi: heating power supplied to the body segment i of the manikin (W); A: total body surface area of the manikin (m2).
Relative evaporative resistance (Re; %)
The test of evaporative resistance (Re) determines the hindrance to the evaporation of sweat imposed by a clothing ensemble. To simulate sweating with the thermal manikin, a whole-body skin-tight suit (defined as ‘skin’ in the text) was used. The skin was custom made to fit the manikin tightly, covering the entire body, except the head (material: 100 % sport lycra, dry weight: 277 g). Re was determined as evaporative rate from the skin (g·h−1), expressed relative to the control condition (Re; %). Due to different cooling concepts evaluated in the study, the usage of standardised Re methods (Wang et al. Citation2011) would be challenging, particularly when determining the water vapour pressure of the wet skin combined with evaporative vests containing water. To provide an accurate comparison between different cooling vests, a simplified method based on various mass loss observations was used.
During the assessment, Ta was set at 35 °C, RH at 35 % and va at 0.2 m·s−1. Ts was maintained at 35 °C to ensure equilibrium between the manikin and the ambient, with the only heat transfer provided by evaporation from the wet skin.
Before each experiment, the skin was pre-wetted in water, equilibrated at 35 °C inside the chamber. It was then centrifuged in a washing machine for 3 min (Electrolux Intuition, Stockholm, Sweden) to remove the excess water evenly throughout the fabric. The starting weight of the skin was targeted at 530 – 535 g (191 – 193 % of its dry weight). Each vest required a specific protocol of activation (see section Activation protocol). The starting weights of the wet skin and the evaporative vests were measured using a weight scale (UWE HGM-4000, Universal Weight Enterprises, Taiwan). All clothing items, including the dry baseline clothing ensemble, were then donned on the pre-heated manikin and the experiment started.
The clothed manikin was suspended from a force transducer (Libela-Elsi, TPT 5 N, Slovenia) situated on a frame. The weight of the manikin was continuously monitored throughout the experiment, with data sampled at 15 s intervals. The mass loss of the clothed manikin with the wetted skin layer reflected the evaporation of water from the manikin’s skin. In the control condition, the loss of mass was derived with the manikin wearing the baseline clothing ensemble combined with the wet skin (ṁcontrol, g·h−1), whereas in the experimental conditions an activated cooling vest was donned as the outermost layer. For each condition, the loss of mass was observed over 60-min trials, repeated three times to ensure repeatability of the results (coefficient of variation < 10 %).
As various cooling concepts were evaluated in this study, some introducing an additional wet layer for water to evaporate from, determining the mass of water evaporating from each clothing layer was not feasible. Therefore, the mass of water that was restricted from evaporating (ṁr, g·h−1) from the manikin’s skin could not be accurately calculated based on the difference between the Re in the Control (ṁcontrol, g·h−1) and Vest (ṁcontrol+vest, g·h−1) trials. Thus, a third trial was conducted, during which the loss of mass (ṁvest) was measured with clothed manikin wearing the cooling vest, but without the wet skin layer. This allowed the calculation of the ṁr, as shown in EquationEquation (3)(3)
(3) .
The ṁvest differs among the cooling concepts used by the different cooling vests. For example, the PCVs, LCVs and ACVs are relatively dry when activated, thus there is no mass loss observed in the vest over time (ṁvest = 0). ECVs, however, are wet when activated, therefore, as water evaporates from the vest, mass loss of the vest over time is noted (ṁvest > 0).
Therefore, the mass of water restricted from evaporating due to an activated cooling vest (ṁr) was defined as
(3)
(3)
where
ṁr (g·h−1) = average mass of water restricted from evaporating from the wet skin due to the barrier imposed by the activated cooling vest (dmr/dt; t = 1 h),
ṁcontrol (g·h−1) = average mass loss of the clothed whole-body thermal manikin wearing: i) wet skin and ii) baseline clothing ensemble (dmcontrol/dt; t = 1 h),
ṁvest (g·h−1) = average mass loss of the clothed whole-body thermal manikin wearing: i) baseline clothing ensemble, and ii) an activated cooling vest (dmvest/dt; t = 1 h) and
ṁcontrol+vest (g·h−1) = average mass loss of the clothed whole-body thermal manikin wearing: i) wet skin, ii) baseline clothing ensemble, and iii) activated cooling vest (dmcontrol+vest/dt; t = 1 h).
The evaporative resistance posed by the cooling vests was then expressed as relative to the control condition (Re; %) and derived as follows:
(4)
(4)
where
Re (%) = relative evaporative resistance of the cooling vest in relation to the control condition.
Activation protocol
Preparation of cooling vests varied between the three different types of measurements. The Rt measurements were performed on inactivated cooling vests and for this purpose, the vests were stored at room temperature (see section Thermal resistance) prior to each trial. Re (%) and C measurements, however, were conducted on activated cooling vests. Activation protocols were specific to either each category of cooling vests or, in some cases, to individual cooling vests. Cooling vests were stored inside the climatic chamber, to allow them to equilibrate to the experimental ambient conditions. At the onset of each trial they were activated according to the manufacturer’s instructions. The activation protocol of individual vests or different cooling concepts is described below.
Active cooling vests
Liquid-perfused cooling vest COMP: The 2-L bladder was filled with 1.5 L of tap water and subsequently frozen. Once frozen, 0.3 L of ice-cold water (3 – 4 °C) was added to the bladder. The bladder was then placed inside the back pocket of the vest and attached to the water pump. The pump always operated with a fully charged battery.
Air cooling vest VRTX: The vest was connected to a source of compressed air, pressurised to Pair = 6.9 bar. The vortex tube incorporated the Venturi effect, causing a decrease in temperature of the air, which then entered the vest through a tube, attached to the posterior of the vest (microenvironment air temperature: ∼19 °C). The pressure of air entering the tube was monitored with the pressure gauge.
Evaporative cooling vests
ECOOL, IH wet, TECH, XTREM: The vests were soaked in 35 °C water (equilibrated inside the climatic chamber at 35 °C) for 1 – 2 min. Next, the excess water was squeezed out to avoid dripping from the fabric. Each vest was assigned a starting wet weight which was met in all the trials.
IZI: The vest was first soaked in tap water for 20 min. Then it was briefly dried out with a towel and hung up on a hanger for approximately 4 h.
SMART: The vest was filled with 500 mL of water, tempered at 15 °C. The water was then evenly distributed throughout the vest. Finally, the excess water was squeezed out so that the starting weight of the vest reached approximately 500 g (210 – 215 % of its dry weight) in each trial.
Vests with PCM and gel inserts
CRYO, ERGO, FICE, FLEX, GTEX, IH 6.5, IH 15, IH 21, IH 29, POLAR, STA. PCM inserts were placed in a freezer (–18 °C) for approximately 24 h. Directly before each experiment, frozen inserts were inserted in the designated pockets of the vest.
Hybrid cooling vests
IH 6.5 wet, IH 15 wet, IH 21 wet, IH 29 wet. First the vests were soaked in 35 °C water (kept inside the climatic chamber at 35 °C) for 1 – 2 min. Next, the excess water was squeezed out to avoid dripping from the fabric. In each trial a similar starting weight was achieved (∼813 g; ∼345 % of its dry weight). Then the frozen PCM inserts (frozen for approximately 24 h) were inserted in the designated inner pockets of the vest, covering front and back torso. The pockets are made from a thin non-absorbent mesh, thus providing a minimum barrier between the PCM inserts and the body. Therefore, the wet vest primarily covers the PCM inserts, but also some body parts, where PCMs are not located.
Analysis
Two repetitions of C measurements and three repetitions of Rt and Re (%) measurements were performed for each cooling vest to ensure repeatability of the results. Once repeatability was assured (coefficient of variation < 10 %), the repeated measurements were averaged, and the average values of C, Rt and Re (%) for each vest used in the further analysis. The tested vests were categorised in groups, based on their cooling concept () and further compared.
For the C measurements heating power (P; W.m−2) over an 8-h period was measured. P Values obtained for the front and back torso were averaged at each time point. Among the tested cooling vests, a great variety of cooling patterns was noticed. For easier interpretation of the results, maximum cooling power (Pmax), the cooling duration (tc), and area under the curve (AUC; cooling capacity measure) were defined for each vest (). The cooling duration was defined as the time between the start of the measurements and the last time point at which P ≥ 20 W·m−2. Below this value it was presumed the vest would not provide efficient cooling. Considering the body surface area is 1.7 m2 and the body heat production is 100 W (Qi and McAlpine Citation2010), the cooling power of 20 W·m−2 extracts approximately a third of the generated heat per surface area (∼60 W·m−2). The torso presents about 30 % of the overall body surface area, with tested cooling vests covering most of this area. As such, the cooling power below 20 W·m−2 was considered as insufficient. Accordingly, the area under the curve (AUC) was calculated up to the tc point.
One-way repeated-measures ANOVA was used to compare average cooling power (Pavg) over the 8-h trials between the vests within 4 categories (active vests, evaporative vests, vests with PCM and gel inserts and hybrid vests). Values are reported as means ± SD. If a significant F value was found (p < 0.05), critical differences were analysed by Tukey’s procedure to locate the significant mean differences. Statistical analysis was performed using Statistica 8.0 (Statsoft Inc., Tulsa, OK).
Results
Cooling capacity (C)
Active cooling vests
In terms of Pavg, the air-cooled vest VRTX was the more efficient of the two active vests evaluated (air cooling: VRTX, liquid cooling: COMP; p ˂ 0.001; ). Over an 8-h period VRTX’s Pavg was 41 W·m−2 compared to 17 W·m−2 for the COMP (). Pmax, however, was greater for COMP (60 W·m−2) compared to VRTX (44 W·m−2). Tc was greater in VRTX (infinite; ) than in COMP (151 min). When considering both tc and the continuous cooling power (AUC), the cooling capacity was calculated greater for VRTX (331 W·h·m−2) than for COMP (118 W·h·m−2) as presented in .
Figure 1. Graphic presentation of the parameters determined in the cooling capacity measurements. Pmax: maximal cooling power; Tc: cooling duration when P ≥ 20 W·m−2; AUC: area under the curve, indicating cooling capacity.
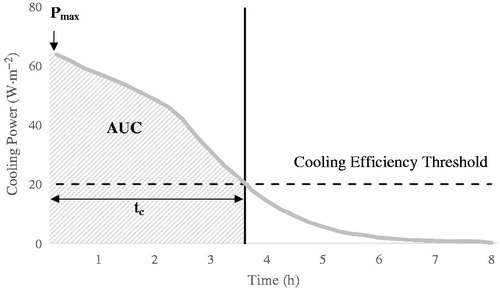
Figure 2. Cooling power of vests within each category over 8-h trial.
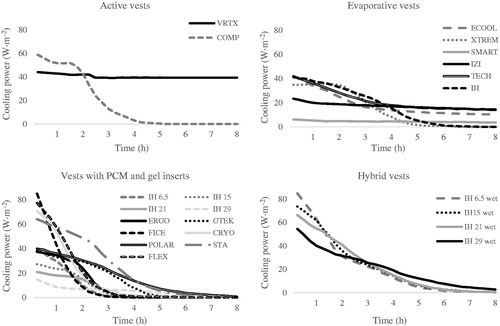
Table 2. Cooling capacity of the tested cooling vests.
Evaporative cooling vests
Among the evaporative vests evaluated (IH, XTREM, TECH, ECOOL, IZI, SMART) the SMART vest had the lowest Pavg (p ˂ 0.001; ) over the 8-h period. Its Pmax was 6 W·m2, meaning it did not provide sufficient cooling throughout the trial (tc = 0 min; AUC = 0 W·h·m−2). In terms of Pavg, TECH exerted significantly higher average cooling power over the 8-h trial, compared to XTREM, SMART (p ˂ 0.001) and IH (p ˂ 0.05), with 22 W·m−2 (). Pmax was observed similar for TECH, ECOOL, IH wet and XTREM (43 W·m−2, 43 W·m−2, 42 W·m−2 and 37 W·m−2, respectively), whereas IZI was significantly less powerful (24 W·m−2; ). IH wet provided efficient cooling (≥ 20 W·m−2) for the longest period of time (3.5 h; ) among the evaporative cooling vests. TECH and EXTREM were both efficient for approximately 3 h and ECOOL for just less than 2.5 h, whereas IZI provided only 45 min of efficient cooling. This resulted in cooling capacity being the greatest for IH wet (113 W·h·m−2; ), followed by XTREM and TECH (both 97 W·h·m−2) and ECOOL (74 W·h·m−2). The lowest cooling capacity was observed in IZI (17 W·h·m−2).
Cooling vests with PCM and gel inserts
Among the variety of the vests with PCM and gel inserts, STA vest performed with a significantly higher Pavg throughout the 8-h trial (23 W·m−2; p ˂ 0.01; ). Following STA, POLAR and FLEX also displayed good Pavg (16 W·m−2 and 14 W·m−2, respectively), which was significantly higher when compared to all IH combinations with PCMs with different melting points (p ˂ 0.001; ). POLAR also had greater Pavg (16 W·m−2) when compared to ERGO (10 W·m−2; p ˂ 0.05). GTEK (13 W·m−2) and CRYO (13 W·m−2) provided better cooling compared to most combinations of IH and PCMs (IH 15, IH 21 and IH 29; p ˂ 0.05; ). In terms of Pmax, FICE (feather ice inserts) provided the greatest cooling power among the vests in this category, reaching over 90 W·m−2 (). It was closely followed by FLEX (ice inserts; 80 W·m−2) and CRYO (gel inserts; 73 W·m−2). STA was the fourth most efficient cooling vest with PCM or gel inserts, reaching 65 W·m−2. Pmax values for the other vests were lower than 50 W·m−2, the lowest being that of IH 29 (16 W·m−2). Tc was observed the greatest in STA (3.5 h; ), followed by POLAR and GTEK (both approximately 3 h). ERGO, FLEX and CRYO all provided efficient cooling for approximately 2 h, whereas IH 15, FICE and IH 6.5 were effective for about 1.5 h. The shortest efficient cooling duration was that of IH 21 (less than 30 min). IH 29 never reached the threshold of 20 W·m−2. This also resulted in its cooling capacity (AUC) being 0 W·h·m−2 (). When observing the other vests within this category, STA possessed the greatest cooling capacity by a large margin (164 W·h·m−2). It was followed by FLEX, POLAR, CRYO and GTEK (90 – 100 W·h·m−2). FICE’s and ERGO’s cooling capacities were about 70 W·h·m−2, whereas for IH 6.5 and IH 15 the cooling capacity was about 40 W·h·m−2. Cooling capacity of IH 21 was barely notable (7 W·h·m−2).
Hybrid cooling vests
The hybrid vests consisted of the wet IH vest, combined with PCM inserts with different melting points (IH 6.5 wet, IH 15 wet, IH 21 wet and IH 29 wet), therefore providing four hybrid vest combinations (). When comparing Pavg, no significant difference between the combinations was noted, as all four of them exerted similar average cooling powers over the 8-h trial (∼20 W·m−2; ). When comparing the HYB concept to the evaporative only (IH wet), Pavg of IH wet was significantly lower than that of the hybrid combinations (p ˂ 0.05; ). We noted a trend of decreasing Pmax with increasing Tm. The greatest cooling power was thus observed for IH 6.5 (88 W·m−2; ), followed by IH 15, IH 21 and IH 29 (75 W·m−2, 68 W·m−2 and 57 W·m−2, respectively). Tc values for IH 6.5, IH 15 and IH 21 were comparable (just under 3.5 h), with IH 29 being efficient slightly longer (well over 3.5 h). In terms of the cooling capacity, combinations with PCM inserts with the three lowest Tm had nearly the same AUC values (about 145 W·h·m−2; ), whereas IH 29 resulted in a slightly lower cooling capacity (127 W·h·m−2).
Cooling concepts
Based on the P and tc of each vest, the AUC was calculated. This value represents the vest’s cooling capacity (; ). When comparing the vests with the largest AUC from each category according to the cooling concept, the VRTX (active, air-cooled vest) had the greatest cooling capacity (331 W·h·m−2), followed by STA (vest with gel inserts; 164 W·h·m−2), the three hybrid combinations (IH 15, IH 21 and IH 6.5; 145 – 146 W·h·m−2) and lastly by the IH wet (evaporative vest; 113 W·h·m−2).
Among the evaporative vests and the vests with PCM and gel inserts, there were two vests in each category that did not provide sufficient cooling, with SMART and IZI among the evaporative vests and IH 29 and IH 21 among the vests with PCM inserts.
Thermal resistance (Rt)
The Rt was assessed on inactivated cooling vests (). The Rt value of each tested cooling vest was calculated and expressed relatively to that of the control condition. Within individual categories, the liquid-perfused cooling vest (COMP) provided the greatest insulation among the two active cooling vests (+63 %), followed by the STA among the vests with PCM and gel inserts (+46 %) and IH (without inserted PCMs) among the evaporative vests (+38 %).
Table 3. Thermal resistance of the tested cooling vests.
Relative evaporative resistance (Re; %)
The Re (%) measurements were performed on activated vests (). The Re (%) value of the tested cooling vest was calculated and expressed relative to that of the control condition. In general, the ‘wet’ vests (evaporative and hybrid cooling vests) provided the greatest Re (%), adding from 27 % (IH 29 wet) to 40 % Re (IH and IH 6.5 wet) relative to the control. The two evaporative cooling vests providing the lowest Re (%) were SMART and IZI, both increasing resistance by roughly 15 % relative to the control. In terms of hybrid vests, the combination of IH with PCM inserts melting at the lowest Tm (IH 6.5 wet) hindered evaporation of water from the skin the most (+40 %) and IH with PCM inserts melting at the highest Tm resulted in the lowest Re (%), adding roughly 28 % Re compared to the control condition. Among the two active cooling vests, COMP impeded evaporation from the skin by roughly 19 %, whereas VRTX actually promoted evaporation, which resulted in Re 4 % lower than that of the control. Cooling vests with PCM and gel inserts all provided similar amount of Re (%), ranging between 16 and 21 %, with the lowest being that of IH 6.5 and the highest of STA.
Table 4. Relative evaporative resistance (Re; %) of the activated cooling vests.
Discussion
Cooling vests used to be the domain of workers required to work regularly in extremely hot indoor and/or outdoor ambient temperatures, or having to wear personal protective clothing, with both scenarios hindering heat exchange between the worker and the ambient. With summer heat waves increasing in frequency, intensity and duration, cooling vests are also being considered in other occupations with intermittent heat exposures. The aim of adopting cooling vests in a variety of industries is to maintain not only workers’ health and well-being, but also their productivity. The impetus for this project arose from concerns voiced by managers regarding the lack of tools and guidelines for choosing the optimal cooling vest for a particular type of task from a vast palette of different types available on the market. Subjective qualitative assessment of the efficiency of commercially available cooling vests is provided by the manufacturers, and quantitative assessments of specific vests are provided by studies conducted in different laboratories using different methodologies.
In this study, the principle aim was to evaluate the efficiency of commercially available cooling vests using different cooling concepts and thus provide some useful information and guidelines for industry managers when purchasing the most suitable cooling vest for their workers. The ambient conditions of 35 °C and 35 % relative humidity, were chosen on the basis of measurements conducted in a manufacturing company (Ciuha et al. Citation2019). The key finding of this study was that under the given ambient conditions (Ta = 35 °C, RH = 35%) cooling capacities differed significantly among different vests and cooling concepts. For instance, some vests with frozen PCM and gel inserts provided more aggressive cooling for a shorter period of time whereas evaporative vests provided milder cooling, but for longer periods. Thus, the former might not be suitable for industry workers during an 8-h shift. Once the vest’s cooling capacity is exhausted, the vest becomes a burden hindering natural thermoregulatory processes. In such environments, vests exerting moderate to low cooling powers for longer periods of time might be favourable. Needless to say, different ambient conditions would result in different outcomes (Wang and Song Citation2017). Sweat evaporation presents a major mechanism for dissipating heat as a litre of sweat extracts approximately 2400 kJ of heat energy. Evaporation is however compromised in high water-vapour pressure environments (Epstein and Sohar Citation1985; Tyler Citation2019). In such conditions, the vests using PCM or gel inserts would be more appropriate (Yi et al. Citation2017).
Cooling capacity of the tested cooling vests
The cooling capacity of each vest was determined based on its cooling power and cooling duration. The measurements on a thermal manikin identified the active air-cooled vest VRTX as the one with the greatest cooling capacity, provided by convection. However, this was the only vest supplied with a constant source of energy. Considering the vests with exhaustible cooling resources, STA, vest with PCM inserts, provided the greatest cooling capacity. It was followed by the hybrid IH vest, combining wet vest with different PCM inserts (Tm 6.5, 15 and 21 °C). IH vest was tested both dry and wet, combined with different PCM inserts. In terms of cooling capacity, it however performed significantly better when used as a hybrid.
Among the tested cooling vests not all provided sufficient cooling power (P ≥ 20 W·m−2) under the tested ambient conditions (SMART and IH 29). Presumably, these vests would only add thermal (due to additional insulation) and metabolic burden (due to the weight) to the wearer. When observing cooling duration of the PCM inserts of different Tm, it was hypothesised that PCMs with higher Tm would melt slower due to decreasing temperature gradient between the coolant and the manikin’s skin, and therefore provide longer cooling. This was, in fact, observed to be true, however, the cooling power of the PCMs decreased inversely with their Tm and, in cases of the IH 21 and IH 29, only barely and not at all surpassed the pre-set threshold of 20 W·m−2. Consequently, their cooling duration was calculated as shorter compared to PCMs with lower Tm, as those provided more powerful cooling, above the threshold, for a longer period throughout the 8-h trial. As reported by Gao et al. (Gao, Kuklane, and Holmér Citation2010) the temperature gradient between the PCM melting temperature and the torso surface temperature should be greater than 6 °C, to provide sufficient cooling to the body. This could explain the observations made in this study.
When applying the results to real-life scenarios, it is to be expected that the vests would perform differently under different environmental conditions. For instance, it is expected that evaporative vests would deliver better cooling under conditions with greater air velocity (Rykaczewski Citation2020) and lower relative humidity, encouraging evaporation. Despite this, the aim of this study was to assess the cooling capacities of the vests under indoor industrial settings, where air velocities are typically low.
Thermal resistance (Rt) and relative evaporative resistance (Re; %)
An important characteristic of the vest is also its design, including the insulation of the vest. This becomes especially important in scenarios when the wearer cannot remove the vest once its cooling capacity is exhausted. Vests with high Rt can significantly increase thermal stress on the wearer. Interestingly, in this study the vests that provided the greatest cooling capacities were the ones with the highest Rt values (STA, IH, COMP) meaning they would provide the most insulation once inactive. Most cooling vests present a certain burden and mobility restrictions to the wearer, due to their weight and construction. Therefore, the cooling efficiency must outweigh the metabolic and ergonomic hindrance to make the vest worth wearing.
While the thermal resistance was assessed on unactivated vests to determine their insulation, the evaporative resistance was studied on activated vests to determine the barrier to natural sweat evaporation. Results of the Re (%) measurements reveal that the air-cooled vest VRTX (constantly blowing in cooler compressed air) was the only one enhancing evaporation of sweat (water) from the skin compared to the control condition. This outcome, however, was not surprising, as evaporative and conductive heat loss are the two main natural mechanisms VRTX exploits to provide cooling to the wearer. All other tested cooling vests provided a certain amount of resistance to the sweat evaporation, the greatest being that of the ‘wet’ vests (evaporative and hybrid cooling vests). Interestingly, they provided comparable Re (%), even though they were supplied with different amounts of water, depending on their absorption capacity. However, IZI and SMART vests were the two evaporative vests that stood out in this category by providing significantly lower Re (%). This is most likely due to their distinct activation protocols which ensured the vests were relatively dry when donned onto the manikin. Also, according to the manufacturers’ instructions, the water temperature when activating the two vests was lower than that of other vests; however, that most likely did not significantly affect the results of Re (%). Namely, IZI vest was stored at room temperature for 4 h post-activation and the SMART vest absorbed water in the inner sponge-like material within the two external textile layers. Although their cooling concepts slightly differ from those of the ‘wet’ evaporative vests, the underlying physical heat-loss mechanism IZI and SMART vests exploit is the same as that of the ‘wet’ vests. It seems that these types of cooling vests mostly encourage evaporation from the surface of the vest, while natural sweat evaporation from the skin underneath is limited. Yet, they provided a form of mild, but durable cooling as seen from the C measurements. Furthermore, although IZI and SMART vests provided lower Re (%), their C values were also significantly lower compared to other tested evaporative vests. The vests with PCM inserts also reduced the evaporative capacity of the observed system, presumably due to reduced breathability of the materials (Mokhtari Yazdi, Sheikhzadeh, and Chavoshi Citation2015), with findings suggesting their efficiency would be greater compared to others in humid environments, where evaporative cooling is reduced or when wearing the vests underneath unbreathable protective clothing (Maley et al. Citation2020).
These findings show that considering the vests’ C in conjunction with their Re (%) does not always provide a better presentation of each vest’s cooling efficacy in a real-world setting, even though it might be hypothesised otherwise.
Inhibition of heat loss mechanisms
Dry heat loss is directly proportional to the temperature gradient between the skin and surrounding air. With increasing ambient temperatures, the gradient decreases, as does heat loss by convection and radiation. The main avenue of heat loss in a warm environment is evaporation of sweat secreted onto the skin surface. The contribution of different heat loss pathways to the overall heat loss over a range of ambient temperatures was reported for individuals exercising at 150 W (Nielsen and Nielsen Citation1962) . With increasing temperature, convective and radiative heat losses became negligible, as they approached the level of skin temperature, while evaporative heat loss increased. Despite the changes in the magnitude of heat loss through different pathways, overall heat loss was maintained constant. Applying a cooling vest to the torso of participants in the above scenario could transiently increase the overall heat loss by augmenting conductive/convective and evaporative heat losses. However, vests which apply a cold stimulus to the skin could cause vasoconstriction and inhibit the onset of sweating. In doing so, vests inhibit the natural pathways of heat loss. Tests of cooling vests conducted with sweating thermal manikins do not account for all physiological responses, which would be observed in humans. It is for this reason that a minimal extraction of heat must be considered when evaluating cooling vests. The augmentation of physical heat loss from the body should be greater than the inhibition of thermoregulatory heat loss effectors mechanisms.
Practical issues
The vests with inserts were categorised as the vests using PCMs or gels, according to the manufacturer’s description of the product. For some vests with gel inserts (POLAR, STA) no data regarding the inserts’ melting temperatures or ingredients were provided. Inserts of both vests were frozen before use (except during the Rt measurements), and, during the measurements, changed their state from solid to liquid by storing latent heat from the manikin’s torso – same as ice/water, which is the best-known PCM with a melting point at 0 °C (Mokhtari Yazdi and Sheikhzadeh Citation2014). As such, POLAR and STA vests could also be considered as vests using PCM inserts. Among the vests with inserts, the FICE vest was somewhat different. Its inserts, called feather ice, contained silica crystals, which did not change phase and remained in a powder form when frozen or heated. As such, these inserts could store sensible but not latent heat. Their cooling capacity, however, was much greater than in some of the other vests with PCM inserts.
There were some issues regarding certain cooling vests observed when conducting the experiments. For example, after a certain number of subsequent wetting cycles IH lost a significant amount of its ability to retain water in the fabric, meaning it could not be wetted as heavily as in the first experiments. Therefore, the experiments had to be repeated to ensure repeatability of results. This also occurred with the IZI vest, which substantially lost its ability to retain water and dissolve the embedded gel grains, resulting in impairment of its cooling capacity. ERGO did not fit the manikin torso properly when frozen (stiff) PCM panels were inserted into the vest. Consequently, the contact area with the manikin torso and thus the cooling surface area were reduced. SMART’s cooling capacity was found to be insufficient (P˂ 20 W·m−2) under the studied conditions. However, in our experiments the vest was filled with 15 °C water according to the manufacturer’s recommendations. Its performance might have been improved with cooler water. COMP, however, was filled with ice-cold water. The bladder was firstly filled with ∼1.5 L of tap water and placed in the freezer until frozen. Then, 0.3 L of 4 °C water was added into the bladder. The initial temperature of the liquid water was 0 − 2 °C. When terminating the experiment, the water temperature inside the bladder would increase to 4 °C. It appeared that the cooling capacity was the largest when the bladder was prepared as described; however, the preparation was complex and long, which makes it quite impractical to use in real-life situations, particularly at work. Also, such extremely cold water circulating through tubes close to the skin might not be comfortable for the user. Warmer water, however, would alter the outcome of the cooling capacity measurements.
Limitations and considerations
In this study, the vests were evaluated exclusively with a manikin, which provides a valuable tool in heat exchange calculations. It does not however reflect human physiological responses, such as increased sweat secretion, vasoconstriction, and vasodilatation etc., which can occur and affect an individual’s thermal state. It also does not provide any feedback regarding the ergonomic aspects of the vest (i.e. wear comfort, etc.) and is not affected by the weight of the vest, which can increase metabolic rate and thus heat production (Dorman and Havenith Citation2005). Specifically, wear comfort and the practicality of using a vest play an important role in its usability (Chan et al. Citation2015).
The body surface area covered by the vests was not measured, neither were the surface areas nor the volume of the PCM inserts. Previous studies (Gao, Kuklane, and Holmér Citation2010) with a thermal manikin suggest that the covering area is positively correlated with the cooling rate, whereas the cooling duration depends on the mass and the latent heat of the PCMs used.
In this study, the cooling capacity of the vests was only evaluated under one ambient condition. The vests should be tested at various ambient conditions, to determine the temperature and relative humidity boundaries within which a vest performs optimally.
Conclusions
In this study, the vests combining sufficient and durable cooling included VRTX as an active air cooling vest, IH as an evaporative vest, STA as a vest using gel inserts and the hybrids (IH 6.5, IH 15, IH 21, IH 29), combining evaporation and cooling with PCM inserts. These outcomes are a function of the ambient conditions used in this study. It would therefore be prudent to assess the manner in which cooling capacity of the vests using different cooling concepts is modified by ambient temperature and relative humidity.
Considering cooling durability, the air-cooled vest (VRTX) was the most effective as it provided constant cooling throughout the 8-h trial. It was however connected to a source of compressed air, meaning that in real-life setting, the vest would restrict movement of the wearer. When cooling durability is not the main requirement, other vests providing comparable cooling power should be considered.
This study has demonstrated a range of cooling capacities among different cooling concepts, as well as among cooling vests within the same category. Based on the results it is presumed that most of the tested cooling vests would be beneficial for the user in terms of maintaining thermal homeostasis and mitigating heat strain. In an industrial environment this should contribute to the prevention of heat-stress related disorders, while maintaining productivity and well-being of workers.
Disclosure statement
No potential conflict of interest was reported by the author(s).
Additional information
Funding
References
- Barr, D., W. Gregson, and T. Reilly. 2010. “The Thermal Ergonomics of Firefighting Reviewed.” Applied Ergonomics 41 (1): 161–172. doi:10.1016/j.apergo.2009.07.001.
- Barwood, M. J., S. Davey, J. R. House, and M. J. Tipton. 2009. “Post-Exercise Cooling Techniques in Hot, Humid Conditions.” European Journal of Applied Physiology 107 (4): 385–396. doi:10.1007/s00421-009-1135-1.
- Barwood, M. J., P. S. Newton, and M. J. Tipton. 2009. “Ventilated Vest and Tolerance for Intermittent Exercise in Hot, Dry Conditions with Military Clothing.” Aviation, Space, and Environmental Medicine 80 (4): 353–359. doi:10.3357/asem.2411.2009.
- Bomalaski, S. H., Y. T. Chen, and S. H. Constable. 1995. “Continuous and Intermittent Personal Microclimate Cooling Strategies.” Aviation Space and Environmental Medicine 66: 745–750.
- Cadarette, B. S., S. N. Cheuvront, M. A. Kolka, L. A. Stephenson, S. J. Montain, and M. N. Sawka. 2006. “Intermittent Microclimate Cooling during Exercise-Heat Stress in US Army Chemical Protective Clothing.” Ergonomics 49 (2): 209–219. doi:10.1080/00140130500436106.
- Cadarette, B. S., B. S. DeCristofano, K. L. Speckman, and M. N. Sawka. 1990. “Evaluation of Three Commercial Microclimate Cooling Systems.” Aviation, Space, and Environmental Medicine 61 (1): 71–76.
- Caldwell, J. N., M. J. Patterson, and N. A. S. Taylor. 2012. “Exertional Thermal Strain, Protective Clothing and Auxiliary Cooling in Dry Heat: Evidence for Physiological but Not Cognitive Impairment.” European Journal of Applied Physiology 112 (10): 3597–3606. doi:10.1007/s00421-012-2340-x.
- Casanueva, A., S. Kotlarski, A. Fischer, A. Flouris, T. Kjellstrom, B. Lemke, L. Nybo, C. Schwierz, and M. Liniger. 2020. “Escalating Environmental Heat Exposure–a Future Threat for the European Workforce.” Regional Environmental Change 20 (2). doi:10.1007/s10113-020-01625-6.
- Chan, A., F. Wong, Y. Li, D. P. Wong, and Y. P. Guo. 2015. “Evaluation of a Cooling Vest in Four Industries in Hong Kong.” Journal of Civil Engineering and Architecture Research 2: 677–691.
- Chinevere, T. D., B. S. Cadarette, D. A. Goodman, B. R. Ely, S. N. Cheuvront, and M. N. Sawka. 2008. “Efficacy of Body Ventilation System for Reducing Strain in Warm and Hot Climates.” European Journal of Applied Physiology 103 (3): 307–314. doi:10.1007/s00421-008-0707-9.
- Ciuha, U., M. Grönkvist, I. B. Mekjavic, and O. Eiken. 2016. “Strategies for Increasing Evaporative Cooling during Simulated Desert Patrol Mission.” Ergonomics 59 (2): 298–309. doi:10.1080/00140139.2015.
- Ciuha, U., T. Pogačar, L. K. Bogataj, M. Gliha, L. Nybo, A. D. Flouris, and I, B. Mekjavic. 2019. “Interaction between Indoor Occupational Heat Stress and Environmental Temperature Elevations during Heat Waves.” Weather, Climate, and Society 11 (4): 755–762. doi:10.1175/WCAS-D-19-0024.1.
- Craig, F., and J. Moffitt. 1974. “Efficiency of Evaporative Cooling from Wet Clothing.” Journal of Applied Physiology 36 (3): 313–316. doi:10.1152/jappl.1974.36.3.313.
- Dorman, L., and G. Havenith. 2005. “The Influence of Clothing Weight and Bulk on Metabolic Rate when Wearing Protective Clothing.” Proceedings of the Third International Conference on Human-Environmental System ICHES 05, Tokyo, Japan: 47–50
- Duffield, R., B. Dawson, D. Bishop, M. Fitzsimons, and S. Lawrence. 2003. “Effect of Wearing an Ice Cooling Jacket on Repeat Sprint Performance in Warm/Humid Conditions.” British Journal of Sports Medicine 37 (2): 164–169. doi:10.1136/bjsm.37.2.164.
- Epstein, Y., and E. Sohar. 1985. “Fluid Balance in Hot Climates: sweating, Water Intake, and Prevention of Dehydration.” Public Health Reviews 13 (1–2): 115–137.
- Flouris, A. D., P. C. Dinas, L. G. Ioannou, L. Nybo, G. Havenith, G. P. Kenny, and T. Kjellstrom. 2018. “Workers' Health and Productivity under Occupational Heat Strain: A Systematic Review and Meta-Analysis.” The Lancet. Planetary Health 2 (12): e521–e531. doi:10.1016/S2542-5196(18)30237-7.
- Gao, C., K. Kuklane, and I. Holmér. 2010. “Cooling Vests with Phase Change Material Packs: The Effects of Temperature Gradient, Mass and Covering Area.” Ergonomics 53 (5): 716–723. doi:10.1080/00140130903581649.
- Giorgi, F., and P. Lionello. 2008. “Climate Change Projections for the Mediterranean Region.” Global and Planetary Change 63 (2–3): 90–104. doi:10.1016/j.gloplacha.2007.09.005.
- Havenith, G., P. Bröde, E. Hartog, K. Kuklane, I. Holmer, R. M. Rossi, M. Richards, B. Farnworth, and X. Wang. 2013. “Evaporative Cooling: Effective Latent Heat of Evaporation in Relation to Evaporation Distance from the Skin.” Journal of Applied Physiology 114 (6): 778–785. doi:10.1152/japplphysiol.01271.2012.
- ISO. 2004. Clothing—Physiological Effects—Measurement of Thermal Insulation by Means of a Thermal Manikin (ISO 15831: 2004). Geneva: ISO.
- Kjellstrom, T., I. Holmer, and B. Lemke. 2009. “Workplace Heat Stress, Health and Productivity–an Increasing Challenge for Low and Middle-Income Countries during Climate Change.” Global Health Action 2 (1): 2047. doi:10.3402/gha.v2i0.2047.
- Kuklane, K., K. Lundgren, C. Gao, J. Löndahl, E. D. Hornyanszky, P.-O. Östergren, P. Becker, M. C. Samuels, P. Gooch, C. Sternudd, M. Albin, T. Taj, E. Malmqvist, E. Swietlicki, L. Olsson, K. Persson, J. A. Olsson, and T. Kjellstrom. 2015. “Ebola: improving the Design of Protective Clothing for Emergency Workers Allows Them to Better Cope with Heat Stress and Help to Contain the Epidemic.” The Annals of Occupational Hygiene 59 (2): 258–261. doi:10.1093/annhyg/mev003.
- Maley, M. J., G. M. Minett, A. J. Bach, K. L. Stewart, and I. B. Stewart. 2020. “Extending Work Tolerance Time in the Heat in Protective Ensembles with Pre-and per-Cooling Methods.” Applied Ergonomics 85: 103064. doi:10.1016/j.apergo.2020.103064.
- McLellan, T. M., J. Frim, and D. G. Bell. 1999. “Efficacy of Air and Liquid Cooling during Light and Heavy Exercise While Wearing NBC Clothing.” Aviation, Space, and Environmental Medicine 70 (8): 802–811.
- Mokhtari Yazdi, M., and M. Sheikhzadeh. 2014. “Personal Cooling Garments: A Review.” The Journal of the Textile Institute 105 (12): 1231–1250. doi:10.1080/00405000.2014.895088.
- Mokhtari Yazdi, M., M. Sheikhzadeh, and S. E. Chavoshi. 2015. “Modeling the Performance of a PCM Cooling Vest considering Its Side Effects.” International Journal of Clothing Science and Technology 27 (4): 573–586. doi:10.1108/IJCST-01-2014-0018.
- Morabito, M., A. Crisci, A. Messeri, G. Messeri, G. Betti, S. Orlandini, A. Raschi, and G. Maracchi. 2017. “Increasing Heatwave Hazards in the Southeastern European Union Capitals.” Atmosphere 8 (12): 115. doi:10.3390/atmos8070115.
- Nielsen, B., and M. Nielsen. 1962. “Body Temperature during Work at Different Environmental Temperatures.” Acta Physiologica Scandinavica 56: 120–129. doi:10.1111/j.1748-1716.1962.tb02489.x.
- OECD. 2017. “Gross domestic product.” Accessed 14 April 2018. https://stats.oecd.org/index.aspx?queryid=60702
- Pogačar, T., A. Casanueva, K. Kozjek, U. Ciuha, IB. Mekjavić, LK. Bogataj, and Z. Črepinšek. 2018. “The Effect of Hot Days on Occupational Heat Stress in the Manufacturing Industry: implications for Workers’ Well-Being and Productivity.” International Journal of Biometeorology 62 (7): 1251–1214. doi:10.1007/s00484-018-1530-6.
- Qi, Y., and M. C. McAlpine. 2010. “Nanotechnology-Enabled Flexible and Biocompatible Energy Harvesting.” Energy & Environmental Science 3 (9): 1275–1285. doi:10.1039/c0ee00137f.
- Rykaczewski, K. 2020. “Rational Design of Sun and Wind Shaded Evaporative Cooling Vests for Enhanced Personal Cooling in Hot and Dry Climates.” Applied Thermal Engineering 171: 115122. doi:10.1016/j.applthermaleng.2020.115122.
- Shapiro, Y., K. B. Pandolf, M. N. Sawka, M. M. Toner, F, R. Winsmann, and R. F. Goldman. 1982. “Auxiliary Cooling: comparison of Air-Cooled vs. water-Cooled Vests in Hot-Dry and Hot-Wet Environments.” Aviation, Space, and Environmental Medicine 53 (8): 785–789.
- Tyler, C. J. 2019. Maximising Performance in Hot Environments: A Problem-based Learning Approach. Routledge, London.
- Vernieuw, C. R., L. A. Stephenson, and M. A. Kolka. 2007. “Thermal Comfort and Sensation in Men Wearing a Cooling System Controlled by Skin Temperature.” Human Factors: The Journal of the Human Factors and Ergonomics Society 49 (6): 1033–1044. doi:10.1518/001872007X249893.
- Wang, F., C. Gao, K. Kuklane, and I. Holmér. 2011. “Determination of Clothing Evaporative Resistance on a Sweating Thermal Manikin in an Isothermal Condition: Heat Loss Method or Mass Loss Method?” The Annals of Occupational Hygiene 55 (7): 775–783. doi:10.1093/annhyg/mer034.
- Wang, F., and W. Song. 2017. “An Investigation of Thermophysiological Responses of Human While Using Four Personal Cooling Strategies during Heatwaves.” Journal of Thermal Biology 70 (Pt A): 37–44. doi:10.1016/j.jtherbio.2017.05.007.
- Yi, W., Y. Zhao, and A, P. Chan. 2017. “Evaluating the Effectiveness of Cooling Vest in a Hot and Humid Environment.” Annals of Work Exposures and Health 61 (4): 481–494. doi:10.1093/annweh/wxx007.
- Yi, W., Y. Zhao, AP. Chan, and EW. Lam. 2017. “Optimal Cooling Intervention for Construction Workers in a Hot and Humid Environment.” Building and Environment 118: 91–100. doi:10.1016/j.buildenv.2017.03.032.
- Zhao, M., C. Gao, F. Wang, K. Kuklane, I. Holmér, and J. Li. 2013. “The Torso Cooling of Vests Incorporated with Phase Change Materials: A Sweat Evaporation Perspective.” Textile Research Journal 83 (4): 418–425. doi:10.1177/0040517512460294.