
Abstract
The purpose of the present study was to determine how hypoxia effects awareness of environment (AoE) in helicopter pilots operating at high altitude. Eight helicopter crews flew two operational flights in a flight simulator while breathing gas mixtures of 20.9% (equivalent to 0 m altitude) and 11.4% (equivalent to 4572 m or 15,000 ft altitude) oxygen in a single blinded, counterbalanced, repeated measures study. Each flight included five missions, during which environment items were introduced that the crews needed to be aware of, and respond to. In the 4572 m simulation, the crews missed overall 28 AoE items compared to 12 in the 0 m simulation (Z = −1.992; p = .046). In contrast, the crews’ technical skills were not significantly effected by hypoxia. Remarkably, the majority of pilots did not notice they were hypoxic or recognise their hypoxia symptoms during the simulation flight at 4572 m.
Practitioner summary We show that hypoxia has a detrimental effect on helicopter pilot’s AoE and alertness. This can lead to an increased risk for flight safety. To mitigate this risk we recommend performing hypoxia training in a flight simulator, developing wearable systems for physiological monitoring of pilots and re-evaluating current altitude regulations.
Abbreviations: ANOVA: Analysis of variance; AoE: awareness of environment; CSV: comma-separated values; HDU: helmet display unit; HR: heart rate; IQR: interquartile range; Mdn: median; NTS: non-technical skills; RNLAF: Royal Netherlands Air Force; PPM: parts per million; SpO2: oxygen saturation; SSS: Stanford sleepiness scale; TS: technical Skills
Introduction
Helicopter cabins are not pressurised and are often not equipped with oxygen systems. Therefore, hypoxia is a hazard to helicopter pilots flying at altitude. Hypoxia is a state of insufficient oxygen in the blood, tissues, and/or cells (Boshers Citation2015). To prevent hypoxia-related incidents there are altitude and flight duration restrictions for helicopter crews. For example, the Royal Netherlands Air Force allows their helicopter pilots to fly up to 3962 m (13,000 ft) for a maximum duration of 30 min, whereas pilots of the United States Air Force are allowed to fly 30 min at 4267 m (14,000 ft) (Command AFSO, Citation2017). Nonetheless, helicopter pilots have reported experiencing hypoxia symptoms even at altitudes below 3048 m (10,000 ft), where it is considered safe to fly (Haerkens and Steen Citation2007; Nishi Citation2011; Smith Citation2005).
Research has shown that hypoxia negatively effects cognitive processes such as working memory (Bustamante-Sánchez, Delgado-Terán, and Clemente-Suárez Citation2019; Legg et al. Citation2014; Malle et al. Citation2013), information processing (Bartholomew et al. Citation1999), decision making (Legg et al. Citation2012; Pighin et al. Citation2020), and reaction time (Davranche et al. Citation2016). However, most of the research used standard cognitive tests, and it is unclear if the results of these tests can be translated to tasks that pilots perform during operational flight (Petrassi et al. Citation2012). A few studies specifically investigated the effects of hypoxia on pilot performance in a simulated flight environment (Bouak et al. Citation2018; Gold and Kulak Citation1972; Nesthus, Rush, and Wreggit Citation1997; Peacock et al. Citation2017; Steinman et al. Citation2017; Temme, Still, and Acromite Citation2010). In some of these studies, hypoxia induced significant errors in flight performance, such as larger deviations in airspeed and altitude (Gold and Kulak Citation1972; Temme, Still, and Acromite Citation2010), or an increased number of procedural errors (Bouak et al. Citation2018; Nesthus, Rush, and Wreggit Citation1997). In other studies, no significant effects on flight performance were found (Peacock et al. Citation2017; Steinman et al. Citation2017). The emphasis in these simulator studies was on pilots’ technical skills (TS), i.e. skills needed to control the aircraft, and manage aircraft systems.
In addition to TS, during flight pilots also rely on their non-technical skills (NTS), which are the cognitive and social skills needed for effective and safe flight (Flin et al. Citation2003). In a recent study, helicopter flight instructors of the Royal Netherlands Air Force (RNLAF) concluded that pilots’ NTS are most important during operational flight, and are highly sensitive for reduced alertness (Steinman et al. Citation2019). Reduced alertness can occur during flight under hypoxic conditions (Steinman et al. Citation2017). The flight instructors considered awareness of environment (AoE) to be the NTS most sensitive to reduced alertness. AoE is defined as an active knowledge of the current position, future position, weather, air traffic, and terrain during flight (Flin et al. Citation2003). It requires attention (Vidulich et al. Citation2010) and vigilance (Shook et al. Citation2000), both of which may be impaired by reduced alertness (Wright and McGown Citation2001).
In this study, our primary aim was to investigate the effect of hypoxia on the AoE of helicopter crews during operational missions performed in a flight simulator. We hypothesised that the AoE would be impaired during a flight at a simulated altitude of 4572 m (15,000 ft), but not during a flight at 0 m (sea level). Our secondary aim was to determine the effect of hypoxia on pilots’ alertness during the 4572 m simulation. We hypothesised that alertness would be significantly lower at the end of the 4572 m simulation compared to the alertness after the 0 m simulation.
Materials and methods
Participants
Eight Apache helicopter crews (16 pilots with an average age of 30 ± 5.2 years and 1216 ± 842.8 total flight hours) of the RNLAF volunteered for the experiment. Each Apache helicopter crew included a front-seat pilot and a back-seat pilot.
The sample size was calculated with an a-priori power analysis using a power of 0.8, an alpha of 0.05, and an effect size of 0.4. The effect size was calculated using previously reported data on the effect of hypoxia on pilot alertness (Steinman et al. Citation2017).
Pilots were recruited through a presentation about the study given at the squadron. They were invited to participate in the study in an email containing information about the study. To be included, pilots needed to have passed their mandatory yearly medical examination and be declared ‘fit to fly’. Pilots were excluded if they had been at altitudes higher than 2438 m for longer than a week three months before the study started. All the pilots participating in the study receive hypoxia training every five years at the hypobaric chamber and are familiar with their individual hypoxia symptoms.
The experimental procedure was explained to all participating pilots, who then gave their voluntary written informed consent. The study protocol was approved in advance by the Medical Ethical Committee of the Amsterdam Academic Medical Centre (2019_056#B2019493).
Design
This study employed a single-blinded, repeated measures, counter-balanced design. The conditions were counter-balanced to minimise potential order effects. In the present study the crews were exposed to normobaric hypoxia simulating altitudes of 0 m and 4572 m (15,000 ft). In normobaric hypoxia the oxygen fraction in the inhaled air is artificially reduced without changing barometric pressure. Both simulated altitudes and flight profile (e.g. see section ‘Flight and mission profiles’ for details on both flight 1 and 2) were randomly assigned using an online randomisation software program (www.randomiser.com). Only the researcher present on test day was aware of the exact order of altitude the crews would be exposed to.
Study variables
To evaluate AoE during each flight, various environment items were introduced, such as power lines, altered wind speed or direction, and restricted flight zones. The crews needed to be aware of these items and consider them to complete the mission objectives effectively. In addition, during the performance of the missions, we also evaluated the crews’ TS by monitoring their ability to correctly use the helicopter system, perform system checks, perform standard and advanced flight manoeuvres, and perform standard and emergency procedures in accordance with the Apache helicopter flight manual. Both AoE and TS items were assessed by a weapon instructor in a dichotomous way (‘yes’ or ‘no’) on an evaluation form that included all items.
The pilots’ self-perceived state of alertness was measured using the Stanford Sleepiness Scale (SSS) (Hoddes et al. Citation1973). The SSS is a seven-point Likert-type scale with descriptors ranging from ‘feeling active, vital, alert, or wide awake’ (score = 1) to ‘no longer fighting sleep, sleep onset soon, and having dream-like thoughts’ (score = 7). The pilots rated their alertness at the start of the flight just before being connected to the gas mixture, and at the end of the flight just before being disconnected from the gas mixture.
For control purposes, pilots’ heart rate (HR; bpm) and oxygen saturation (SpO2; %) were continuously monitored during both flights. The pilots’ HR and SpO2 were monitored using a Nonin 3150 (Nonin Medical Inc., Plymouth, MN) worn on the left wrist, together with a Nonin 8000 J Flex Sensor that was placed on the left ring finger. To blind the pilots to the condition, the HR and SpO2 parameters were not displayed on the 3150 screen, but on an external screen visible only to the researcher. The screen was connected to the Nonin 3150 via Bluetooth using the NoninConnect™ app. Nonin nVision® (version 6.5.1) software was used to convert the HR and SpO2 data stored on the Nonin 3150 to a CSV file.
Equipment
Flight simulations took place in the Longbow Crew Trainer AH-64-N-LCT10-L13 (Boeing, Chicago, IL, USA) located at the Defense Helicopter Command of the RNLAF. This simulator consists of two separate cockpits; one for the front-seat pilot and one for the back-seat pilot. The simulator is an identical copy of the real cockpit, with all sensors and flight capabilities of the real helicopter.
Hypoxia was induced using a gas mixture. Pilots breathed 11.4% oxygen (equivalent to an altitude of 4572 m, or 15,000 ft), in or 20.9% oxygen (equivalent to an altitude of 0 m) via an MBU-20P (Gentex corp, Zeeland, MI, USA) oxygen mask. The mask was connected via a pressure-reducing valve to a 10-L high-pressure gas cylinder. Gas flow was controlled using an FL 32 flowmeter (Spectron Gas Control Systems GmbH, Frankfurt, Germany) with a flow range between 2 and 16 L/min.
Flight and mission profiles
Two flight profiles were prepared to prevent the same flight conditions affecting the study outcome. This approach prevented the crew from planning their actions in advance. Each flight consisted of five missions (described in detail below). The flight profiles and mission scripts were prepared by flight simulator instructors skilled in designing training missions for the flight simulator and evaluating pilots’ ability to perform in-flight procedures. An Apache helicopter weapon instructor (a flight instructor who specialises in educating and training pilots in flight tactics) checked whether the flight profiles and mission scripts corresponded to operational practice.
Flight 1 was set in a mountainous environment and flight 2 was set in a wooded environment, but similar environment items were introduced during both flights. Flight 1 included 14 environment items and 37 TS items, and flight 2 included 16 environment items and 37 TS items (). Both flights started on the ground with the engines turned off. The crews performed a shortened start-up procedure, during which 16 TS items were monitored. This phase lasted approximately 15 min. During the flight, the crew received their mission and were guided to their targets by mission control or ground forces (played by the simulator instructor or weapon instructor). Each crew performed each mission only once. After completing a mission, they reported the mission outcome to mission control. Only then they received their next mission.
Table 1. Overview of the awareness of environment items introduced in each mission. Items only introduced during flight 1 are shown on the left and items only introduced during flight 2 are shown on the right.
The first mission in both flights was to identify and destroy an armoured target in an urban area. The crew had to fly low, watch out for power lines, and avoid being detected by enemy forces. When faced with unexpected enemy movement, the crews had to replan their route to the attack position. In flight 1, the crew had to find a nine-story building from their attack position to locate their target. In flight 2, the crew had to plan their route with a restricted operating zone (a volume of airspace in defined dimensions where all or some airspace users are restricted from entering) in mind, notice friendly forces near the target location, and use ground forces to mark the target.
The second mission was to locate and destroy a radar array on a mountain top in flight 1, and to locate and attack an enemy stronghold in flight 2. In both flights, the crews had to find their targets using coordinates and a description of the target, while being aware of friendly forces near the target area. Because of a targeting laser failure, the crew had to perform the attack using the target’s coordinates. They also needed to make sure that they broke the attack at the correct distance.
The third mission in both flights was to find and destroy a mortar position in an urban area. The crew needed to find the target using directions given to them by ground forces. In their attack plan, the crew needed to consider a restricted operating zone in the attack area as well as a vertical line (flight 1) or a horizontal line (flight 2) they were not allowed to cross during or after the attack.
The fourth mission in both flights was to fly to a point and land for refuel. The crew received a landing direction, but the wind direction and wind speed changed on approach creating unfavourable landing conditions. In response, the crew had to adjust their landing direction accordingly.
The fifth mission in both flights was to respond to progressively deteriorating weather conditions that made flying unsafe on route to their final destination.
Procedure
Both flights took place on the same day, and both altitudes were simulated using gas mixtures. In the 0-ft condition, the crew breathed compressed air containing 20.9% oxygen with the remainder nitrogen, and in the 4572 m condition, a gas mixture containing 11.4% ± 1% oxygen with the remainder nitrogen and 400 PPM carbon dioxide.
In a fitting session one week before test day, the pilots could ask questions about the study, the test-day procedure was explained and a MBU-20/P mask fitting was performed in accordance with the Gentex MBU-20/P fitting procedure (MD 5901-00001 A). The mask was fixed to the pilot’s face using a headband. The hard shell of the mask was trimmed so it could be worn together with the Apache helmet display unit (HDU). After the mask was fitted and tested for leakage, the pilots put on their helmets and attached the HDU. Each pilot then manoeuvred the HDU to its normal position during flight. If necessary, the hard shell of the mask was trimmed so the HDU could be correctly positioned.
On test day, the pilots arrived at the flight simulator at 08:00. They received essential information regarding the first mission and general information regarding the other four missions. The crews had 30 min to prepare for the flight, and any questions were answered by the weapon instructor. The crews were told they had 90 min to finish all five missions, and that all TS items should be performed in accordance with the flight manuals. They were also warned that hostile forces were very aggressive and that they should avoid being detected by them. The crews were instructed to report if they felt hypoxic, and which symptoms they were experiencing. After the briefing, crew members were fitted with the MBU-20/P mask and Nonin sensor and moved to the flight simulator. Once in the flight simulator, the pilots checked that they had a full HDU field of view and that they were able to move their head freely. In addition, all measurement systems were checked. Before being connected to the gas mixture, the pilots self-assessed their alertness using the SSS.
The second flight started 90 min after the mask was removed following the first flight. During that time, the pilots could rest, eat, and drink. Once both flights were completed, the participants were debriefed. During the debrief, crew members were asked three questions:
Can you tell in which of the two flights you were exposed to 4572 m?
Did you notice that you were hypoxic during the flight?
Can you recall whether the hypoxia symptoms you experienced during the 4572 m flight were same as those experienced during hypobaric chamber training?
The weapon instructor also gave general feedback to the crews about their flight performance.
Data analysis
IBM SPSS 26 was used for data analysis. Normality of the data was checked using frequency distributions. A non-parametric analysis was used when the data were not normally distributed. The total numbers of forgotten AoE and TS items were compared between the two conditions using a Wilcoxon signed-rank analysis. Because the two flights did not include the same number of AoE items, a ratio correction was applied first by dividing the total forgotten AoE items by the total number of items. Differences in pilots’ alertness levels between and within the flights were analysed using a repeated measures ANOVA.
Mission durations (from start-up to end of the mission) were compared between flights using a Wilcoxon signed-rank analysis. The flight time between the missions was also analysed.
Before analysing the physiological data, all missing values were removed. HR and SpO2 data were averaged from the beginning till the end of the flight at each simulated altitude. The differences in HR and SpO2 between flights were analysed using a paired-samples t-tests. The level of significance for all comparisons was set at p < .05.
Results
Data exclusion
Eight crews participated in the study, but the data of only seven crews (14 pilots) were analysed; the weapon instructor was not able to evaluate the entire 4572 m flight of one crew, so the data of this crew were excluded from the analysis. Data from mission four were also excluded because the weapon instructor noticed that three crews (40%) did not consider the wind direction and wind speed during approach. During the debrief, the crew members explained that they normally follow the landing direction they receive from air traffic control even if it is not optimal. Data from mission five was also excluded from analysis because four crews (60%) in the 4572 m condition reached the 90-min time limit before they could start the mission. The duration of missions two and three in the 4572 m condition were also not analysed for one crew because the flight simulator needed to be rebooted during these missions, resulting in inaccurate time measurement.
AoE
As shown in , the number of AoE items missed during each of the missions did not significantly differ between the 0 m and the 4572 m condition. However, the total number of missed AoE items, cumulated over the first three missions, differed significantly (Z = −1.992; p = .046) between the 0 m condition (Mdn = 1; IQR = 1–2) and the 4572 m condition (Mdn = 4; IQR = 3–6). Overall, the crews missed 28 AoE items in the 4572 m condition compared to 12 AoE items in the 0 m condition ().
Figure 1. Visual representation of the Awareness of Environment (AoE) results for each crew in both conditions. Black cells represent items that were correctly noticed or performed. White cells represent items that were missed. Yellow cells represent missing values and blue cells represent the two extra AoE items in flight 2.
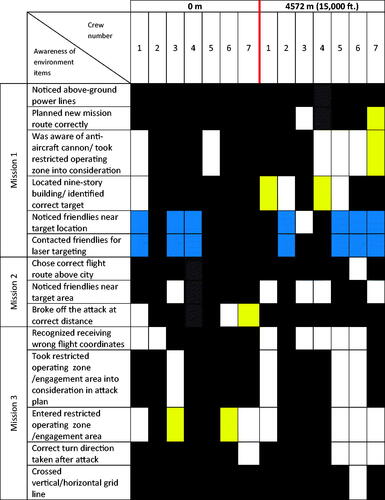
Table 2. Medians and inter-rate quartile of the crews awareness of environment (AoE), technical skills (TS) and mission duration (Duration) ratings during star-up, each of the three missions and cumulative (from start-up till the end of mission 3) at 0 m and 4572 m.
TS and flight duration
also shows that the number of forgotten, or incorrectly performed, TS did not significantly differ between the 0 m and the 4572 m condition for each of the missions. Cumulative over the first three missions more TS were forgotten, or incorrectly performed in the 4572 m condition (Mdn = 5; IQR = 3–5) than in the 0 m condition ((Mdn = 3; IQR = 2–5). However, this difference was not statistically significant (Z = −0.677; p = .498). Furthermore, there was no significant difference in the time it took the crews to complete each of the three missions. The average flight duration (from start-up till the end of mission 3) was 7 min longer in the 4572 m condition (Mdn = 75; IQR = 71–82) than in the at 0 m condition (Mdn = 68; IQR = 62–73), but this difference was not statistically significant (Z = −1.577; p = .115).
Alertness
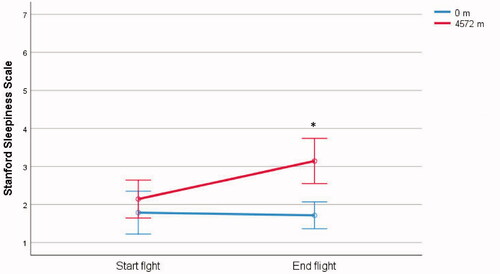
Pilots’ SSS scores were significantly higher (higher scores indicates higher sleepiness, and thus decreased alertness) at the end than at the start of the 4572 m flight (3 ± 1.02 versus 2 ± 0.61; F(1, 13) = 35.48; p = .001; η2 = .732) (). At 4572 m, pilot alertness dropped from ‘functioning at high level, but not at peak’ at the start of the flight to ‘awake, but relaxed; responsive but not fully alert’ at the end of the flight. At 0 m, SSS scores were not significantly different between the start and the end of the flight (F(1, 13) = 3.493; p = .084). At both altitudes, there was a significant interaction between SSS scores at the start and end of the flights (F(1,13) = 8.381; p = .013; η2 = .392) . A paired sample t-test revealed a significant difference in SSS scores at the end of both conditions (t(13) = −2.55, p = .024). Pilots’ SSS scores were higher at the end of the 4572 m flight (3 ± 1.02) than at the end of the 0 m flight (2 ± 0.86), but were not significantly different at the start of the flight at both altitudes (t(13) = −0.366, p = .720) ().
Figure 2. Pilots’ Stanford Sleepiness Scale (SSS) scores (higher scores correspond with lower alertness) at the start and end of each flight at 0 m and 4572 m. The scores are presented as mean and SD. * indicates a p-value >.05 indicating a significant difference between SSS scores before the flight at 4572 m and after the flight at 0 m.
Debrief
In answer to the question ‘Can you tell in which of the two flights you were exposed to 4572 m?’ six crews (84%) correctly indicated in which of the flight conditions of 4572 m were simulated; two crews (16%) could not.
In answer to the question ‘Did you notice that you were hypoxic during the flight?’ one pilot (7%) said he was aware of becoming hypoxic during the 4572 m flight – and he did not report this while flying. The other 13 pilots (93%), including two pilots who reported having a headache, said that they not aware of becoming hypoxic.
In answer to the question ‘Can you recall whether the hypoxia symptoms you experienced during the 4572 m flight were same as those experienced during hypobaric chamber training?’ two pilots (14%) said the symptoms were the same, four pilots (29%) said that symptoms were not evident, and eight pilots (57%) said the symptoms were not the same.
Physiological data
SpO2 levels were significantly lower at 4572 m than at 0 m (81 ± 3 versus 97 ± 1; t(13) = 16.61; p = .001). No significant difference was found in HR between 0 m and 4572 m (87 ± 15 versus 90 ± 14; t(13) = −.653; p = .525)
Discussion
In line with our expectations, this simulator study showed that exposure to hypoxic conditions (4572 m) significantly affected the AoE of helicopter crews during operationally relevant flight scenarios. In addition, similar to previous observations (Steinman et al. Citation2017), the alertness of the pilots was significantly reduced after the 4572 m flight, but not after the 0 m flight. It is likely that the reduced alertness contributed to the impairment of AoE, because alertness is required to maintain vigilance and attention (Wright and McGown Citation2001), both of which are essential for AoE (Shook et al. Citation2000; Vidulich et al. Citation2010). In contrast to the effect on AoE, our results did not show a significant effect of hypoxia on the crews’ ability to perform TS. This observation supports the prediction, made by flight instructors in a previous study, that NTS are more effected by hypoxia compared to TS25.
Although we did not find literature specifically addressing the effects of hypoxia on pilots’ AoE, some studies seem to provide indirect evidence for the effect of hypoxia on AoE. For example, Nesthus, Rush, and Wreggit (Citation1997) evaluated the performance of private pilots during simulated flights while breathing gas mixtures corresponding to altitudes of 2438, 3048 and 3810 m (8000, 10,000, and 12,500 ft respectively). They observed that pilots who were exposed to 3048 m and 3810 m made more procedural errors during descent and approach than pilots who were breathing sea-level air. These errors included premature manoeuvres, landing in the wrong location, and failing to recognise an airport. In another simulator study with fighter pilots, exposure to a simulated altitude of 7620 m (25,000 ft) induced procedural errors, such as approach to a wrong runway, flying into a thunderstorm, and too high airspeed during approach (Varis, Parkkola, and Leino Citation2019). The errors observed in both studies are indicative of impaired AoE.
All pilots participating in this study undergo hypobaric chamber training every five years, where they learn how to recognise hypoxia symptoms. During this training they are exposed to a simulated altitude 4267 m (14,000 ft). In the present study the simulated altitude was of 4572 m, that is slightly above the altitude of the hypobaric chamber training. Therefore, we assumed that the pilots would experience and recognise symptoms of hypoxia during the 4572 m flight. However, only two pilots (15%) reported having a headache during the 4572 m condition, and one pilot (7%) reported hypoxia symptoms in the 0 m condition. This could be the result of exposing the pilots to normobaric hypoxia (using a gas mixture with reduced oxygen level), instead of hypobaric hypoxia (partial oxygen pressure is reduced as a result of a decrease in barometric pressure (Gradwell and Rainford Citation2016)) that occurs in the hypobaric chamber. However, we do not think this entirely explains the lack of symptom recognition, as some studies comparing normobaric and hypobaric hypoxia did not find differences in symptoms between the two conditions (Deussing, Artino, and Folga Citation2011; Singh et al. Citation2010), whereas others did (Aebi et al. Citation2020). We think it is more likely that the lack of symptom recognition was related to workload, because the pilots in our study were actively involved in a demanding flight task, whereas in hypobaric chamber training they typically sit at ease while focussing on their symptoms. In fact, all pilots participating in the study, including the weapon instructor, expressed the opinion that flying operational missions in a flight simulator while being exposed to hypoxia is more useful for demonstrating the effect of hypoxia on pilot performance than the current hypoxia training they receive.
A possible limitation of the present study was that the 90-min rest time between the two flights may not have been enough for the crew members to sufficiently recover. Therefore, fatigue may have influenced the crews’ performance during the second flight. However, the counter-balanced design minimised the potential of this effect. In addition, the SSS scores were not significantly different at the beginning of the two flights, suggesting that 90 min was sufficient to recover. Another limitation was the exclusion of data of missions four and five from the analysis potentially effecting the results. We report no statistically significant effect of exposure of hypoxia on flight duration, although four crews (60%) in the 4572 m condition, compared to one crew (14%) in the 0 m condition, reached the 90 min time limit before starting mission five. It appears therefore that the exclusion of data may have resulted in an underestimation of the effect of exposure to hypoxia on flight duration.
The results of this study add to the accumulating evidence that pilot performance is affected by hypoxia at moderate altitudes (2438–4572 m/8000–15,000 ft) (Gold and Kulak Citation1972; Nesthus, Rush, and Wreggit Citation1997; Petrassi et al. Citation2012). This can lead to an increased risk for flight safety. We propose several recommendations to mitigate this risk. First, we recommend that helicopter pilots receive simulator-based hypoxia training in addition to their standard hypoxia training in the hypobaric chamber. Simulator-based training can demonstrate the effects of hypoxia on flight performance, especially AoE, in an realistic environment that has direct relevance to the pilots. Second, because the pilots in this study did not recognise hypoxia symptoms while they were engaged in an operational scenario’s, research should investigate the possibility of in-flight physiological monitoring technologies that will monitor physiological parameters, such as oxygen saturation and heart rate, and alert the pilots when it detects a change in a physiological parameter that can effect flight performance. Third, while the data for this study were gathered at an altitude slightly higher than allowed in the regulation, we feel that our results, and the results of other studies, call for a discussion about the current regulations regarding the altitude at which the use of supplementary oxygen in (military) helicopters should be mandatory.
Conclusion
Our results indicate that hypoxia experienced during a 4572 m flight leads to impaired AoE and reduced alertness of helicopter crews.
Acknowledgments
The authors would like to thank the Helicopter Defense Command of the RNLAF including the Longbow Crew Trainer instructors and the Weapon Instructor of the 301 Apache squadron for the excellent support they provided for the present study.
Disclosure statement
The authors have no financial interests to disclosure. The opinions expressed in this article are solely those of the authors and do not reflect the views of the Dutch Air Force, the Dutch Defense Department, or any other department of the Dutch government.
Data availability statement
The data that support the findings of this study are available from the corresponding author, [YS], upon reasonable request.
Correction Statement
This article has been corrected with minor changes. These changes do not impact the academic content of the article.
References
- Aebi, M. R., N. Bourdillon, P. Noser, G. P. Millet, and D. Bron. 2020. “Cognitive Impairment during Combined Normobaric vs. Hypobaric and Normoxic vs. Hypoxic Acute Exposure.” Aerospace Medicine and Human Performance 91 (11): 845–851. doi:https://doi.org/10.3357/AMHP.5616.2020.
- Bartholomew, C. J., W. Jensen, T. V. Petros, F. R. Ferraro, K. M. Fire, D. Biberdorf, E. Fraley, J. Schalk, and D. Blumkin. 1999. “The Effect of Moderate Levels of Simulated Altitude on Sustained Cognitive Performance.” International Journal of Aviation Psychology 9 (4): 351–359. doi:https://doi.org/10.1207/s15327108ijap0904_3.
- Boshers, L. 2015. “Beware of Hypoxia: United States Department of Transportation.” Available from: https://www.faa.gov/pilots/training/airman_education/topics_of_interest/hypoxia/.
- Bouak, F., O. Vartanian, K. Hofer, and B. Cheung. 2018. “Acute Mild Hypoxic Hypoxia Effects on Cognitive and Simulated Aircraft Pilot Performance.” Aerospace Medicine and Human Performance 89 (6): 526–535. doi:https://doi.org/10.3357/AMHP.5022.2018.
- Bustamante-Sánchez, Á., M. Delgado-Terán, and V. J. Clemente-Suárez. 2019. “Psychophysiological Response of Different Aircrew in Normobaric Hypoxia Training.” Ergonomics 62 (2): 277–285. doi:https://doi.org/10.1080/00140139.2018.1510541.
- Command AFSO. 2017. “AIR Force Instruction 11-202, AFI11-202V3.” Air Force Special Operations Command; p. 29.
- Davranche, K., L. Casini, P. J. Arnal, T. Rupp, S. Perrey, and S. Verges. 2016. “Cognitive Functions and Cerebral Oxygenation Changes during Acute and Prolonged Hypoxic Exposure.” Physiology & Behavior 164 (Pt A): 189–197. doi:https://doi.org/10.1016/j.physbeh.2016.06.001.
- Deussing, E. C., A. R. Artino, Jr., and R. V. Folga. 2011. “In-Flight Hypoxia Events in Tactical Jet Aviation: characteristics Compared to Normobaric Training.” Aviation, Space and Environmental Medicine 82 (8): 775–781. doi:https://doi.org/10.3357/asem.2941.2011.
- Flin, R., L. Martin, K-M. Goeters, R. Amalberti, C. Valot, and H. Nijhuis. 2003. “Development of the NOTECHS (Non-Technical Skills) System for Assessing Pilots’ CRM Skills.” Human Factors and Aerospace Safety 3 (2): 95–117.
- Gold, R. E., and L. L. Kulak. 1972. “Effect of Hypoxia on Aircraft Pilot Performance.” Aerospace Medicine 43 (2): 180–183.
- Gradwell, D., and D. J. Rainford. 2016. Ernsting's Aviation and Space Medicine 5E. Boca Raton, FL: CRC Press.
- Haerkens, M. H. T. M., and J. Steen. 2007. “The Possible Need for Supplementary Oxygen in AD-64D Night Operations.” Human Factors and Medical Aspects of Day/Night All Weather Operations: Current Issues and Future Challenges HMF-141; 2007 April 23–25; Crete: NATO Research and Technology Organisation.
- Hoddes, E., V. Zarcone, H. Smythe, R. Phillips, and W. C. Dement. 1973. “Quantification of Sleepiness: A New Approach.” Psychophysiology 10 (4): 431–436. doi:https://doi.org/10.1111/j.1469-8986.1973.tb00801.x.
- Legg, S., S. Hill, A. Gilbey, A. Raman, Z. Schlader, and T. Mündel. 2014. “Effect of Mild Hypoxia on Working Memory, Complex Logical Reasoning, and Risk Judgment.” The International Journal of Aviation Psychology 24 (2): 126–140. doi:https://doi.org/10.1080/10508414.2014.892751.
- Legg, S., S. Hill, T. Mundel, A. Gilbey, Z. Schlader, and A. Raman. 2012. “Could Mild Hypoxia Impair Pilot Decision Making in Emergencies?” Work 41 (Suppl 1): 198–203. doi:https://doi.org/10.3233/WOR-2012-0156-198.
- Malle, C., P. Quinette, M. Laisney, C. Bourrilhon, J. Boissin, B. Desgranges, F. Eustache, and C. Piérard. 2013. “Working Memory Impairment in Pilots Exposed to Acute Hypobaric Hypoxia.” Aviation, Space and Environmental Medicine 84 (8): 773–779. doi:https://doi.org/10.3357/asem.3482.2013.
- Nesthus, T. E., L. L. Rush, and S. S. Wreggit. 1997. “Effects of Mild Hypoxia on Pilot Performances at General Aviation Altitudes.” Civil Aeromedical Institute; FAA; April. Report No.: DOT/FAA/AM-97/9.
- Nishi, S. 2011. “Effects of Altitude-Related Hypoxia on Aircrews in Aircraft with Unpressurized Cabins.” Military Medicine 176 (1): 79–83. doi:https://doi.org/10.7205/milmed-d-09-00213.
- Peacock, C. A., R. Weber, G. J. Sanders, Y. Seo, D. Kean, B. S. Pollock, K. J. Burns, M. Cain, P. LaScola, and E. L. Glickman. 2017. “Pilot Physiology, Cognition and Flight Performance during Flight Simulation Exposed to a 3810-m Hypoxic Condition.” International Journal of Occupational Safety and Ergonomics 23 (1): 44–49. doi:https://doi.org/10.1080/10803548.2016.1234685.
- Petrassi, F. A., P. D. Hodkinson, P. L. Walters, and S. J. Gaydos. 2012. “Hypoxic Hypoxia at Moderate Altitudes: review of the State of the Science.” Aviation, Space and Environmental Medicine 83 (10): 975–984. doi:https://doi.org/10.3357/asem.3315.2012.
- Pighin, S., N. Bonini, C. Hadjichristidis, F. Schena, and L. Savadori. 2020. “Decision Making under Stress: mild Hypoxia Leads to Increased Risk-Taking.” Stress 23 (3): 290–297. doi:https://doi.org/10.1080/10253890.2019.1680634.
- Shook, R. W., M. Bandiero, J. P. Coello, D. J. Garland, and M. R. Endsley. 2000. Situation Awareness Problems in General Aviation. Proceedings of the Human Factors and Ergonomics Society Annual Meeting. Los Angeles, CA: SAGE Publications. doi:https://doi.org/10.1177/154193120004400149.
- Singh, B., G. G. Cable, G. V. Hampson, G. D. Pascoe, M. Corbett, and A. Smith. 2010. “Hypoxia Awareness Training for Aircrew: A Comparison of Two Techniques.” Aviation, Space and Environmental Medicine 81 (9): 857–863. doi:https://doi.org/10.3357/asem.2640.2010.
- Smith, A. 2005. “Hypoxia Symptoms Reported during Helicopter Operations below 10,000 ft: A Retrospective Survey.” Aviation, Space and Environmental Medicine 76 (8): 794–798.
- Steinman, Y., M. van den Oord, M. H. W. Frings-Dresen, and J. K. Sluiter. 2019. “Flight Performance Aspects during Military Helicopter Flights.” Aerospace Medicine and Human Performance 90 (4): 389–395. doi:https://doi.org/10.3357/AMHP.5226.2019.
- Steinman, Y., M. van den Oord, M. H. W. Frings-Dresen, and J. K. Sluiter. 2017. “Flight Performance during Exposure to Acute Hypobaric Hypoxia.” Aerospace Medicine and Human Performance 88 (8): 760–767. doi:https://doi.org/10.3357/AMHP.4789.2017.
- Temme, L., D. Still, and M. T. Acromite. 2010. “Hypoxia and Flight Performance of Military Instructor Pilots in a Flight Simulator.” Aviation, Space, and Environmental Medicine 81 (7): 654–659. doi:https://doi.org/10.3357/asem.2690.2010.
- Varis, N., K. I. Parkkola, and T. K. Leino. 2019. “Hypoxia Hangover and Flight Performance after Normobaric Hypoxia Exposure in a Hawk Simulator.” Aerospace Medicine and Human Performance 90 (8): 720–724. doi:https://doi.org/10.3357/AMHP.5289.2019.
- Vidulich, M. A., C. D. Wickens, P. S. Tsang, and J. M. Flach. 2010. “Chapter 7 – Information Processing in Aviation.” In Human Factors in Aviation, edited by E. Salas and D. Maurino, 2nd ed., 175–215. San Diego: Academic Press.
- Wright, N., and A. McGown. 2001. “Vigilance on the Civil Flight Deck: Incidence of Sleepiness and Sleep during Long-Haul Flights and Associated Changes in Physiological Parameters.” Ergonomics 44 (1): 82–106. doi:https://doi.org/10.1080/00140130150203893.