
 ?Mathematical formulae have been encoded as MathML and are displayed in this HTML version using MathJax in order to improve their display. Uncheck the box to turn MathJax off. This feature requires Javascript. Click on a formula to zoom.
Abstract
The Revised Strain Index (RSI), a model that quantifies physical exposure from individual hand/wrist exertions, tasks, and multi-task jobs, was used to quantify exposure for 1372 incident-eligible manufacturing, service and healthcare workers. Workers were followed for an average of 2.5 years (maximum 6 years) and had an average carpal tunnel syndrome (CTS) incidence rate of 4.6 per 100 person-years. Exceeding the a-priori RSI limit of 10.0 showed increased risk of CTS (Hazard Ratio (HR) = 1.45, 95% CI: 1.11–1.91, p = 0.01). There also was a dose-response relationship using proposed low (RSI ≤ 8.5, HR = 1.00), medium (HR = 1.42 (95% CI: 0.96–2.09, p = 0.08)), and high limits (RSI > 15, HR = 1.79 (95% CI: 1.19–2.69, p = 0.01), respectively. RSI as a continuous variable showed CTS risk increased steadily by between 1.9% and 3.3% per unit increase in RSI (p ≤ 0.03). These results suggest that the RSI is a useful tool for surveillance as well as for job intervention/design and continuous improvement processes.
Practitioner Summary The Revised Strain Index (RSI) quantifies physical exposure from individual hand/wrist exertions, tasks, and multi-task jobs. Increased cumulative RSI scores (i.e. daily exposure score) are associated with increased risk of carpal tunnel syndrome (CTS). The RSI is potentially useful as a risk surveillance and intervention design tool.
Introduction:
In 1995, Moore and Garg (Citation1995) developed a multi-factorial, semi-quantitative distal upper extremity (DUE) physical-exposure assessment tool called the Strain Index (1995 SI). The 1995 SI was developed based on biomechanical and physiological principles and informed by epidemiological findings. The underlying principle of the 1995 SI was that the physical demands of a job (i.e. physical exposure), measured by a numerical score, determine the magnitude of risk for developing DUE musculoskeletal disorders (MSDs) while performing that job. The model consisted of six multiplicatively interactive variables that categorically described: (i) the exertion requirements of the task (i.e. applied force), which reflected the tensile load and was the most heavily weighted variable, (ii) the frequency of hand exertions, which was the primary repetition variable, (iii) percent duration of exertion (i.e. duty-cycle) that reflected available recovery time, (iv) hand/wrist posture, which accounted for compressive loads associated with directional changes of tendons, (v) ‘speed of work’, which accounted for reduced recovery associated with highly dynamic tasks, and (vi) duration of task per day, which determined the daily dose of exposure. The product of the multipliers associated with these six variables was the SI score which was designed to correlate with hand/wrist physical exposure and thus risk of DUE MSDs (Moore and Garg Citation1995; Garg and Kapellusch Citation2011).
Early testing of the 1995 SI showed predictive validity with general, task-level DUE morbidity in meat processing and manufacturing industries (Moore and Garg Citation1995; Knox and Moore Citation2001; Rucker and Moore Citation2002). More recently, the 1995 SI has shown predictive validity in prospective cohort studies of specific DUE MSDs such as CTS (Silverstein et al. Citation2006, Garg, Kapellusch, et al. Citation2012), lateral and medial epicondylalgia (Fan et al. Citation2014; Garg et al. Citation2014), hand/wrist tendinitis (Harris-Adamson et al. Citation2014), and trigger digit (Kapellusch et al. Citation2014). As of 2019 the 1995 SI was reported as among the most widely used distal upper extremity assessment methods used by ergonomics professionals in the United States and Canada (Lowe, Dempsey, and Jones Citation2019).
Despite its strengths, the 1995 SI has some noteworthy limitations that reduced its practical utility outside of either research applications or detailed job analyses of a single job (Garg and Kapellusch Citation2011, Garg, Moore, and Kapellusch Citation2017a). Specifically, the model requires detailed time-studies to quantify frequency and duty cycle, the speed of work variable is challenging to quantify, and the tool lacks direct ability to account for complex tasks with multiple hand-force requirements, postures, or durations per exertion (Garg and Kapellusch Citation2011; Garg, Kapellusch, et al. Citation2012, 2017a). These make the 1995 SI time-consuming to use and mostly limited to simple tasks with only a single type of exertion – which are a shrinking minority of today’s workplace tasks. The 1995 SI may also prove unreliable as a tool to guide interventions over time since considerable professional expertise is embedded within the score, e.g. multiple experts may calculate considerably different scores for one job and/or over time. Utility as an intervention/design tool is further constrained by the use of categorical variables that limit ability to make fine discriminations between tasks, discourage small reductions in physical exposure during intervention, and generally interfere with using the SI score as a smooth, continuous variable.
To address these and other limitations of the 1995 SI, Garg, Moore, and Kapellusch (Citation2017a, Citation2017b) developed the Revised Strain Index (RSI). Built upon similar biomechanical and physiological constructs as those of the 1995 SI, and incorporating updated findings from numerous psychophysical studies of hand/wrist exertions, the RSI quantifies hand/wrist physical exposure using five factors: (i) intensity of exertion, (ii) hand/wrist posture during exertion, which combined with intensity of exertion represents the compressive and tensile forces on muscle-tendon units; (iii) duration per exertion; (iv) frequency of exertion which when combined with intensity, duration and posture, reflects strain on the muscle-tendon units; and (v) duration of task per day which reflects the dose of daily exposure (Garg, Moore, and Kapellusch Citation2017a). Speed of work was eliminated from the model, as its effect was embedded in the multipliers of the frequency and duration per exertion variables.
Whereas the 1995 SI was designed to quantify physical exposure from simple, mono-task jobs, the RSI was designed to handle an array of exposure circumstances ranging from: (i) analysis of simple tasks, or single-exertions (i.e. simple RSI, Garg, Moore, and Kapellusch Citation2017a), to (ii) complex tasks with widely varying force, duration, and posture requirements among exertions (i.e. composite RSI, Garg, Moore, and Kapellusch Citation2017b), and (iii) multi-task jobs and job-rotation environments (i.e. cumulative RSI, Garg, Moore, and Kapellusch Citation2017b) with exposures up to 12 hours per day. Further, rather than the simple categorical variables of the 1995 SI, the RSI uses continuous variables that provide a smooth increase in RSI scores as the five underlying model factors increase in magnitude. Thus, the RSI can be used for a variety of purposes ranging from walk-through surveillance (using the simple RSI and assumptions of overall force and average duration per exertion), to detailed task and job design (using time-study and the composite and cumulative RSI, respectively). RSI can also be used to do comparative analyses of exertion requirements for different hand-tools, adding to its capabilities as an engineering design and decision-analysis tool.
The RSI was designed to facilitate objective and discrete analyst decisions. Removal of the subjectively determined ‘speed of work’ variable, improved fidelity of measurement and guidance for quantifying intensity of exertion, and the ability to quantify RSI for each individual exertion reduces assumptions and should lead analysts to conclusions that accurately reflect the work they sampled. Though currently untested, these improvements should result in intra- and inter-rater reliability for the RSI that exceed those of the 1995 SI.
The utility of the RSI presumes that its physical exposure estimates are strongly related to an increased likelihood of DUE MSDs. Therefore, the objective of this study is to begin a validation process for the RSI by establishing initial predictive validity using pooled incidence data from three large prospective cohort studies of carpal tunnel syndrome (CTS).
Methods:
The University of Wisconsin - Milwaukee Institutional Review Board approved this study (Protocol #14.019-UWM). All participating subjects provided written, informed consent.
From 2001 to 2010, the National Institute for Occupational Safety and Health (NIOSH) CTS consortium conducted prospective cohort studies of DUE MSDs (Dale et al. Citation2013). Three data collection sites from the consortium – The University of Utah, the University of Wisconsin - Milwaukee, and Washington State Department of Labour and Industries – had comprehensive data necessary to calculate RSI scores. These data included detailed information about both multi-task jobs and complex tasks performed during the study. In this context, multi-task jobs require workers to perform two or more tasks within a work day or work week, and complex tasks require workers to perform two or more different types of exertions (referred to as sub-tasks) to complete task performance (Kapellusch et al. Citation2013). Data were available for an initial cohort of 1,885 workers with 1372 incident-eligible workers included in these analyses after excluding baseline prevalent workers and those immediately lost to follow-up (see below).
Physical exposure data collection
Participants were recruited among voluntary workers performing diverse jobs in different industries. Workers and supervisors were interviewed at baseline to determine jobs and tasks performed. A data collection team, that was blinded to the health and health outcomes of workers, collected data for each task performed by each worker at the worksites (Bao et al. Citation2006; Silverstein et al. Citation2010; Garg, Hegmann, et al. Citation2012). Where possible direct measurements of applied forces were taken. Video recordings were made of each task and later analysed in laboratories (Garg, Hegmann, et al. Citation2012). Workers were re-assessed at least every 6 months during subsequent follow-ups to quantify physical exposure changes. Tasks were re-measured and video re-recorded if physical exposures had substantially changed.
Raw data were extracted from video recordings in laboratories by trained ergonomists. From both workplace job and task measurements, and videotape analyses, exposure variables were measured including: (1) ergonomic analyst’s estimated Borg CR-10 force rating based upon field information, including: direct measurement(s), force-matching, videotape observations, and interview information collected on-site, (2) duration per exertion (in seconds) for the exertion, (4) hand/wrist flexion/extension angles for each exertion, and (5) frequency of hand-wrist exertion (per minute). frequency, duration, and posture data were extracted during detailed time-studies of video data. During this process, individual exertions were grouped by type where exertions with equivalent force and posture requirements were aggregated together and had their duration per exertion averaged. These aggregated exertions were stored for later modelling and statistical analyses (Garg, Hegmann, et al. Citation2012, Kapellusch et al. Citation2013).
Quantifying cumulative RSI scores:
Exertion-level (i.e. sub-task) data were used to calculate RSI scores for each group of exertions a worker performed. The Composite Strain Index (COSI) algorithm was then applied to determine task-level RSI scores for the task (Composite RSI, Garg, Moore, and Kapellusch Citation2017b). Finally, composite RSI scores were combined with task-rotation information from workers and supervisors and the Cumulative Strain Index (CUSI) algorithm was used to determine each individual worker’s cumulative RSI score for his/her entire shift or job (Garg, Moore, and Kapellusch Citation2017b). Shift-level (i.e. ‘daily’) cumulative RSI scores were recalculated whenever a task substantially changed, or when task-rotation strategies changed for a given worker during follow-up.
Demographic, symptom, and electrodiagnostic data collection
Age, gender, and body mass index were collected at baseline by questionnaire. Height and weight were measured. Structured interviews were used to collect symptoms information including pain, numbness, tingling, and/or burning in the hand consistent with CTS. Symptoms were monitored monthly to every four months, depending on research site (Dale et al. Citation2013). Baseline electrodiagnostic studies were performed by trained physiatrists or electrodiagnostic technicians and then conducted either every 6 months or annually for all workers with either new or persistent symptoms consistent with CTS (Dale et al. Citation2013). Health data collection team members were blinded to the worker’s quantified job physical exposures.
Case definition of CTS:
This study used a CTS case definition which required both symptoms and an abnormal electrodiagnostic test consistent with CTS. Symptoms were tingling, numbness, pain and/or burning in two or more of the first four digits. To qualify, symptoms had to be present for seven or more consecutive days, or three or more times during the prior year. Nerve conduction was classified as abnormal if: (i) median motor latency >4.5 ms at 8 cm, or median sensory latency >3.5 ms at 14 cm, or mid-palmar latency >2.2 ms at 8 cm; AND (ii) ulnar sensory latency <3.7 ms at 14 cm, or medium- ulnar sensory latency difference >0.5 ms, or mid-palmar median-ulnar difference >0.3 ms (Silverstein et al. Citation2010). Workers were classified as CTS cases on the day they met both symptom and electrodiagnostic criteria. Workers either having been previously treated for CTS or having met the case definition at baseline were excluded from the incidence analyses reported in this manuscript.
Statistical analyses
This study uses only dominant hand data. Type I (alpha) error was set to 0.05 for all tests. Analyses were performed in R-64 version 3.6.3 for Macintosh (R Core Team Citation2020).
Time from baseline to first occurrence of CTS was modelled using Cox proportional hazard (PH) regression with time-varying covariates (Cox Citation1972). Workers who were lost to follow-up were right censored as non-cases at the time they left the study. Proportional hazard frailty models with research site as a random effect were used to account for any underlying methodological differences that contributed to unexplained variance in CTS incidence (Therneau and Grambsch Citation2000).
Preliminary, null models were run for age and BMI, as continuous variables, and loess smoothed Martingale residuals were plotted and examined for evidence of non-linear relations with CTS (Therneau, Grambsch, and Fleming Citation1990, Lin, Wei, and Ying Citation1993). BMI showed a linear response. Age showed a linear increase in CTS risk up to approximately 55 years, after which risk began to decline. Two linear splines with a single knot at age = 55 years (90th percentile of data) were used to quantify this association (Malloy, Kapellusch, and Garg Citation2017). Subsequently, a covariate PH model using age (spline), gender and BMI (linear) was calculated, and loess smoothed Martingale residuals of this covariate model were plotted against cumulative RSI score. This plot showed a linear increase up to approximately RSI = 27 (95th percentile of data), after which the data became sparse and dispersed, and the trend line levelled.
Association between cumulative RSI score and incident of CTS was modelled treating RSI score as: (1) a simple linear variable, (2) a linear spline with single knot at RSI = 27, (3) a categorical variable using the a-priori cut-point of RSI = 10 (Garg, Moore, and Kapellusch Citation2017a), and (4) a three-level categorical model with cut-points of RSI = 8.5 (a 15% reduction of the a-priori limit), and RSI = 15.0 (a 50% increase of the a-priori limit), thus creating logical ‘low’, ‘medium’, and ‘high’ exposure categories. All four models were a-priori adjusted for age, gender, and BMI. HRs and 95% confidence intervals were determined. For spline models, the overall p-value for including cumulative RSI score in the model was determined based on a log-likelihood test comparing each full model to the covariate model.
Results
This study included 1,885 workers from four US states (IL, UT, WA, WI). Dominant-hand CTS prevalence among these workers at baseline was 13.4% (n = 253). An additional n = 259 workers were immediately lost to follow-up; leaving N = 1372 workers eligible for incident CTS analyses. Participating workers were followed for up to 6 years with an average follow-up duration of 2.5 years. Minimum participation time was one month. During the 3446 person-years of follow-up, workers developed 157 incident cases of dominant-hand CTS for an average incident rate of 4.56 per 100 person-years.
During their time in the study, workers collectively performed a total of 1,904 manufacturing and service jobs. Most workers (n = 1086, 79.2%) performed the same job for their entire duration in the study. The remaining n = 290 workers changed jobs, and thus changed physical exposures during the time of the study. These changes in exposure were accounted for by using time-varying covariates in the PH models. Most workers (61%) who changed exposures did so only once, or twice (24%). A minority of workers (15% of those with job changes, 3% of the total cohort) changed exposures three or more times.
Of the 1904 jobs performed during the study, 844 (44.3%) were multi-task jobs. The average multi-task job had 3.7 tasks (S.D. = 1.75, range: 2–12). The median multi-task job had three tasks. Nearly all tasks (99.4%) in this study consisted of two or more sub-tasks (i.e. had multiple exertion groups within task). Sub-task RSI scores were quantified into task-level, composite RSI scores using the Garg, Moore, and Kapellusch (Citation2017b) COSI algorithm. The COSI algorithm rank-orders all sub-tasks and then, starting with most stressful sub-task, incrementally combines sub-tasks to create a task-level, composite RSI score. The algorithm works by excluding frequency of exertion from each sub-task RSI calculation, leaving only the effects of intensity of exertion, duration per exertion, posture, and hours per day of exposure in each sub-task RSI (these are referred to as ‘frequency independent RSI’ scores). Next, the algorithm incrementally includes the effect of frequency of exertion by adding the differential frequency effect of the next most-stressful sub-task to the combined frequency effect of all prior sub-tasks. This process steadily increases the RSI score with each additional sub-task until all sub-tasks are accounted for.
Subsequently, task-level composite RSI scores were quantified into job-level, cumulative RSI scores using the Garg, Moore, and Kapellusch (Citation2017b) CUSI algorithm. Similar to the aforementioned COSI algorithm, the CUSI algorithm incrementally combines all tasks from a multi-task job by starting with the most stressful task. The CUSI algorithm first omits hours per day from each task’s RSI calculation (these are referred to as ‘hours independent RSI’ scores). This leaves only the combined effects of intensity of exertion, duration per exertion, frequency of exertion, and posture in each task’s RSI scores. Next, starting with the most stressful task, the algorithm incrementally adds the differential effect of increasing hours per day of exposure until total daily exposure (i.e. cumulative RSI score) is reached. For worker who perform only one task per day, the composite RSI and cumulative RSI scores are identical. For this cohort of workers, the average, cumulative RSI score was 11.3 (S.D. = 8.1, range: 0.1–76.6) ().
Table 1. Descriptive statisticsa for covariates and cumulative RSI score (n = 1372).
Table 2. Hazard ratios for covariate model of Carpal Tunnel syndrome.
Covariate model
Workers were mostly female (58.2%), averaged 41 years of age (S.D.=11.3, range:18–72), and had BMI of 28.3 kg/m2 (S.D. = 6.1, range: 16.0–55.8). Age and BMI were associated with increased risk of CTS (p < = 0.01). Gender was not statistically associated with increased risk (p = 0.15). CTS risk increased by 2.2% per year of age. Peak risk occurred at 55 years of age with HR = 2.25 (95% CI: 1.20−4.92) relative to risk for an 18 year-old. BMI risk increased by 3.2% per kg/m2. When compared to the median of the Centres for Disease Control (CDC) ‘normal’ weight category (i.e. BMI = 21.7 kg/m2, based on the centre of the ‘normal’ BMI range of 18.5–24.9 kg/m2), the HR for a person of average BMI in this study (i.e. BMI = 28.3) was HR = 1.23 (95% CI: 1.07−1.47). Similarly, a person classified as ‘obese’ (i.e. BMI = 30 or more) had HR > =1.30 (95% CI: 1.09−1.62) relative to a worker with ‘normal’ weight.
Revised strain index models
All four models that included cumulative RSI score reached statistical significance (p ≤ 0.03).
The two-category model using the Garg, Moore, and Kapellusch (Citation2017a) a-priori limit of RSI > 10 as high exposure had HR = 1.45 (95% CI: 1.11–1.91, p = 0.01). The three-category model with cut-points at RSI = 8.5 for medium exposure, and RSI = 15.0 for high exposure showed a monotonic increase in risk with HR = 1.42 (95% CI: 0.96–2.09, p = 0.08) for medium exposure, and HR = 1.79 (95% CI: 1.19–2.69, p = 0.01) for high exposure, and with overall model p-value of 0.02 ().
Table 3. Multivariatea models of exposure-response relationships between cumulative RSI scores and Carpal Tunnel Syndrome.
For the simple linear model, risk of CTS increased by 1.9% per unit increase in RSI score (HR = 1.019, 95% CI: 1.00–1.04, p = 0.03), relative to unexposed (i.e. RSI = 0). For the linear spline model, risk of CTS increased by 3.3% per unit increase in RSI score (HR = 1.033, 95% CI: 1.01–1.06, p = 0.01) up to the knot at SI = 27. Risk of CTS for RSI > 27 was statistically flat (HR = 0.952, 95% CI: 0.86–1.05); however, the p-value for change in slope above the knot did not reach significance (p = 0.15), suggesting that the first spline term could be applied to the entire range of cumulative RSI scores observed during this study (i.e. up to RSI = 76.7) ().
For easy comparison of the continuous models, Hazard ratios for several RSI scores within the range observed in this study are shown in . Assuming a range from RSI = 0 to RSI = 75, for the simple linear model HR = 2.0 at RSI = 36.2 and increased to a maximum HR of 4.1 at RSI = 75.0. By comparison, predicted risk rises faster in the spline-based model with HR = 2.0 first achieved at RSI = 21.4 and continuing to a maximum of HR = 2.4 at RSI = 27 if both spline terms are used, or a maximum of HR = 11.4 at RSI = 75, if the first spline is assumed to be valid across the entire range of RSI scores observed during this study. A visual comparison of categorical and continuous results are shown in and a comparison of simple linear and linear spline results are shown in .
Figure 1. Visual comparison of categorical and continuous exposure-response models with 95% confidence intervals omitted for clarity.
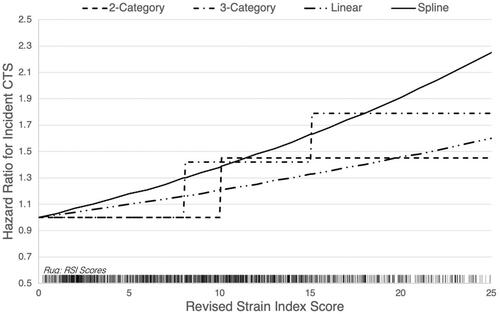
Figure 2. Visual comparison of simple linear and linear spline results across the full range of RSI scores observed.
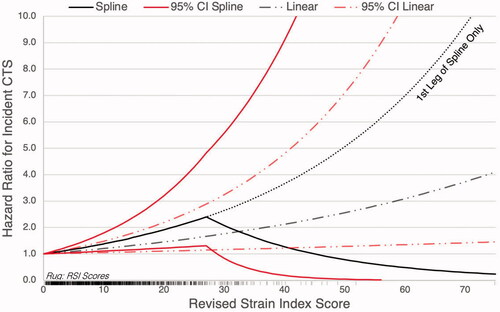
Table 4. Hazard ratio estimates for carpal tunnel syndrome attributed to cumulative RSI score based on linear regression results.
Discussion
These analyses provide initial evidence of predictive validity for CTS using the Revised Strain Index (RSI). This study’s data included 1904 jobs and 1372 CTS-eligible workers to provide a robust sample and results that are likely generalisable across manufacturing, service and health-care sectors (Luckhaupt et al. Citation2013).
Categorical models
The RSI was developed with an a-priori high-risk cut-point of 10.0, and with the notion that epidemiological evidence could be used to adjust that limit (Garg, Moore, and Kapellusch Citation2017a). We found increased risk of approximately HR = 1.5 using that a-priori cut-point, suggesting that keeping RSI scores to below 10.0 would sufficiently protect workers from CTS in most situations. Some practitioners prefer three-categories (i.e. low, moderate, high) of risk to help with prioritisation of surveilled jobs. For this reason, we also tested RSI cut-points of 8.5 and 15.0 that represent a 15% reduction and 50% increase in the a-priori cut-point, respectively. Designing to keep jobs below RSI = 8.5 would likely further assure worker safety. Jobs at or above 15.0 have HR = 1.8 and are beginning to expose most workers to substantial risk of CTS. Thus these data suggest that jobs with RSI > 15 should be prioritised for interventions and/or re-designs. Meanwhile, jobs between 8.5 and 15.0 are suggested to at least require close monitoring and/or heightened surveillance. The cut-points of 8.5 and 15.0 should be tested using other datasets, and against other DUE MSD outcomes, to confirm their efficacy as surveillance limits.
Continuous models
Designing new tasks and jobs to reduce physical exposure while maintaining quality and productivity can be complicated and involve multiple alternative designs. Continuous RSI scores could be useful in these applications. This study found that risk of CTS increases between 1.9% and 3.3% per unit increase in RSI score, suggesting that designs with relatively lower RSI scores will pose progressively less risk of CTS to workers. Similarly, jobs that have their RSI scores lowered over time, even in small increments, can be expected to reduce risk of CTS for workers.
It should be noted that prior work histories, company and worker cultures, and outside of work exposures will differ between companies, industries, and geographic regions, even if the work being performed on the jobs is substantially similar. These factors likely contribute to or modify risk for developing MSDs. For continuous models, the reference point for quantifying exposure-response relationships is a theoretical group of ‘unexposed’ workers who have similar lifestyles and work histories to the observed cohort, but who are not exposed to the work being studied. Thus, it appears likely that different magnitudes of exposure-response relationships may be observed if different industries with markedly different cohorts of workers are studied, even if the level of measured hand/wrist physical exposures are comparable to those in this current study. It remains to be seen whether the exposure-response magnitudes reported here under- or over-state the ‘true’ risk of CTS due to hand/wrist physical exposure quantified by the RSI.
Role in risk management
The RSI should prove useful for identifying tasks and multi-task jobs that pose risk for CTS from hand/wrist physical exposures. When combined with detailed time-motion study information (i.e. sub-task level information) and exposure-response information like that provided in this paper, the RSI provides detailed risk analyses that can be used for targeted ergonomics and production system interventions. Because fewer assumptions are required, as compared to the 1995 SI for example, practitioners can expect improved consistency in measurements, especially for short-cycle routinised work where consistent sampling strategies are more easily used. With regular and consistent measurements, task and job interventions can be prioritised and iteratively improved as a part of continuous improvement processes and long-term risk management processes such as those described in the International Organisation for Standards (ISO) 31000:2018 guidelines (ISO, 2018).
As part of a larger risk management process, continuous exposure-response associations can be used by companies and organisations to set physical exposure limits for surveillance and design that are consistent with their overall risk management goals. Similarly, governmental bodies and organisations can use the same continuous exposure-response information to set expectations and standards for employers at large to help reduce the worker and societal burden of DUE MSDs.
While not explicitly designed to analyse risk (or benefit) to individual workers, the detailed physical exposure measurements facilitated by the RSI might prove useful for well-trained and experienced practitioners such as occupational medicine physicians, physical and occupational therapists, and athletic trainers who are facilitating rehabilitation, return-to work initiatives, or specific injury investigations.
Future research
Further investigations are needed to confirm this study's findings. While CTS is a common and costly MSD it is merely one of several MSDs of the hand-wrist and arm. Thus, additional studies are needed to determine and verify exposure-response relationships between the RSI and other DUE MSDs, such as epicondylalgia, hand/wrist tendonitis, and flexor tendon entrapment of the digits. Researchers should also consider studying jobs and morbidity on jobs in a manner similar to Moore and Garg (Citation1995), Knox and Moore (Citation2001), and Rucker and Moore (Citation2002). Studying jobs or tasks (as opposed to individual workers) would allow sensitivity, specificity, positive predictive value, and negative predictive value to be estimated for the RSI and would provide a more certain basis for using the RSI as a surveillance and design tool. Job or task intervention studies that use the RSI as a tool for interventions and task/job design would arguably be most useful to establish the RSI's utility, and to further develop and improve the tool. Intervention studies could also plausibly use randomised control designs which would provide stronger evidence of predictive validity than the observational methods employed for this study. Expanding the pool of jobs studied to include workers from other sectors would also be helpful to overall preventive efforts.
Reliability studies are also needed and would help guide use of the RSI in surveillance, intervention, and design situations. Several aspects of reliability (and RSI score sensitivity) are potentially important, including: (1) analyst judgement when using RSI for walk-through surveillance, (2) analyst rating of critical variables, such as intensity of exertion, and (3) effect of sampling techniques and strategy. Because of the complexity, testing reliability in the context of intervention studies that can draw upon real-world use examples are likely more valuable and insightful than relying upon data from epidemiological studies that use a constrained set of expert analysts and highly specialised assessment techniques.
Strengths and limitations
This study has several strengths, including the prospective cohort design and sample of 1904 jobs and 1372 CTS-eligible workers with frequent follow-ups. Personal, anthropometric and job physical factors were individually measured. Individual physical exposures were quantified for each exertion performed with time-study data allowing exposures to be specified in detail at both the task and job levels. The study population was drawn from 4 diverse US states and includes workers from the manufacturing, service and healthcare sectors. There are also some noteworthy limitations.
These data were collected by three independent research teams and then subsequently combined for these analyses. Data collection methods were similar and analysts were trained professionals with similar expertise. Nonetheless, there could still be between-site differences of which we are not aware and that cannot be adequately controlled for using PH frailty models with research site as a random effect (Friedenreich Citation1993). It is expected that any such differences would have a bias towards null.
Participating workers had been employed for many years prior to the study and might at least partially represent a survived workforce (Pearce, Checkoway, and Kriebel Citation2007), especially at higher levels of exposure (Checkoway and Rice Citation1992). Thus, these results may be biased by healthy worker survivor effect (Monson Citation1986) and/or self-selection of workers (Applebaum, Malloy, and Eisen Citation2007), both of which would be expected to bias towards null (Applebaum, Malloy, and Eisen Citation2011).
Raw data were quantified several years prior to development of the RSI method and thus strict application of RSI definitions was not possible for each individual exertion. Rather, RSI scores were computed for substantially-similar groups of exertions using Borg CR-10 force, average duration per exertion within exertion group, and typical posture requirements within exertion group. While consistent with the procedures suggested by Garg, Moore, and Kapellusch (Citation2017a), this approach grouped exertions that might have had widely varied durations per exertion. This was expected to have somewhat reduced the precision of the COSI algorithm used to compute task-level RSI scores. Substantially different posture requirements (e.g. flexion vs. extension) were treated as separate exertion groups and so this circumstance was not expected to have been a meaningful source of imprecision.
Conclusion
The RSI shows statistically significant exposure-response relations with CTS, suggesting that the RSI has predictive validity for risk of CTS among workers performing manufacturing, service and healthcare jobs. Using the simple RSI and cut-points of RSI = 8.5 and RSI = 15, tasks can be categorised into groups of low, medium, and high risk of CTS during walk-through surveillance of facilities. Smooth continuous exposure-response relations between RSI and CTS suggest that composite and cumulative RSI scores can be used to design and incrementally improve tasks and job-rotation schemes to reduce and/or minimise risk of CTS. Further research is needed to confirm predictive validity for other DUE MSDs and demonstrate validity through job/task interventions.
Acknowledgements
The authors dedicate this paper to the life, work, and memory of Dr. Arun Garg: friend, colleague and inspiration.
Disclosure statement
No potential conflict of interest was reported by the author(s).
Additional information
Funding
References
- Applebaum, K. M., E. J. Malloy, and E. A. Eisen 2007. “Reducing Healthy Worker Survivor Bias by Restricting Date of Hire in a Cohort Study of Vermont Granite Workers.” Occupational and Environmental Medicine 64: 681–687.
- Applebaum, K. M., E. J. Malloy, and E. A. Eisen 2011. “Left Truncation, Susceptibility, and Bias in Occupational Cohort Studies.” Epidemiology 22: 599–606.
- Bao, S., B. Silverstein, N. Howard, and P. Spielholz. 2006. “The Washington State Sharp Approach to Exposure Assessment.” In Fundamentals and Assessment Tools for Occupational Ergonomics, edited by W. S. Marras and W. Karwowski. 2nd ed., 44–1–44-22. Boca Raton, FL: Taylor & Francis.
- Checkoway, H., and C. H. Rice 1992. “Time-Weighted Averages, Peaks, and Other Indices of Exposure in Occupational Epidemiology.” American Journal of Industrial Medicine 21 (1): 25–33. doi:https://doi.org/10.1002/ajim.4700210106.
- Cox, D. R. 1972. “Regression Models and Life Tables.” Journal of the Royal Statistical Society. Series B 34 (2): 187–220. doi:https://doi.org/10.1111/j.2517-6161.1972.tb00899.x.
- Dale, A. M., Harris-Adamson, C., Rempel, D., Gerr, F., Hegmann, K., Silverstein, B., Burt, S., Garg, A., Kapellusch, J., Merlino, L., Thiese, M., Eisen, E., and Evanoff, B. 2013. “Prevalence and Incidence of Carpal Tunnel Syndrome in US Working Populations: Pooled Analysis of Six Prospective Studies.” Scandinavian Journal of Work, Environment & Health 39 (5): 495.
- Fan, Z. J., Bao, S., Silverstein, B. A., Howard, N. L., Smith, C. K., and Bonauto, D. K. 2014. “Predicting Work-Related Incidence of Lateral and Medial Epicondylitis Using the Strain Index.” American Journal of Industrial Medicine 57 (12): 1319–1330. doi:https://doi.org/10.1002/ajim.22383.
- Friedenreich, C. M. 1993. “Methods for Pooled Analyses of Epidemiologic Studies.” Epidemiology 4: 295–302.
- Garg, A., and Kapellusch, J. M. 2011. “Job Analysis Techniques for distal Upper Extremity Disorders.” Reviews of Human Factors and Ergonomics 7 (1): 149–196. doi:https://doi.org/10.1177/1557234X11410386.
- Garg, A., Hegmann, K. T., Wertsch, J. J., Kapellusch, J. M., Thiese, M. S., Bloswick, D., Merryweather, A., Sesek, R., Deckow-Schaefer, G., Foster, J., Wood, E., Kendall, R., Sheng, X., and Holubkov, R. 2012. “The WISTAH Hand Study: A Prospective Cohort Study of Distal Upper Extremity Musculoskeletal Disorders.” BMC Musculoskeletal Disorders 13 (1): 90.
- Garg, A., Kapellusch, J. M., Hegmann, K. T., Thiese, M. S., Merryweather, A. S., Wang, Y. C., and Malloy, E. J. 2014. “The Strain Index and TLV for HAL: Risk of Lateral Epicondylitis in a Prospective Cohort.” AJIM 57 (3): 286–302.
- Garg, A., Kapellusch, J., Hegmann, K., Wertsch, J., Merryweather, A., Deckow-Schaefer, G., Malloy, E. J., and the WISTAH Hand Study Research Team. 2012. “The Strain Index (SI) and Threshold Limit Value (TLV) for Hand Activity Level (HAL): Risk of Carpal Tunnel Syndrome (CTS) in a Prospective Cohort.” Ergonomics 55 (4): 396–414. doi:https://doi.org/10.1080/00140139.2011.644328.
- Garg, A., Moore, J. S., & Kapellusch, J. M. 2017b. “The Composite Strain Index (COSI) and Cumulative Strain Index (CUSI): Methodologies for Quantifying Biomechanical Stressors for Complex Tasks and Job Rotation Using the Revised Strain Index.” Ergonomics 60 (8): 1033–1041. doi:https://doi.org/10.1080/00140139.2016.1246675.
- Garg, A., Moore, J. S., and Kapellusch, J. M. 2017a. “The Revised Strain Index: An Improved Upper Extremity Exposure Assessment Model.” Ergonomics 60 (7): 912–922. doi:https://doi.org/10.1080/00140139.2016.1237678.
- Harris-Adamson, C., You, D., Eisen, E. A., Goldberg, R., and Rempel, D. 2014. “The Impact of Posture on Wrist Tendinosis Among Blue-Collar Workers: The San Francisco Study.” Human Factors 56 (1): 143–150. doi:https://doi.org/10.1177/0018720813502807.
- Kapellusch, J. M., Garg, A., Hegmann, K. T., Thiese, M. S., & Malloy, E. J. 2014. “The Strain Index and ACGIH TLV for HAL: Risk of Trigger Digit in the WISTAH Prospective Cohort.” Human Factors 56(1): 98–111.
- Kapellusch, J. M., Garg, A., Bao, S. S., Silverstein, B. A., Burt, S. E., Dale, A. M., Evanoff, B. A., Gerr, F. E., Harris-Adamson, C., Hegmann, K. T., Merlino, L. A., and Rempel, D. M. 2013. “Pooling Job Physical Exposure Data from Multiple Independent Studies in a Consortium Study of Carpal Tunnel Syndrome.” Ergonomics 56 (6): 1021–1037. doi:https://doi.org/10.1080/00140139.2013.797112.
- Knox, K., and Moore, J. S. (2001). “Predictive Validity of the Strain Index in Turkey Processing.” JOEM 43 (5): 451–462.
- Lin, D. Y., L. J. Wei, and Z. Ying 1993. “Checking the Cox Model with Cumulative Sums of Martingale-Based Residuals.” Biometrika 80 (3): 557–572. doi:https://doi.org/10.1093/biomet/80.3.557.
- Lowe, B.D., P.G. Dempsey, and E. M. Jones 2019. “Ergonomics Assessment Methods Used by Ergonomics Professionals.” Applied Ergonomics 81: 102882. doi:https://doi.org/10.1016/j.apergo.2019.102882.
- Luckhaupt, S. E., J. M. Dahlhamer, B. W. Ward, M. H. Sweeney, J. P. Sestito, and G. M. Calvert 2013. “Prevalence and Work-Relatedness of Carpal Tunnel Syndrome in the Working Population, United States, 2010 National Health Interview Survey.” American Journal of Industrial Medicine 56 (6): 615–624. doi:https://doi.org/10.1002/ajim.22048.
- Malloy, E. J., J. M. Kapellusch, and A. Garg. 2017. “Estimating and Interpreting Effects from Nonlinear Exposure-Response Curves in Occupational Cohorts Using Truncated Power Basis Expansions and Penalized Splines.” Computational and Mathematical Methods in Medicine 2017: 7518035.
- Monson, R. R. 1986. “Observations on the Healthy Worker Effect.” Journal of Occupational Medicine, Official Publication of the Industrial Medical Association 28 (6): 425–433.
- Moore, J.S., and A. Garg. 1995. “The Strain Index: A Proposed Method to Analyze Jobs for Risk of Distal Upper Extremity Disorders.” AIHA Journal 56 (5): 443–458. doi:https://doi.org/10.1080/15428119591016863.
- Pearce, N., H. Checkoway, and D. Kriebel 2007. “Bias in Occupational Epidemiology Studies.” Occupational and Environmental Medicine 64 (8): 562–568. doi:https://doi.org/10.1136/oem.2006.026690.
- R Core Team. 2020. R: A Language and Environment for Statistical Computing. Vienna, Austria: R Foundation for Statistical Computing. https://www.R-project.org/
- Rucker, N., and J. S. Moore. 2002. “Predictive Validity of the Strain Index in Manufacturing Facilities.” Applied Occupational and Environmental Hygiene 17 (1): 63–73. doi:https://doi.org/10.1080/104732202753306177.
- Silverstein, B. A., Z. J. Fan, D. K. Bonauto, S. Bao, C. K. Smith, N. Howard, and E. Viikari-Juntura. 2010. “The Natural Course of Carpal Tunnel Syndrome in a Working Population.” Scandinavian Journal of Work, Environment & Health 36 (5): 384–393.
- Silverstein, B., J. Fan, S. Bao, N. Howard, P. Spielholz, C. Smith, D. Bonauto, and E. Viikari-Juntura. 2006. “How Well Does the Strain Index Predict Carpal Tunnel Syndrome?” In Proceedings of the International Ergonomics Association’s 16th World Congress on Ergonomics. Maastricht, Netherlands.
- Therneau, T. M., P. M. Grambsch, and T. R. Fleming (1990) “Martingale-Based Residuals for Survival Models.” Biometrika 77 (1): 147–160. doi:https://doi.org/10.1093/biomet/77.1.147.
- Therneau T. M., and P. M. Grambsch. Modeling Survival Data: Extending the Cox Model. New York, NY: Springer-Verlag; 2000.