
Abstract
When work-related physical stress is assessed using non-weighted integration, it is assumed that different loading conditions have a sufficiently comparable effect on the human body as long as the area under the loading curve is the same. Growing evidence cast doubt on whether this simple calculation can adequately estimate physical work-related strain. This study investigates in vivo, focussing on the lower back, whether the non-weighted method adequately reflects work-related physical strain of the lower back. Strain data resulting from lifting/lowering tasks performed in a laboratory study with an identical area under the loading curve but different load intensities were compared. Results showed that the non-weighted method does not sufficiently reflect the resulting muscular, cardiovascular and perceived strain but underestimates the influence of higher load intensity even in the range of medium physical exposure. Further research is needed regarding the determination of weighting factors and limit values.
Practitioner Summary Given the dynamic nature of most physical work activities, the assessment of time-varying loading of the lower back is of particular interest in practice. Results show that the widely used non-weighted calculation method does not accurately reflect the resulting physical strain but underestimates the influence of higher load intensity.
Abbreviations: MSD: musculoskeletal disorders; WMSD: work-related musculoskeletal disorders; KIM-LHC: Key Indicator Method Lifting, Holding, Carrying; RES: right erector spinae longissimus; LES: left erector spinae longissimus; HR: heart rate; RPE: rating of perceived exertion; EMG: surface electromyography; ECG: electrocardiography; SENIAM: Surface ElectroMyoGraphy for the Non-Invasive Assessment of Muscles; MVC: maximum voluntary contraction; ANOVA: analysis of variance; Std. error: standard error
Results of this empirical investigation suggest that the widely used non-weighted calculation method is not fully suitable for calculating cumulative loading of the lower back.
Even in the range of medium physical exposure the non-weighted calculation method does not accurately reflect the resulting strain on the human body but tends to underestimate the influence of higher load intensity due to higher external weight.
Despite the same cumulative loading value obtained when using the non-weighted method, the resulting physical strain values are generally about 20–25% higher.
The results may be used to further develop ergonomic assessment methods in order to avoid a misclassification of loading conditions and to prevent the risk of overexertion.
HIGHLIGHTS
Introduction
Musculoskeletal disorders (MSD) are one of the most common causes of chronic pain and activity limitations and lead to high health care costs worldwide (Dagenais, Caro, and Haldeman Citation2008; Geurts et al. Citation2018; Olafsson et al. Citation2018). In this context, the lumbar vertebra region is of particular interest as low back pain accounts for a large proportion of work-related MSD (WMSD) (Maher, Underwood, and Buchbinder Citation2017). With regard to risk factors for the development of WMSD of the lower back, there is consistent evidence of a causal relationship between forceful lifting tasks and WMSD (da Costa and Vieira Citation2010; Manchikanti et al. Citation2014; Putz-Anderson et al. Citation1997). For the ergonomic analysis of workplaces, the assessment of physical stress of the lower back is of central importance.
Given the dynamic nature of physical work activities in occupational practice (Iridiastadi and Nussbaum Citation2006), the consideration of the temporal variability of the loading is a fundamental requirement for assessment methods. In this context, however, approaches based only on the assessment of average or peak loading have proven to be inadequate, as they carry the risk of systematic under- or overestimation, respectively (Garg and Kapellusch Citation2016). Based on the viscoelastic nature of human tissue, Kumar (Citation1990) argued that it would be necessary to assess the time history of loading. Accordingly, by taking into account the temporal aspect of loading, the relationship between work-related stress and physiological reactions could be better described than by focussing exclusively on peak exposures. In retrospect, Waters, Yeung, Genaidy, Callaghan, Barriera-Viruet, and Deddens (Citation2006) see this reasoning as the starting point of the concept of cumulative loading following the general principle of integrating loading over time. Also, in view of recent advances in wearable sensor technology, which enables the collection of occupational exposure information with high frequency (Lee et al. Citation2017; Valero et al. Citation2016), cumulative loading seems an advantageous approach to using large amounts of exposure data for the evaluation of workplaces.
Based on Armstrong et al. (Citation1993) and Checkoway, Pearce, and Kriebel (Citation1989), Winkel and Mathiassen (Citation1994) established a formal definition for cumulative loading resulting from physical exposure, according to which cumulative exposure is calculated as exposure level times duration, which corresponds to the SI unit Newton second and contradicts the use of exponential weighting factors (Waters, Yeung, Genaidy, Callaghan, Barriera-Viruet, Abdallah, et al. Citation2006). Multiplicative weighting factors are also not included. Instead, this non-weighted approach corresponds to the calculation of the area under the loading curve by multiplying the calculated load intensity by the respective load duration and summing these products. As a result, the non-weighted approach was widely used in the literature to assess work-related physical stress of the lower back (Andrews and Callaghan Citation2003; Callaghan, Salewytsch, and Andrews Citation2001; Fischer et al. Citation2007; Frazer et al. Citation2003; Gregory et al. Citation2009; Holmes, Hodder, and Keir Citation2010; Kumar and Narayan Citation2005; Lad et al. Citation2018; Parkinson, Bezaire, and Callaghan Citation2011; Sullivan, Bryden, and Callaghan Citation2002; Sutherland et al. Citation2008).
Still, the non-weighted approach is based on the assumption that different loading conditions have a sufficiently comparable effect on the human body as long as the area under the loading curve is the same. However, evidence derived from in vitro studies on the failure strength of human lumbar vertebra challenges this assumption and instead suggests a disproportionately higher overexertion risk of high forces (Brinckmann, Biggemann, and Hilweg Citation1988; Gallagher and Schall Citation2017; Jäger et al. Citation2000). This indicates that the non-weighted approach may not necessarily sufficiently reflect the impact on the human body posed by most working tasks. Huangfu et al. (Citation2019) recently investigated the effectiveness of non-weighted calculation in vivo by examining muscular exposure data resulting from physical tasks with an identical area under the loading curve but a different combination of load intensity and duration. Overall, the results also indicated that a non-weighted approach carries the risk of systematically underestimating the effects of high load intensity. Nevertheless, muscular strain data between tasks of submaximal load intensity were not significantly different, suggesting that in some cases, the non-weighted approach may sufficiently reflect the effects on certain aspects of the human body. Given the submaximal nature of most modern work demands (Mathiassen Citation2006; Sonne et al. Citation2015), this is an interesting finding that requires further analysis. Still, Huangfu et al. (Citation2019) examined muscles of the elbow flexor and therefore the transferability to the particularly endangered lower back seems unclear.
The purpose of this study is therefore to investigate the non-weighted calculation method for cumulative loading of the lower back with regard to its suitability to sufficiently reflect the resulting strain during lifting and lowering tasks. All tasks correspond to a medium exposure. The strain data analysed are muscular data with regard to muscular activity, heart rate characteristics, which reflect cardiovascular demand, and ratings of perceived exertion to capture the psychophysical aspect of physical work. In this context, the term strain is used in the sense of the stress-strain concept (Rohmert Citation1986) according to which the objective factors of a working situation that are equal for every person, such as the weight of loads to be lifted, are referred to as stress and the resulting response, which describes the demand on a person’s capacity, is referred to as strain. This investigation is of particular interest, since, to the authors’ knowledge, a systematic in vivo evaluation of the suitability of the non-weighted calculation approach with regard to the lower back including the resulting muscular, cardiovascular and perceived strain has yet to be carried out. For this purpose, strain data when performing lifting/lowering tasks featuring an identical area under the loading curve but a different combination of spinal load intensity and duration are compared. If strain data are overall significantly different, this would suggest that the non-weighted calculation does not sufficiently reflect the resulting strain. The spinal load intensity was biomechanically calculated as compression force of the intervertebral disc at L5/S1.
Based on the findings of Huangfu et al. (Citation2019), Jäger et al. (Citation2000), Gallagher and Schall (Citation2017) and Brinckmann, Biggemann, and Hilweg (Citation1988) regarding the general disproportionate effect of load intensity on the human body, we hypothesised that non-weighted calculation is not fully suitable for assessing work-related physical stress of the lower back even for the range of medium exposure intensity. Moreover, this study evaluates the relationship between both the spinal load intensity and the area under the loading curve on the indicators of muscular, cardiovascular and perceived strain and identifies further research needs for the development of a validated calculation method for cumulative loading of the lower back.
Method
Participants
Twelve participants (eight female and four male) participated in the study after signing the informed consent. The sample was not gender balanced since significant gender-specific differences are not expected when using relative strain values such as the normalised muscle activity (Kienbacher et al. Citation2014) or the heart rate reserve (Daugherty et al. Citation2011). Participation was limited to participants without recent (12 months) history of cardiovascular and musculoskeletal disorders. Prior to the study, the mean (standard deviation) age (23.7 (2.7) years), height (172.0 (7.0) cm) and weight (64.9 (10.2) kg) were recorded.
Experimental design
As shown in , a 2 (external weight) × 2 (area under the loading curve) within-subject design was employed. External weight was manipulated on two levels (1 kg or 6 kg), as was area under the loading curve (350 kNs and 700 kNs). The four resulting conditions were Low/Small, High/Small, Low/Large and High/Large. Every participant performed all four conditions. The first word indicates the level of external weight (low or high) and the second word indicates the level of area under the loading curve (small or large).
Table 1. The experimental design was a 2 × 2 within-subject design.
All test conditions corresponded to a medium exposure for which ergonomic design measures are reasonable, measured by the risk range assessed with the Key Indicator Method Lifting, Holding, Carrying (KIM-LHC) (Steinberg Citation2012). In each condition, participants performed a lifting/lowering task with the external weight held in both hands. The participants’ body posture was recorded at a rate of 30 Hz using a Kinect sensor (Kinect V2, Microsoft, WA, USA). Based on posture, body weight and external weight, the compression force of the intervertebral disc at L5/S1 was calculated for each frame using a biomechanical model based on the model of Jäger and Luttmann (Citation1989) validated for material handling in the sagittal plane. The calculated spinal compression force represented the loading curve. The area under the loading curve was calculated in real-time by multiplying the calculated load intensity by the duration of each frame and summing these products. No weighting factors were used. Once the defined value of 350 kNs or 700 kNs was reached, the lifting/lowering task was stopped and a 10-min resting period started.
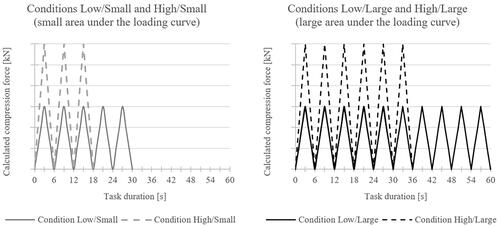
shows a schematic representation of the four conditions. When the area under the loading curve remains the same, but the weight level changes from small to high, this results in a higher spinal loading (dashed lines) and thus in a shorter task duration and fewer movement repetitions. When the weight remains the same, but the area under the loading curve is doubled, the task duration is also doubled due to the periodic nature of the loading curve.
Figure 1. Schematic illustration of the four conditions. The area under the loading curve is identical in each diagram. High external weight results in a higher spinal load intensity and therefore a shorter task duration as time until the defined area under the loading curve is reached. For conditions High/Small and High/Large the spinal load intensity is higher and therefore the task duration as time until the defined area under the loading curve is reached, is shorter.
Dependent variables
Bilateral muscle activity of the erector spinae longissimus (RES/LES), heart rate (HR) and ratings of perceived exertion (RPE) were collected. Since surface electromyography (EMG) is a suitable estimate for physical stress imposed by dynamic loads (Dolan et al. Citation1999), the muscle activity was measured using EMG during the lifting/lowering task and the resting period. RES/LES was selected as a representative of the back muscles whose function is the extension of the spine (Hermens Citation1999) and which is particularly strained during repetitive lifting lifting/lowering tasks (Dolan and Adams Citation1998). To monitor cardiovascular demand, HR was measured using electrocardiography (ECG) during the lifting/lowering task and the resting period. The Borg RPE scale (Borg Citation1998) was used to gather RPE with respect to the whole body after completing each task.
Experimental procedure
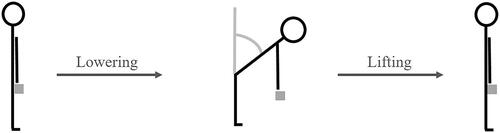
As shown in , participants performed a two-dimensional, symmetric movement in the sagittal plane with an external weight held in both hands. Since empirical evidence suggests a significant influence of trunk inclination and shoulder angle on the muscle activity of RES/LES (Hellig et al. Citation2020), the movement was standardised accordingly. The trunk inclination was standardised to a range of 0° to 40° with the angle measured between the vertical line and the trunk longitudinal axis as shown in . A stretched rope marked the lowest point of the movement. Touching the rope with the forehead signalled reaching of the lowest point. The arms were always perpendicular to the ground. The working pace was set to one lifting or lowering every three seconds and audibly signalled using a digital metronome. This working pace corresponds to a rate typical for occupational practice (Marras et al. Citation2006). Participants completed a short practice session in order to familiarise with the task and pace.
Figure 2. Symmetric lifting/lowering task in the sagittal plane with marked trunk inclination angle. The arms were always held perpendicular to the ground and the external weight was always held in both hands. Participants performed a lifting and lowering movement in the sagittal plane with a weight held in both hands. The trunk inclination was standardised to a range of 0° to 40°.
The order of the tasks was counterbalanced using a 4 × 4 Latin square design, and to minimise carryover effects, there was a 10-min resting period after every task. The participants spent each resting period sitting straight on a chair without backrest to avoid disturbances of the EMG signal with the arms placed in the lap and the feet on the floor.
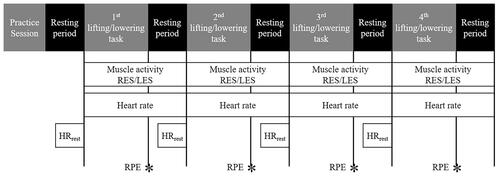
The skin was prepared in accordance with SENIAM before attaching EMG and ECG electrodes (Hermens Citation1999). EMG electrodes were placed over the belly of the muscle under consideration of anatomical landmarks. ECG electrodes were placed according to the 3-lead system as described by Dupre, Vincent, and Iaizzo (Citation2005). To stabilise the electrical condition, a minimum of 5 min passed between electrode placement and data collection. After warming up and visual inspection of the signal, maximum voluntary contraction (MVC) of RES/LES was collected. The MVC test was repeated after a pausing period of 60 seconds. As reference value for HR, HRrest was determined as the mean value of a 1-min measurement in a sitting position after a resting period following the previous condition or the practice session. shows the overview of the measuring times of the different variables.
Figure 3. Overview of the measuring times of the different variables. Each task was followed by a resting period. Muscle activity and heart rate were measured continuously and RPE was obtained after completing the lifting/lowering task. As reference value, HRrest was determined before each task after a resting period and in the same, sitting position. Muscle activity and heart rate were measured continuously, RPE was obtained after completing the lifting/lowering task and HRrest was determined before each task after a resting period.
Data collection and processing
As the calculated compression force varies intraindividually because of the body weight, average minimum and maximum load intensity as well as resulting average task duration were calculated. The average maximum and minimum load intensity were calculated from individual average values for both levels of external weight. Average task duration was calculated as average of the time until the cumulative loading was reached for each condition. EMG and ECG data were recorded wirelessly by a Direct Transmission System (Desktop DTS Receiver, Noraxon, Scottsdale, AZ, USA). Signals were collected and processed using the software MyoResearch 3.12 (Noraxon, Scottsdale, AZ, USA). Ag/AgCl self-adhesive and pregelled 8-shaped dual EMG-electrodes (diameter of adhesive areas: 1 cm; inter-electrode distance: 2 cm) and single ECG-electrodes (diameter: 4.3 cm) were used to measure muscle activity of the RES/LES and HR, respectively.
EMG signals were hardware band-pass filtered (10–500 Hz) and sampled at 1500 Hz. For the normalised mean muscle activity, the data were rectified and smoothed using root-mean square (RMS) algorithm with a time window of 100 ms. RMS values were normalised to the MVC reference contraction. ECG signals were sampled at 1500 Hz using the DTS BioMonitor (Noraxon, Scottsdale, AZ, USA).
HR was analysed by calculating the percentage heart rate reserve (HR reserve) using the formula by Karvonen, Kentala, and Mustala (Citation1957) as (HRtask − HRrest)/(HRmax − HRrest), with HRtask = mean HR of a lifting/lowering task and HRmax = 220 – age (Fox and Naughton Citation1972). Higher HR reserve values reflect an increased cardiovascular demand and a higher relative intensity of the lifting/lowering task. HR was further analysed with regard to the speed of recovery during the resting period. During recovery, the physiological functions related to recovery such as HR decrease exponentially, with the speed being proportional to the concentration of fatigue substances at that moment (Rohmert and Rutenfranz Citation1983). The rate of HR change was calculated as (HR1 − HR2)/1 min, where HR1 = mean HR of the last second of a lifting/lowering task and HR2 = mean HR of one second after the first minute of the resting period. A higher rate of HR change indirectly reflects higher concentration of fatigue substances.
Data analysis
Statistical analyses were conducted using IBM SPSS Statistics 24. A two-way within-subject design analysis of variance (ANOVA) was used for analysis. The independent variables were the four conditions (2 external weight × 2 area under the loading curve), and the dependent variables were the five measured indicators of strain, bilateral muscle activity of the erector spinae longissimus (RES/LES), heart rate (HR) with regard to HR reserve and rate of HR change as well as ratings of perceived exertion (RPE). Where the Shapiro-Wilk test indicated a statistically significant deviation from normality, non-parametric Friedman’s two-way ANOVA by ranks were applied instead. In case of a significant overall analysis, post hoc pairwise comparisons with a Bonferroni correction to adjust for an inflated family-wise error rate were used. If normal distribution could not be assumed, Wilcoxon signed-rank test with a Bonferroni correction to adjust for an inflated family-wise error was used for pairwise comparison. To assess the suitability of the non-weighted calculation method, strain data resulting from lifting/lowering tasks with the same area under the loading curve but a different external weight were compared. To assess the influence of doubling the area under the loading curve, strain data resulting from lifting/lowering tasks with the same external weight were compared. Significance was accepted at the α-level of p < .05. Spearman’s rank correlation coefficients were also calculated to analyse the direction of association between external weight and area under the loading curve and the five indicators of strain, bilateral muscle activity of the erector spinae longissimus (RES/LES), heart rate (HR) with regard to HR reserve and rate of HR change as well as ratings of perceived exertion (RPE).
Results
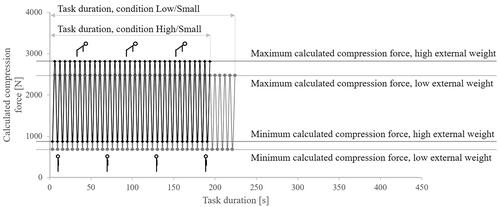
All participants were able to complete the four lifting/lowering tasks in the given pace and posture. shows the course of the calculated loading curve for conditions Low/Small and High/Small averaged over all participants. The minima and maxima correspond to the reversal points of the lifting/lowering movement as indicated in the figure. The continuously higher spinal loading due to the higher external weight results in a shorter time until the defined area under the loading curve is reached and therefore fewer movement repetitions. Due to the periodic nature of the loading curve, a doubling of the area under the loading curve leads to a doubling of the task duration for conditions (not depicted). The mean (standard deviation) duration of the four conditions was as follows: 223.4 (41.0) s for Low/Small, 194.8 (37.4) s for High/Small, 449.6 (82.5) s for Low/Large and 384.0 (63.9) s for High/Large.
Figure 4. Averaged course of the calculated loading curve for Low/Small and High/Small. The minima and maxima correspond to the movement. For an area of 700 kNs the task duration, as time until an area is reached, doubles. The maximum compression force for high and low external weight was 2805 N and 2466 N, respectively. For the small area, this results in a mean duration of 223 s for Low/Small and 195 s for High/Small.
Muscle activity
shows that the normalised mean muscle activity of RES/LES is similar during the resting period after a task (left). The mean muscle activity during the lifting/lowering tasks ( on the right) shows differences especially between conditions with the same area under the loading curve but a different external weight (Low/Small and High/Small or Low/Large and High/Large).
Figure 5. Normalised mean muscle activity (± Standard error) of the resting periods (left) and lifting/lowering tasks (right). The muscle activity is at a similar level during resting period but significantly higher for conditions with high external weight despite the same area during the lifting/lowering tasks.
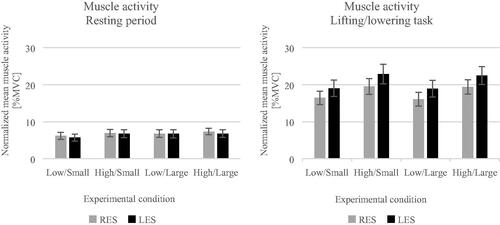
As the Shapiro-Wilk test indicated non-normality for muscle LES in conditions Low/Small (p = .033) and High/Large (p = .04), Friedman’s ANOVA was used to further analyse the normalised mean muscle activity. Friedman’s ANOVA indicated significant differences of the muscle activity between the different lifting/lowering tasks. Statistics are presented in . Pairwise comparisons in show that the muscular strain differed significantly between conditions with different external weight despite the same area under the loading curve (Low/Small and High/Small or Low/Large and High/Large). As can be seen from the descriptive values in , the resulting mean muscle activity was on average 20% higher for the condition with higher external weight within the same area. Pairwise comparisons in also show that a doubling of the area under the loading curve does not lead to a significant difference between conditions with the same external weight (Low/Small and Low/Large or High/Small and High/Large).
Table 2. Results of Friedman test for normalised mean muscle activity and Wilcoxon test for pairwise comparisons.
Table 3. Mean and Standard error for normalised mean muscle activity.
Heart rate (HR)
shows the mean HR reserve and rate of HR change with differences evident between conditions with the same area under the loading curve and different external weight.
Figure 6. Mean HR reserve (± Standard error) and rate of HR change (± Standard error). The mean HR reserve and rate of HR change is clearly higher for conditions with high external weight despite the same area during the lifting/lowering tasks.
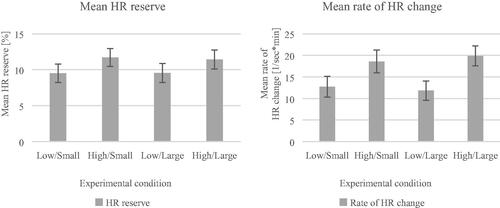
Two-way repeated measures ANOVA revealed a significant effect of the external weight but no significant effects for area under the loading curve or their interaction. Statistics are presented in . As can be seen from the descriptive values in , the cardiovascular demand for conditions with high external weight was on average higher than for conditions with low external weight despite the same area under the loading curve. The HR reserve was about 20% higher for the condition with higher external weight within the same area. For the rate of HR change the percentage change was even higher with 46 % (High/Small to Low/Small) and 68 % (High/Large to Low/Large) despite relating to the same area under the loading curve.
Table 4. Results of two-way repeated measures ANOVA for effects of external weight, area under the loading curve and their interaction.
Table 5. Mean and standard error for HRR and HRC.
Ratings of perceived exertion (RPE)
As the Shapiro-Wilk test indicated non-normality for the RPE in condition Low/Small (p = .033), Friedman’s ANOVA was used to further analyse the RPE. Ratings from 8 to 16 were awarded on a scale of 6–20. shows the mean RPE. Friedman’s ANOVA indicated that the mean RPE changes significantly depending on the experimental condition. Statistics are presented in .
Figure 7. Mean RPE (± Standard error). The RPE is significantly higher for conditions with high external weight despite the same area during the lifting/lowering tasks.
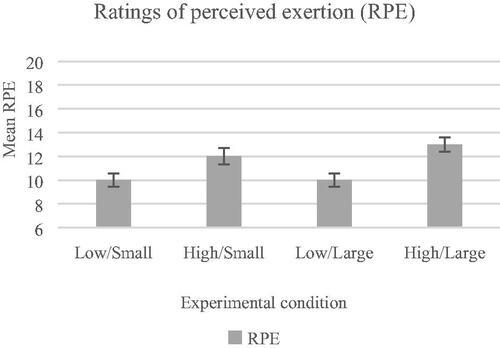
Table 6. Results of Friedman analysis for RPE and Wilcoxon test for pairwise comparisons.
Pairwise comparisons in show that the perceived strain differed significantly between conditions with different external weight despite the same area under the loading curve (Low/Small and High/Small or Low/Large and High/Large). As can be seen from the descriptive values in , the mean RPE was about 20% higher for the condition with higher external weight within the same area. Pairwise comparisons in also show that a doubling of the area under the loading curve does not lead to a significant difference between conditions with the same external weight.
Table 7. Mean and standard error for RPE.
Spearman’s correlation coefficients
Spearman’s correlation coefficients indicate a positive association between the external weight and the indicators of strain as well as overall no correlation between the area under the loading curve and the indicators of strain. Statistics are given in .
Table 8. Spearman’s correlation coefficients for the factors examined.
Discussion
In line with our expectations, the non-weighted calculation is not fully suitable for assessing work-related physical stress of the lower back even for the range of medium exposure intensity. For the normalised mean muscle activity, pairwise comparisons consistently show significantly higher values for conditions with higher external weight despite the same area under the loading curve. Results also prove the suitability of the resting position, as the mean muscle activity during rest is below 10 %MVC (, left) and this value was previously defined by Qin et al. (Citation2014) as the upper threshold for rest. During the lifting/lowering tasks, the mean muscle activity of LES was generally higher than the mean muscle activity of RES. This observation is consistent with other studies on the activation behaviour of the erector spinae (Feldwieser et al. Citation2012; Hagberg and Hagberg Citation1989; Zimmermann, Cook, and Goel Citation1993) and could be traced back to side-related differences in the proportion and recruitment of muscle fibres (Hagberg and Hagberg Citation1989). As such differences are not the focus of this study, they were not analysed further. Both HR reserve and rate of HR change show a significant dependency on external weight thus indicating a higher cardiovascular demand and concentration of fatigue substances. For RPE, higher external weight leads to higher ratings despite the same area under the loading curve.
As hypothesised, these results collectively suggest that the non-weighted method is not fully suitable for assessing work-related physical stress of the lower back, as it tends to underestimate the influence of higher spinal load intensity due to higher external weight even for medium exposure tasks. Results show that the resulting strain values are generally about 20–25% higher despite the same area under the loading curve. For the rate of HR change, which indicates concentration of fatigue substances in the organism, the differences are even 46% and 68%. The big difference between the indicators is striking. Therefore, before weighting factors for an alternative calculation method can be determined empirically, further research is needed on the question of which indicator represents the bottleneck for specific types of physical work activities, and should be used to calculate cumulative loading. Spearman’s correlation coefficients show the greatest correlation between load intensity and both rate of HR change (.386) and RPE (.460), although the RPE may to some extent be influenced by the use of handheld weights, since Le et al. (Citation2012) have shown that psychophysical parameters when handling loads depend on tactile sensations of the hands. Due to the periodic nature of the loading conditions shown in , a doubling of the area under the loading curve leads to a doubling of the duration of the lifting/lowering task. Spearman’s correlation coefficients in overall indicate no tendency for the indicators of strain to increase when the duration of the lifting/lowering taks is doubled. Further statistical analysis also shows no significant differences when doubling the duration for conditions with the same external weight. However, some limitations to this study have to be considered. First, it should be noted that the lifting/lowering tasks examined here were activities of short duration and future research is advisable regarding long activities. This study also used a relatively small sample of participants. Still, the results clearly confirm that the non-weighted method is not fully suitable for assessing work-related physical stress of the lower back. Based on posture, body weight and external weight, the compression force of the intervertebral disc at L5/S1 was biomechanically calculated. The posture was recorded using a Kinect sensor. Diego-Mas and Alcaide-Marzal (Citation2014) concluded that the Kinect sensor records back and arm positions reliably when in a frontal position and with minimal occlusion. Since the movements examined were standardised accordingly, an accurate recording of the body posture can be assumed. Whereas body height and weight were considered in the biomechanical calculation, dynamic effects during the movements of body parts and the external weight were neglected. However, while the absolute load values likely would have increased (Howarth, Beach, and Callaghan Citation2010), dynamic effects are not relevant here, as the focus is on the relative comparison of strain indicators and the speed of movement was kept constant for all participants. Further investigation of the influence of the lifting frequency in the context of the aggregation of physical exposure over time seems reasonable.
Moreover, muscular, cardiovascular and perceived strain were measured. In this context, parameters of muscle activity in particular are recommended as an indicator of strain when designing jobs (Gallagher and Schall Citation2017; Nussbaum Citation2001). Possible strain of spinal musculoskeletal tissue, however, was not determined. As presented by Gallagher and Schall (Citation2017), strain of musculoskeletal tissue is likely to play an important role with respect to work-related MSD, as growing evidence suggests that MSD may be a result of damage propagation of musculoskeletal tissue. It, therefore, seems appropriate to include failure behaviour of musculoskeletal tissue in a yet to be determined alternative calculation method, so that in addition to muscular, cardiovascular and perceived strain, the actual injury risk can be quantified. However, as stated by Gallagher and Schall (Citation2017), the maximum strength of musculoskeletal tissue varies depending on the loading condition. Consequently, in order to include injury risk of musculoskeletal tissue when assessing time-varying loading, research is required regarding the maximum strength and damage propagation of musculoskeletal tissue depending on the loading condition.
Further research is also needed regarding limit values against which a calculated value can be assessed. According to Li and Buckle (Citation1999), the decision on the necessity of an ergonomic intervention is one of the main functions of ergonomic assessment methods. For this purpose, limit values for both maximum cumulative exposure during a working day and a life-time cumulative exposure limit are needed. When determining a life-time exposure limit, in addition to tissue damage, tissue repair must be considered (Gallagher and Schall Citation2017; Waters, Yeung, Genaidy, Callaghan, Barriera-Viruet, Abdallah, et al. Citation2006).
Conclusion
The purpose of this study was to investigate the non-weighted calculation method for cumulative loading of the lower back with regard to its suitability to sufficiently reflect the resulting muscular, cardiovascular and perceived strain. As hypothesised, the results indicate that the widely used non-weighted calculation approach does not fully reflect the resulting muscular, cardiovascular and perceived strain but seemingly underestimates the influence of higher load intensity due to higher external weight even for medium physical stress.
Further research is required with regard to the question of which indicator represents the actual bottleneck for specific types of physical work activities. Based on this, weighting factors for the load intensity relative to the load duration could be determined in order to define an alternative calculation method that better reflects the impact of a working task on the human body. Research is also required regarding the investigation of longer-lasting tasks and limit values for cumulative loading. Furthermore, a better knowledge of the failure behaviour of musculoskeletal tissue depending on the loading condition is needed, as this may enable to include the actual risk of WMSD in the calculation of cumulative loading.
Acknowledgments
This article is part of the projects ‘INDIZ’ (grant number 16ITA206) and ‘workHEALTH’ (grant number 01EC1905B), which are funded by the German Federal Ministry of Education and Research (BMBF). The authors would like to thank for the support they have received.
Disclosure statement
No potential conflict of interest was reported by the author(s).
Additional information
Funding
References
- Andrews, D. M., and J. P. Callaghan. 2003. “Determining the Minimum Sampling Rate Needed to Accurately Quantify Cumulative Spine Loading from Digitized Video.” Applied Ergonomics 34 (6): 589–595. doi:https://doi.org/10.1016/S0003-6870(03)00077-2.
- Armstrong, T J., P. Buckle, L J. Fine, M. Hagberg, B. Jonsson, A. Kilbom, I A. Kuorinka, B A. Silverstein, G. Sjogaard, and E R. Viikari-Juntura. 1993. “A Conceptual Model for Work-Related Neck and Upper-Limb Musculoskeletal Disorders.” Scandinavian Journal of Work, Environment & Health 19 (2): 73–84. doi:https://doi.org/10.5271/sjweh.1494.
- Borg, Gunnar. 1998. Borg's Perceived Exertion and Pain Scales. Champaign, IL: Human Kinetics.
- Brinckmann, P., M. Biggemann, and D. Hilweg. 1988. “Fatigue Fracture of Human Lumbar Vertebrae.” Clinical Biomechanics 3: i–S23. doi:https://doi.org/10.1016/S0268-0033(88)80001-9.
- Callaghan, Jack P., Ami J. Salewytsch, and David M. Andrews. 2001. “An Evaluation of Predictive Methods for Estimating Cumulative Spinal Loading.” Ergonomics 44 (9): 825–837. doi:https://doi.org/10.1080/00140130110059979.
- Checkoway, Harvey, Neil Pearce, and David Kriebel. 1989. Research Methods in Occupational Epidemiology. 1st ed. Oxford: Oxford University Press (Monographs in epidemiology and biostatistics 34).
- da Costa, Bruno R., and Edgar Ramos Vieira. 2010. “Risk Factors for Work-Related Musculoskeletal Disorders: A Systematic Review of Recent Longitudinal Studies.” American Journal of Industrial Medicine 53 (3): 285–323. doi:https://doi.org/10.1002/ajim.20750.
- Dagenais, Simon, Jaime Caro, and Scott Haldeman. 2008. “A Systematic Review of Low Back Pain Cost of Illness Studies in the United States and Internationally.” The Spine Journal 8 (1): 8–20. doi:https://doi.org/10.1016/j.spinee.2007.10.005.
- Daugherty, Stacie L., David J. Magid, Jennifer R. Kikla, John E. Hokanson, Judith Baxter, Colleen A. Ross, and Frederick A. Masoudi. 2011. “Gender Differences in the Prognostic Value of Exercise Treadmill Test Characteristics.” American Heart Journal 161 (5): 908–914. doi:https://doi.org/10.1016/j.ahj.2011.01.021.
- Diego-Mas, Jose Antonio, and, Jorge Alcaide-Marzal. 2014. “Using Kinect™ Sensor in Observational Methods for Assessing Postures at Work.” Applied Ergonomics 45 (4): 976–985. doi:https://doi.org/10.1016/j.apergo.2013.12.001.
- Dolan, P., and M.A. Adams. 1998. “Repetitive Lifting Tasks Fatigue the Back Muscles and Increase the Bending Moment Acting on the Lumbar Spine.” Journal of Biomechanics 31 (8): 713–721. doi:https://doi.org/10.1016/s0021-9290(98)00086-4.
- Dolan, P., I. Kingma, J. van Dieen, M. P. de Looze, H. M. Toussaint, C. T. Baten, and M. A. Adams. 1999. “Dynamic Forces Acting on the Lumbar Spine during Manual Handling. Can They Be Estimated Using Electromyographic Techniques Alone?” Spine 24 (7): 698–703. doi:https://doi.org/10.1097/00007632-199904010-00017.
- Dupre, A., S. Vincent, and P. A. Iaizzo. 2005. “Basic ECG Theory, Recordings, and Interpretation.” In Handbook of Cardiac Anatomy, Physiology, and Devices, edited by Paul A. Iaizzo, 191–201. Totowa, NJ: Humana Press Inc. (Current clinical oncology).
- Feldwieser, F. M., L. Sheeran, A. Meana-Esteban, and V. Sparkes. 2012. “Electromyographic Analysis of Trunk-Muscle Activity during Stable, Unstable and Unilateral Bridging Exercises in Healthy Individuals.” European Spine Journal 21 (Suppl 2): S171–S186. doi:https://doi.org/10.1007/s00586-012-2254-7.
- Fischer, S. L., W. J. Albert, A. J. McClellan, and J. P. Callaghan. 2007. “Methodological Considerations for the Calculation of Cumulative Compression Exposure of the Lumbar Spine: A Sensitivity Analysis on Joint Model and Time Standardization Approaches.” Ergonomics 50 (9): 1365–1376. doi:https://doi.org/10.1080/00140130701344042.
- Fox, Samuel M., and John P. Naughton. 1972. “Physical Activity and the Prevention of Coronary Heart Disease.” Preventive Medicine 1 (1): 92–120. doi:https://doi.org/10.1016/0091-7435(72)90079-5.
- Frazer, Mardon B., Robert W. Norman, Richard P. Wells, and Patrick W. Neumann. 2003. “The Effects of Job Rotation on the Risk of Reporting Low Back Pain.” Ergonomics 46 (9): 904–919. doi:https://doi.org/10.1080/001401303000090161.
- Gallagher, Sean, and Mark C. Schall. 2017. “Musculoskeletal Disorders as a Fatigue Failure Process: Evidence, Implications and Research Needs.” Ergonomics 60 (2): 255–269. doi:https://doi.org/10.1080/00140139.2016.1208848.
- Garg, Arun, and Jay M. Kapellusch. 2016. “The Cumulative Lifting Index (CULI) for the Revised NIOSH Lifting Equation. Quantifying Risk for Workers with Job Rotation.” Human Factors: The Journal of the Human Factors and Ergonomics Society 58 (5): 683–694. doi:https://doi.org/10.1177/0018720815627405.
- Geurts, José W., Paul C. Willems, Jan-Willem Kallewaard, Maarten van Kleef, and Carmen Dirksen. 2018. “The Impact of Chronic Discogenic Low Back Pain: Costs and Patients' Burden.” Pain Research & Management 2018: 4696180. doi:https://doi.org/10.1155/2018/4696180.
- Gregory, Diane E., Carla Laughton, Allan Carman, Stephan Milosavljevic, and Jack P. Callaghan. 2009. “Trunk Postures and Peak and Cumulative Low Back Kinetics during Upright Posture Sheep shearing.” Ergonomics 52 (12): 1576–1583. doi:https://doi.org/10.1080/00140130903287973.
- Hagberg, C., and M. Hagberg. 1989. “Surface EMG Amplitude and Frequency Dependence on Exerted Force for the Upper Trapezius Muscle: A Comparison between Right and Left Sides.” European Journal of Applied Physiology and Occupational Physiology 58 (6): 641–645. doi:https://doi.org/10.1007/BF00418511.
- Hellig, Tobias, Laura Johnen, Alexander Mertens, Verena Nitsch, and Christopher Brandl. 2020. “Prediction Model of the Effect of Postural Interactions on Muscular Activity and Perceived Exertion.” Ergonomics 63 (5): 514–593. In doi:https://doi.org/10.1080/00140139.2020.1740333.
- Hermens, Hermie J. 1999. European Recommendations for Surface ElectroMyoGraphy. Results of the SENIAM Project. Enschede: Roessingh Research and Development (SENIAM, 8).
- Holmes, Michael W. R., Joanne N. Hodder, and Peter J. Keir. 2010. “Continuous Assessment of Low Back Loads in Long-Term Care Nurses.” Ergonomics 53 (9): 1108–1116. doi:https://doi.org/10.1080/00140139.2010.502253.
- Howarth, Samuel J., Tyson A.C. Beach, and Jack P. Callaghan. 2010. “Dynamic Factors and Force-Weighting Corrections Influence Estimates of Cumulative Vertebral Joint Compression.” Theoretical Issues in Ergonomics Science 11 (5): 474–488. doi:https://doi.org/10.1080/14639220902862675.
- Huangfu, Rong, Sean Gallagher, Richard Sesek, Mark Schall, and Gerard Davis. 2019. Evaluating the Effectiveness of Estimating Cumulative Loading Using Linear Integration Method. In Proceedings of the 20th Congress of the International Ergonomics Association (IEA 2018), edited by Sebastiano Bagnara, Riccardo Tartaglia, Sara Albolino, Thomas Alexander, and Yushi Fujita. Cham: Springer International Publishing (820).
- Iridiastadi, H., and M. A. Nussbaum. 2006. “Muscle Fatigue and Endurance during Repetitive Intermittent Static Efforts: Development of Prediction Models.” Ergonomics 49 (4): 344–360. doi:https://doi.org/10.1080/00140130500475666.
- Jäger, Matthias, Claus Jordan, Alwin Luttmann, Wolfgang Laurig, and DOLLY. Group. 2000. “Evaluation and Assessment of Lumbar Load during Total Shifts for Occupational Manual Materials Handling Jobs within the Dortmund Lumbar Load Study – DOLLY.” International Journal of Industrial Ergonomics 25 (6): 553–571. doi:https://doi.org/10.1016/S0169-8141(99)00043-8.
- Jäger, M., and A. Luttmann. 1989. “Biomechanical Analysis and Assessment of Lumbar Stress during Load Lifting Using a Dynamic 19-Segment Human Model.” Ergonomics 32 (1): 93–112. doi:https://doi.org/10.1080/00140138908966070.
- Karvonen, M. J., K. Kentala, and O. Mustala. 1957. “The Effects of Training Heart Rate: A Longitudinal Study.” Annales Medicinae Experimentalis et Biologiae Fenniae 35 (3): 307–315.
- Kienbacher, Thomas, Richard Habenicht, Christian Starek, Patrick Mair, Markus Wolf, Birgit Paul, Sara Riegler, Josef Kollmitzer, and Gerold Ebenbichler. 2014. “The Potential Use of Spectral Electromyographic Fatigue as a Screening and Outcome Monitoring Tool of Sarcopenic Back Muscle Alterations.” Journal of Neuroengineering and Rehabilitation 11: 106 doi:https://doi.org/10.1186/1743-0003-11-106.
- Kumar, S. 1990. “Cumulative Load as a Risk Factor for Back pain.” Spine 15 (12): 1311–1316. doi:https://doi.org/10.1097/00007632-199012000-00014.
- Kumar, Shrawan, and Yogesh Narayan. 2005. “Cumulative Spinal Load among X-Ray Technologist. A Field Study of Techniques, Frame Rate and Prediction.” International Journal of Industrial Ergonomics 35 (10): 889–903. doi:https://doi.org/10.1016/j.ergon.2005.01.014.
- Lad, Uma, Nathalie M. C. W. Oomen, Jack P. Callaghan, and Steven L. Fischer. 2018. “Comparing the Biomechanical and Psychophysical Demands Imposed on Paramedics When Using Manual and Powered Stretchers.” Applied Ergonomics 70: 167–174. doi:https://doi.org/10.1016/j.apergo.2018.03.001.
- Le, Peter, Jonathan Dufour, Heath Monat, Joseph Rose, Zachary Huber, Emma Alder, Radin Zaid Radin Umar, Bryan Hennessey, Mohini Dutt, and William S. Marras. 2012. “Association between Spinal Loads and the Psychophysical Determination of Maximum Acceptable Force during Pushing Tasks.” Ergonomics 55 (9): 1104–1114. doi:https://doi.org/10.1080/00140139.2012.692819.
- Lee, Wonil, Edmund Seto, Ken-Yu Lin, and Giovanni C. Migliaccio. 2017. “An Evaluation of Wearable Sensors and Their Placements for Analyzing Construction Worker's Trunk Posture in Laboratory Conditions.” Applied Ergonomics 65: 424–436. doi:https://doi.org/10.1016/j.apergo.2017.03.016.
- Li, G., and P. Buckle. 1999. “Current Techniques for Assessing Physical Exposure to Work-Related Musculoskeletal Risks, with Emphasis on Posture-Based Methods.” Ergonomics 42 (5): 674–695. doi:https://doi.org/10.1080/001401399185388.
- Maher, Chris, Martin Underwood, and Rachelle Buchbinder. 2017. “Non-Specific Low Back Pain.” The Lancet 389 (10070): 736–747. doi:https://doi.org/10.1016/S0140-6736(16)30970-9.
- Manchikanti, Laxmaiah, Vijay Singh, Frank J. E. Falco, Ramsin M. Benyamin, and Joshua A. Hirsch. 2014. “Epidemiology of Low Back Pain in Adults.” Neuromodulation 17 (Suppl 2): 3–10. doi:https://doi.org/10.1111/ner.12018.
- Marras, W. S., J. Parakkat, A. M. Chany, G. Yang, D. Burr, and S. A. Lavender. 2006. “Spine Loading as a Function of Lift Frequency, Exposure Duration, and Work Experience.” Clinical Biomechanics 21 (4): 345–352. doi:https://doi.org/10.1016/j.clinbiomech.2005.10.004.
- Mathiassen, Svend Erik. 2006. “Diversity and Variation in Biomechanical Exposure: What Is It, and Why Would We Like to Know?.” Applied Ergonomics 37 (4): 419–427. doi:https://doi.org/10.1016/j.apergo.2006.04.006.
- Nussbaum, M. A. 2001. “Static and Dynamic Myoelectric Measures of Shoulder Muscle Fatigue during Intermittent Dynamic Exertions of Low to Moderate Intensity.” European Journal of Applied Physiology 85 (3–4): 299–309. doi:https://doi.org/10.1007/s004210100454.
- Olafsson, Gylfi, Emma Jonsson, Peter Fritzell, Olle Hägg, and Fredrik Borgström. 2018. “Cost of Low Back Pain: Results from a National Register Study in Sweden.” European Spine Journal 27 (11): 2875–2881. doi:https://doi.org/10.1007/s00586-018-5742-6.
- Parkinson, R. J., M. Bezaire, and J. P. Callaghan. 2011. “A Comparison of Low Back Kinetic Estimates Obtained through Posture Matching, Rigid Link Modeling and an EMG-Assisted Model.” Applied Ergonomics 42 (5): 644–651. doi:https://doi.org/10.1016/j.apergo.2010.09.012.
- Putz-Anderson, Vern, Bruce P. Bernard, Susan E. Burt, Libby L. Cole, Cheryl Fairfield-Estill, and Lawrence J. Fine. 1997. Musculoskeletal Disorders and Workplace Factors. A Critical Review of Epidemiologic Evidence for Work-Related Musculoskeletal Disorders of the Neck, Upper Extremity, and Low Back. Cincinnati, OH: U.S. Department of Health and Human Services.
- Qin, Jin, Jia-Hua Lin, Bryan Buchholz, and Xu Xu. 2014. “Shoulder Muscle Fatigue Development in Young and Older Female Adults during a Repetitive Manual Task.” Ergonomics 57 (8): 1201–1212. doi:https://doi.org/10.1080/00140139.2014.914576.
- Rohmert, Walter. 1986. “Ergonomics: concept of Work, Stress and Strain.” Applied Psychology 35 (2): 159–180. doi:https://doi.org/10.1111/j.1464-0597.1986.tb00911.x.
- Rohmert, Walter, and Josef Rutenfranz. 1983. “Erholung Und Pause.” In Praktische Arbeitsphysiologie. Begr. von Gunther Lehmann. Hrsg. von Walter Rohmert u. Joseph Rutenfranz. Mit Beitr. von. 3., neubearb. Aufl, edited by Gunter Lehmann, Walter Rohmert, and Josef Rutenfranz, 86–93. Stuttgart: Thieme.
- Sonne, Michael W., Joanne N. Hodder, Ryan Wells, and Jim R. Potvin. 2015. “Force Time-History Affects Fatigue Accumulation during Repetitive Handgrip Tasks.” Journal of Electromyography and Kinesiology 25 (1): 130–135. doi:https://doi.org/10.1016/j.jelekin.2014.10.017.
- Steinberg, Ulf. 2012. “New Tools in Germany: development and appliance of the first two KIM ("lifting, holding and carrying" and "pulling and pushing") and practical use of these methods.” Work 41 (Suppl 1): 3990–3996. doi:https://doi.org/10.3233/WOR-2012-0698-3990.
- Sullivan, Diana, Pamela Bryden, and Jack P. Callaghan. 2002. “Inter- and Intra-Observer Reliability of Calculating Cumulative Lumbar Spine Loads.” Ergonomics 45 (11): 788–797. doi:https://doi.org/10.1080/00140130210153496.
- Sutherland, Chad A., Wayne J. Albert, Allan T. Wrigley, and Jack P. Callaghan. 2008. “A Validation of a Posture Matching Approach for the Determination of 3D Cumulative Back Loads.” Applied Ergonomics 39 (2): 199–208. doi:https://doi.org/10.1016/j.apergo.2007.05.004.
- Valero, Enrique, Aparajithan Sivanathan, Frédéric Bosché, and Mohamed Abdel-Wahab. 2016. “Musculoskeletal Disorders in construction: A Review and a Novel System for Activity Tracking with Body Area Network.” Applied Ergonomics 54: 120–130. doi:https://doi.org/10.1016/j.apergo.2015.11.020.
- Waters, T., S. Yeung, A. Genaidy, J. Callaghan, H. Barriera-Viruet, S. Abdallah, and S. Kumar. 2006. “Cumulative Spinal Loading Exposure Methods for Manual Material Handling Tasks. Part 2. Methodological Issues and Applicability for Use in Epidemiological Studies.” Theoretical Issues in Ergonomics Science 7 (2): 131–148. doi:https://doi.org/10.1080/14639220500111459.
- Waters, T., S. Yeung, A. Genaidy, J. Callaghan, H. Barriera-Viruet, and J. Deddens. 2006. “Cumulative Spinal Loading Exposure Methods for Manual Material Handling Tasks. Part 1: Is Cumulative Spinal Loading Associated with Lower Back Disorders?” Theoretical Issues in Ergonomics Science 7 (2): 113–130. doi:https://doi.org/10.1080/14639220500111392.
- Winkel, J., and S. E. Mathiassen. 1994. “Assessment of Physical Work Load in Epidemiologic Studies: Concepts, Issues and Operational Considerations.” Ergonomics 37 (6): 979–988. doi:https://doi.org/10.1080/00140139408963711.
- Zimmermann, C. L., T. M. Cook, and V. K. Goel. 1993. “Effects of Seated Posture on Erector Spinae EMG Activity during Whole Body Vibration.” Ergonomics 36 (6): 667–675. doi:https://doi.org/10.1080/00140139308967928.