
Abstract
Previous research has found that the traditional approach to measuring hazard perception, as used by the UK Government, does not necessarily transfer well to other countries. The speeded response times of a hazard perception test were susceptible to threshold bias, differentiating drivers according to cultural background more than driving experience. An alternative method – the hazard prediction test – appears to mitigate these problems when used across different countries. The current study applies the hazard prediction methodology to a new cultural context (Israel), delivered via an online platform. A further innovation was to include both hazardous and non-hazardous trials allowing measures of criterion and sensitivity parameters of the Signal Detection Theory to be calculated.
In total, 74 participants (43 experienced and 31 novices) watched 26 hazard prediction clips that had been filmed in Tel Aviv (Israel), 13 of which contained cues to genuine hazards. Each hazardous clip was occluded prior to the hazardous situation fully materialising, though with sufficient evidence that any participant who was looking in the right place at the right time would be able to correctly identify the unfolding hazard. Participants were first asked to identify whether there was a hazard (a binary decision), and then to predict how the traffic situation was going to develop by choosing one of four options provided after each video.
As hypothesised, experienced drivers outperformed novices in the multiple-choice prediction question, provided that they had correctly identified that the clip contained a hazard in the first question. Novices were poor at selecting the correct multiple-choice option, regardless of whether they correctly identified that the clip contained a hazard. Both driving experience and hazard sensitivity significantly predicted multiple-choice accuracy, though criterion did not. The newly developed online test was successful in differentiating between experienced and novice driver groups for accuracy in prediction. These results support the roll-out of the hazard prediction methodology across different countries.
Practitioner summary: This study provides new insights into how to develop an online hazard prediction test suitable for international export. The results suggest that this newly developed test is successful in differentiating between experienced and novice drivers. This raises the possibilit y of assessing and training drivers on a global scale.
1. Introduction
1.1. Hazard perception and hazard prediction
Hazard Perception refers to the ability of a driver to identify a potentially dangerous on-road situation as quickly as possible (Horswill and McKenna Citation2004). A considerable body of literature provides evidence that hazard perception (HP) tests can differentiate between driver groups based on experience or crash-risk (Boufous et al. Citation2011; Drummond Citation2000; Horswill and McKenna Citation1999; Wells et al. Citation2008; Wetton, Hill, and Horswill Citation2011). Published results have not always been consistent however, and several research groups in different countries have failed to replicate the basic experiential effect (Chapman and Underwood Citation1998; Crundall, Underwood, and Chapman Citation2002; Sagberg and Bjørnskay Citation2006 ; Borowsky, Shinar, and Oron-Gilad Citation2010; Underwood et al. 2013) and crash-risk effect (e.g., Groeger, Field, and Hammond Citation1998). This mixed evidence is especially noticeable when examining research from different countries where each research group has developed their own HP test using different methodologies and analyses. For instance, in Norway researchers used continuous hazardous footage coupled with a secondary task (e.g. Sagberg and Bjørnskay Citation2006); in Israel, researchers advocate the use of survival analysis (Parmet, Meir, and Borowsky Citation2014); in Singapore, Yeung and Wong (Citation2015) employed staged, abrupt hazards in contrast to the developing hazards preferred in the national UK test; in Germany, Malone and Brünken (Citation2015) published one of the few studies using CGI (Computer-Generated Imagery) clips rather than naturalistic video, and also introduced non-hazardous situations. The variation in stimuli, tasks, experimental designs, and analyses make it difficult to directly compare these studies and could be responsible for the mixed results.
Many researchers have aimed to improve upon the basic hazard perception methodology that was first developed in the UK, and this has likely fuelled the divergence of methods in the field. Indeed, Moran et al.’s (Moran, Bennett, and Prabhakharan 2020) recent 2019 review of hazard perception methodologies has identified over 100 separate measures, several of which have been highly successful in finding performance differences between drivers on the basis of experience and crash risk. For instance, Wetton, Hill, and Horswill (Citation2011) required drivers to respond to hazards by clicking on them. The speed of responses within a spatial scoring window was found to produce considerable effect sizes when comparing safe and less-safe drivers.
One other variation on the traditional hazard perception methodology seeks to simplify hazard testing into a transparent and straightforward assessment of perhaps the core skill that underlies hazard perception skill: hazard prediction. Based on a test developed by Jackson, Chapman, and Crundall (Citation2009), the test replaces potentially confounded response-time measures used in the national UK hazard perception test, with measures of accuracy to the question ‘what happens next?’ following occlusion at the point of hazard onset. Research has demonstrated the ability of this test to differentiate between groups of drivers based on experience, crash risk and offender status across a variety of countries (e.g. Castro et al. Citation2016; Crundall Citation2016; Crundall and Kroll Citation2018; Horswill, Hill, and Jackson Citation2020; Lehtonen et al. Citation2017). The most recent iteration of this test uses multiple-choice options, which allows automatic scoring and feedback for participants but does not compromise the effectiveness of the test (Ventsislavova and Crundall Citation2018).
Ventsislavova et al. (Citation2019) recently compared performance on identical hazard perception and hazard prediction tests with the only difference being the mode of response and the fact that the clips occlude at the point of hazard onset in the prediction test. Both tests were conducted on novice and experienced drivers in China, Spain and the UK. They found that experienced drivers outperformed novices on prediction accuracy across all three countries (using clips filmed in their respective countries). However, no differences were found for prediction accuracy when scores were compared across all three nationalities, suggesting that the prediction test methodology mitigates the impact of cultural differences in driving. In contrast, performance on the hazard perception test (requiring a speeded response to a fully materialised hazard) was sensitive to the nationality of participants, with the UK drivers being the fastest to react to hazards and Chinese drivers the slowest. There were no observed differences between the experienced groups for any of the countries on the perception test. When participants were asked to provide hazardous ratings for all clips, the Chinese drivers rated all clips as less hazardous than the other driver groups revealing the likely cause of cultural differences in response times to the hazard perception test. In addition, both Spanish and UK drivers produced more button responses to potential hazards in comparison to the Chinese participants. Ventsislavova et al. (Citation2019) argued that these results could be due to differences in cultural hazard thresholds rather than hazard perception skills per se. Chinese drivers might have a higher threshold for deciding that a situation is hazardous, perhaps as a result of desensitisation to hazards through exposure to roads with a greater number of collisions (most of our Chinese clips were filmed in Beijing), hence their reluctance to respond. In contrast experienced drivers from all three countries outperformed novices on the hazard prediction test, with no apparent differences found between any of the nationalities. Clearly, asking participants to respond in a timely manner to a hazard, involves their own criterion of how hazardous a certain situation is to them. Specifically, UK hazards seemed to not pass the hazardous threshold limit of Chinese participants. These results showed that the classic hazard perception test, exemplified in the UK national test, is more sensitive to cultural differences than experiential differences and is therefore less suitable for international export than the hazard prediction test.
This was not the first study to draw such conclusions. Lim, Sheppard, and Crundall (Citation2013, Citation2014) also conducted a hazard perception test and a hazard prediction test, comparing UK and Malaysian clips across UK and Malaysian drivers. Similarly, they found the prediction test to be more effective in differentiating between experienced and novice drivers, while the hazard perception test again showed cultural sensitivity with UK drivers responding to hazards faster than Malaysians. Both Ventsislavova et al. (Citation2019) and Lim, Sheppard, and Crundall (Citation2014) concluded that any hazard test should be adapted to the specific cultural context it is targeted at, and that the results of the test should not be influenced by cultural bias. They agreed that the hazard prediction test appears to be the better format to meet this requirement.
Recently, the hazard prediction test has been linked to self-reported crashes (Horswill, Hill, and Jackson Citation2020). Using a slightly different approach, Horswill, Hill, and Jackson (Citation2020) asked Australian drivers to predict as many eventualities as possible. A greater number of predictions was linked to retrospective self-report crash data. Their results showed that those drivers who did not report being involved in a crash in the past two years predicted significantly more hazardous situations in comparison to those who did report crashes. They also found that their experienced drivers predicted significantly more hazards than the novices. These results show the robustness of the hazard prediction paradigm. While the approach of Horswill, Hill, and Jackson (Citation2020) was much richer than probing drivers for a single prediction, it can be argued to test something slightly different to other hazard prediction tests. The prediction tests of Ventsislavova et al. (Citation2019), Crundall (Citation2016), and Lim, Sheppard, and Crundall (Citation2014), are primarily concerned with ‘What will happen next?’ rather than ‘What might happen next?’ The emphasis is on determining which hazardous precursors develop into an actual hazard. It may be easier to identify a car in a side road that could pull out in front of you, but it requires an appreciation of more subtle cues to identify if that car will pull out.
The majority of hazard perception research tends to report results from Western countries which can create a biased perspective of what we understand by ‘driving behaviour’. Western countries are highly similar in terms of culture and road laws and generalisability between these countries is not as challenging as when attempted in developing countries (e.g. Malaysia, China). The need to conduct research beyond western countries (where crashes are relatively low) in order to gain a better insight of different driving contexts and behaviour has been supported by several recent studies. Exposure to different cultural environments and norms can lead to differences in driving style, visual search strategies and one’s criterion of what constitutes a hazard (Di Stasi et al. Citation2020; Miller, Chapman, and Sheppard Citation2021; Ventsislavova et al. Citation2019). Miller, Chapman, and Sheppard (Citation2021) assessed differences between UK and Malaysian drivers in relation to how they explore Eastern (Malaysia) and Western (UK) driving environments. They used static road images and asked participants to select those areas that they would choose to look at if they were driving (via mouse click). While both nationalities did not differ in their spread of search, Malaysians focussed more on task irrelevant information compared to the UK drivers. In addition, Malaysian roads seemed to contain higher visual complexity (due to visual clutter) than the UK roads reflecting in both nationalities a wider spread of search while exploring Malaysian roads. Bazilinskyy et al. (Citation2020) found similar cross-cultural differences in relation to the complexity of the road environment. All nationalities (India, United States, Venezuela, Western Europe) that took part in their study perceived Indian roads to be the riskiest while Western European roads were considered the safest. Participants also perceived those hazards they were familiar with as less risky in comparison to unfamiliar hazards. Conversely, Ventsislavova et al. (Citation2019) did not find a familiarity effect across hazards, although Chinese hazards were rated as the most hazardous (supporting the visual complexity hypothesis). These findings support the idea that the cultural driving context has a clear impact on how we perceive hazards and what we consider as hazardous. This can create a biased perspective on hazard perception/risk appraisal among drivers from different countries. Such bias makes it difficult to assess driving skills especially if hazard tests are predominantly created in Western countries where the type of hazards differs considerably from those in the Eastern countries. As a result, more hazardous roads could make drivers less sensitive to hazards with a low tendency to report these hazards (Ventsislavova et al. Citation2019).
Even within Western and Eastern Europe, drivers have been found to differ in the way they respond to hazards. Di Stasi et al. (Citation2020) compared hazard perception responses across Ukrainian, Italian, Spanish, and Swedish drivers. Participants were asked to assess the hazardousness of still images depicting a variety of hazardous situations and make a decision on whether they would brake or continue their trajectory. Interestingly, Ukrainian drivers made faster decisions than Swedish drivers. The authors argued that Ukrainian drivers had a more urgent response as they spent less time evaluating the situations due to the higher probably to be involved in a road collision in Ukraine. In turn, Swedish drivers showed an optimistic bias towards the hazardous images which was interpreted as a misperception about having lower probabilities to be involved in road collisions.
There is a clear need to consider cultural differences and adapt assessment tools to the particularities of each cultural driving context. To measure hazard prediction successfully in different countries (and differentiate between groups of different experience), we first need to ensure that all clips are representative of the particular driving context. In addition, the test should be free of threshold bias and differentiate between different driver groups on the basis of experience or crash risk, rather than on the cultural particularities of the sample. Therefore, more research focussing on demonstrating cultural validity is needed to provide the basic blueprint for a valid hazard prediction test, featuring a wider range of hazards in different countries. Ventsislavova et al. (Citation2019) already highlighted the need of a standardised hazard perception/prediction methodology which could be applied successfully anywhere in the world. This is our first attempt to apply our nascent blueprint for a culturally agnostic test in a completely new cultural context (Israel), which differs to those countries in which we have developed the blueprint (UK, Spain, China, Malaysia).
1.2. Features of the hazard prediction test and evidence of its effectiveness
The most remarkable feature of the hazard prediction test is its ability to differentiate drivers based on their driving experience independently of their cultural background. Several studies have discussed the influence that criterion bias has on the more traditional hazard perception approach (Egea-Caparrós et al. Citation2016; Horswill and McKenna Citation2004; Wallis and Horswill Citation2007; Underwood, Ngai, and Underwood Citation2013). Wallis and Horswill (Citation2007) reported that novices required a higher threshold to consider a situation as hazardous and Egea-Caparrós et al. (Citation2016) reported that a delay in detecting hazards is linked to a stricter criterion. Conversely, Ventsislavova et al. (Citation2016) did not find differences for criterion between experience and novice drivers in their hazard prediction test.
As neither criterion nor sensitivity have been linked directly to accuracy in prediction, this study aims to investigate both variables together with driving experience. It is expected that the resultant statistical model will significantly predict accuracy with experienced drivers being more sensitive to hazards, and perhaps with a more conservative criterion for considering a situation as hazardous. If, however, the criterion does not significantly predict accuracy this would support the notion that hazard appraisal does not impact on how accurate one is in predicting what will happen next in these situations.
An important feature of recently created hazard prediction tests (e.g., Crundall and Kroll Citation2018; Ventsislavova and Crundall Citation2018; Ventsislavova et al. Citation2019) is that the new stimuli contain mirror information (left, right and rear-view mirrors) which not only reflect a more realistic driving environment (and the demands of a more realistic environment) but also provide cues that help to predict overtaking hazards. Overtaking and undertaking hazards are not included in the national UK hazard perception test and the viewer does not have access to any precursors to such hazards. Nonetheless, overtaking and undertaking hazards do pose a problem on the roads, and even more so in developing countries. The provision of mirror information allows these hazards to be included. Drivers also need to pay attention to mirrors when overtaking or changing lanes, and mirror information in hazard perception clips can be very useful in assessing whether drivers check these areas of potential danger (Shahar et al. Citation2012; Zhang and Ioannou Citation2016). Moreover, the mirror information provides additional places to look and greater immersion which should evoke more realistic patterns of behaviour (i.e., with more information to check, less experienced drivers may be less likely to be looking in the appropriate location which is essential for hazard prediction) (Allen et al. Citation2005).
Another important feature of the most recent hazard prediction tests is the use of multiple-choice options as a response, which is both time and cost effective. The original hazard prediction test was developed as a free-response test, which took time to code and had the potential problem of rater error. Horswill, Hill, and Jackson (Citation2020) already highlighted the possibility of raters’ judgments being influenced by their expectations when evaluating participants’ responses. For that reason, a multiple-choice version was created which provides automatic and unambiguous coding. Several studies have already successfully adopted this methodology (Crundall and Kroll Citation2018; Kroll et al. Citation2020; Lim, Sheppard, and Crundall Citation2014; Ventsislavova et al. Citation2016). Ventsislavova and Crundall (Citation2018) compared a free-response prediction test to a multiple-choice version to ascertain whether the MCQ variant was less effective at finding an experiential difference. They found that both versions successfully differentiated between the experienced groups but only the multiple-choice version correlated significantly with driving experience. Thus, the MCQ format may not only be more efficient, it may also better reflect driving experience. It should be noted, however, that the development of plausible options is not a trivial task. Implausible distracter options that do not reflect the hazardous situation presented in the clip could be too easily identified and rejected allowing the participant to choose the correct response by default. Therefore, we have followed the guidelines of Worthen et al. (Citation1999) and Haladyna, Downing, and Rodriguez (Citation2002) in the creation of distracter items, as this method proved to be successful in previous studies (e.g. Ventsislavova and Crundall Citation2018).
The current test was created following a prediction test ‘blueprint’ that has evolved from studies conducted in Malaysia, China, Spain the UK (Castro et al. Citation2016; Lim, Sheppard, and Crundall Citation2014; Ventsislavova et al. Citation2019). This blueprint includes new developments in the method and stimuli (e.g. use of MCQs, clips to include mirror information), and follows development guidelines suggested by Ventsislavova et al. (Citation2019). If the blueprint results in a test that is truly culturally agnostic, we should expect the new test to be applicable to novel countries beyond those in which it was developed. To this end, the current prediction test was created for a country that has not previously been featured in our studies: Israel. Successful differentiation between drivers on the basis of driving experience will support our argument that our test guidelines can be applied to other countries to produce a valid test of drivers’ hazard prediction skills.
1.3. Hazard perception in Israel
In 2018 Israel recorded 12,167 road crashes in which 316 people died (International Transport Forum Citation2019). To put this into context, that is one fatality for every 23,440 residents (compared to one fatality per 36,842 residents in the UK). Vehicles (30%) and pedestrians (31%) account for the majority of Israeli traffic collisions. In 2018, road fatalities decreased compared to 2017. The largest decrease in fatal injuries was observed for the 18–20-year olds (63%), followed by the 15–17 years olds (48%) and 0–14 years olds (38.5%) (International Transport Forum Citation2019). The latest updates by the National Road Safety Authority in Israel, however, reported that traffic-related deaths rose by 10% during 2019, with 349 people killed. Most of the collisions are reported in Tel Aviv, which is the most congested city in Israel, especially during rush hours, as vehicles access and leave the city every day.
Israel has a strong record of traffic psychology research. In recent years there have been studies in hazard perception (e.g. Hoffman and Rosenbloom Citation2016), young drivers (Taubman-Ben-Ari et al. Citation2018; Korn, Weiss, and Rosenbloom Citation2017), risky driving (Taubman-Ben-Ari, Mikulincer, and Gillath Citation2004), and studies of driving behaviour among the ultraorthodox population (Guggenheim and Taubman-Ben-Ari Citation2015, Rosenbloom, Nemrodov, and Barkan Citation2004; Rosenbloom, Shahar, and Perlman Citation2008).
Unlike the hazard prediction test, the more typical hazard perception test has already been studied by several research groups within the Israeli context. Some of the studies have solely focussed on examining hazard perception skill within different driving groups (Rosenbloom, Perlman, and Pereg Citation2011; Hoffman and Rosenbloom Citation2016), while others have also added hazard categorisation, risk estimation and eye movement measures (Borowsky, Shinar, and Oron-Gilad Citation2010; Borowsky and Oron-Gilad Citation2013). Rosenbloom et al. (2015) even developed a hazard perception test suitable for pedestrians with ostensible benefits as a training system to help improve pedestrians’ safety.
One particularly pertinent study tested the hazard perception skill of motorcyclists vs. car drivers using car-based hazard clips and a 5-point scoring system based on that used in the UK national test (Rosenbloom, Perlman, and Pereg Citation2011). They found the motorcyclists to outperform the car drivers, while crash-involved drivers also scored lower on the hazard perception test than crash-free drivers. Some years later Hoffman and Rosenbloom (Citation2016) failed to find a difference between experienced and novice drivers using a similar HP test, though they did find that experienced drivers showed higher anxiety under implicit threat when compared to novices.
Borowsky, Shinar, and Oron-Gilad (Citation2010) investigated hazard perception in novice, experienced and elderly drivers featuring potential and materialised hazards. They found that novice drivers are worse at identifying potential hazards than the experienced drivers (however they did not find differences for materialised hazards), which supports the notion that novices have not yet developed their situation awareness and ability to predict hazards. Potential hazards are more difficult to identify as they are not as obvious as materialised hazards, and precursors to these hazards have been found to be more difficult to spot (Crundall et al. Citation2012). This supports the argument that potential hazards, or precursors, are better indicators of driving experience. Another study by Borowsky, Oron-Gilad, and Parmet (Citation2009) that has considered potential hazards (i.e. precursors that do not ultimately lead to hazards), found that experienced drivers classified hazardous situations according to similarities in the traffic environment (urban settings), while novices classified the same situations according to the hazards (a pedestrian). This might suggest that with age and experience drivers tend to focus more on the global aspect of the situation rather than the local aspects (hazard), which in turn might lead to a better precursor detection (as they know what hazards might appear in such environments). Similar results were found in a comparison of taxi drivers to novices, with the former being more sensitive to hidden hazards (Borowsky and Oron Gilad 2013).
Some of the above findings are consistent with previous literature that failed to find differences between experienced groups in the detection of materialised hazards (Chapman and Underwood Citation1998; Crundall et al. Citation2003; Sagberg and Bjørnskay Citation2006; Borowsky, Shinar, and Oron-Gilad Citation2010; Underwood, Ngai, and Underwood Citation2013), and support other studies that have considered potential hazards or precursors to be more important (e.g. Crundall Citation2016; Vlakveld Citation2014). For that reason, it would be interesting to test the hazard prediction skills of this population and to assess whether experienced drivers will perform better at identifying precursors that will help predict the hazardous situation.
1.4. Overview of the study
Different driving contexts provide drivers with different types of hazards. Therefore, each country can benefit from a hazard prediction test specifically adapted and validated for its driving context. The aim of this study was to create a hazard prediction test featuring hazardous driving situations recorded in the Israeli driving context (following the proposed method of Ventsislavova and Crundall Citation2018), and test whether they can differentiate between experienced and novice driver groups based on their multiple-choice selection when asked ‘What happens next?’ following occlusion. In addition, prior to the multiple-choice question, drivers were asked whether they thought a hazardous event was about to occur (‘Is there a hazard?’). This allows data on hazard appraisal (whether participants believe an imminent event to be hazardous) to be captured at the same time as prediction accuracy (i.e. the ability to predict imminent events regardless of their perceived hazardousness). This allows us to decouple the hazardous nature of the post-occlusion event from the actual prediction and perform a more extensive analysis including the application of Signal Detection Theory (SDT) to assess sensitivity to hazards and the criterion bias of participants.
It was expected that experienced drivers would outperform novices in multiple-choice prediction accuracy. Furthermore, it was also expected that those drivers who reported seeing a hazard in response to the question ‘Is there a hazard?’ will be more likely to select the correct option in response to the second question, ‘What happens next?’ (i.e. drivers who believe that a hazard is about to occur, will be better able to predict what happens next, than drivers who do not believe the clip contains a hazard).
It was also predicted that sensitivity, criterion and driving experience will be significant predictors for accuracy in the multiple-choice prediction question, although considering the mixed results in the literature regarding the relationship between sensitivity, criterion and accuracy in prediction, the relation can go either way.
To this end, 13 hazardous situations and 13 non-hazardous situations were selected from footage filmed in Tel Aviv, Israel. These clips were then converted into a multiple-choice hazard prediction test. Participants were asked first whether they have seen a hazard or not, followed by four possible options to choose from. Only the hazardous trials contained multiple-choice options.
2. Method
2.1. Participants
Seventy-four participants completed the experiment. Forty-three participants were experienced drivers with an average of 14 years of driving experience since passing their test (with an average mileage of 6858) and 31 were novices (19 of whom were still learners) with a mean of 1.5 months of driving experience since starting their driving lessons (average mileage of 619.2). The mean age of the experienced drivers was 33.5 years (18 female), while the mean age of the novices was 18.8 years (15 female) (see ).
Table 1. Demographic data for all participants across driving experience.
All participants were native Israeli drivers that had mainly driven in Israel. None of the participants had to undertake a hazard perception or hazard prediction test to obtain their driving licence, therefore this sample was not familiar with the hazard perception test (in contrast to our typical UK samples).
Participants were contacted via social media advertising and provided with a link to an online hazard prediction test. This allowed us to reach a wider sample than typical opportunity sampling within a campus community. Participants were asked to click on the link and undertake the test following the instructions. Finally, they were asked to provide an email address to claim their 48 Israeli Shekels voucher (equivalent £10). Providing an email address was optional.
2.2. Design
A between-groups design was used, where the primary factor was the driving experience and the dependent variables were the prediction accuracy on the multiple-choice hazard prediction test and whether participants believed there was an imminent hazard (they were shown 13 hazardous and 13 non-hazardous trials in a randomised order). Other dependent variables included participants’ sensitivity (d′) to the appearance of a hazard and their criterion (c) or the tendency to report situations as hazardous or non-hazardous.
2.3. Filming of the hazardous footage
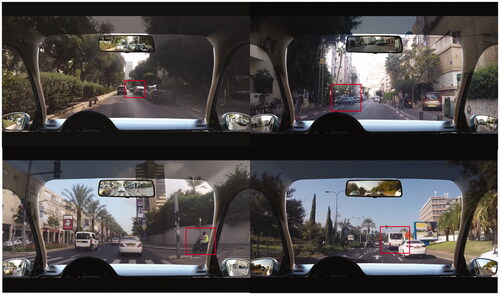
The Israeli footage was specifically recorded for the purposes of this project. The recording took place during daytime, with clear weather conditions. All videos were filmed within the radius of Tel-Aviv and Ramat-Gan (a suburb of Tel Aviv lying 4.3 miles from the centre). Hazards selected for the Israeli HP test were typical hazards occurring during normal everyday driving. The most common hazardous scenarios were dangerous lane changes. The footage was filmed by a native Israeli highly experienced driver. None of the hazards for the Israeli test were staged (for a full description of the Israeli Hazards, see ). The footage used for creating the hazardous videos was filmed following the Health and Safety guidelines approved by the Ethics Committee of Nottingham Trent University. Four cameras were mounted on the car, capturing information coming from the forward view and footage that would normally be seen in the side mirrors, and rear-view mirror ( and ). The forward-view camera was mounted via suction mounts to the windshield on the inside of the car in a way that it would not obstruct the view of the driver. The camera used for recording the rear-view mirror footage was placed inside the car on the rear window also via suction mount. Finally, the right and left mirror information was captured by cameras placed on both right and left side windows, on the outside, immediately below the side mirrors. These cameras were positioned to film what would be visible on the side mirrors. These externally mounted cameras were also tethered to the car to prevent loss in the event of a suction mount failing. A GoPro HERO4 Silver Edition camcorder was used, recording in Full High-Definition format (1080p, 16:9 ratio, medium angle setting).
Figure 1. The frame sequence illustrates the progression of a hazardous trial (prior to occlusion) from the point where the bus starts to turn left (bottom image), through the point where the bus emits a flash of the indicator (middle image) and the point immediately prior to occlusion where the bus has already emitted a couple of flashes of the indicator (top image).
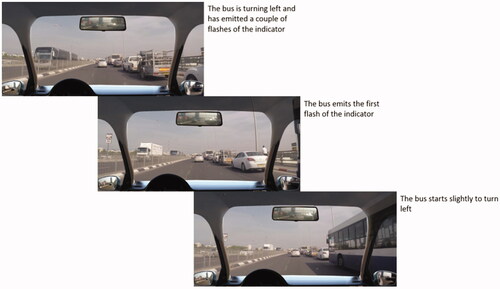
Figure 2. The frame sequence illustrates the progression of a non-hazardous trial (prior to occlusion) from the cyclist in front (bottom image), through the driving car approaching the cyclist (middle image) and the point immediately prior to occlusion where the cyclist simply continues their trajectory.
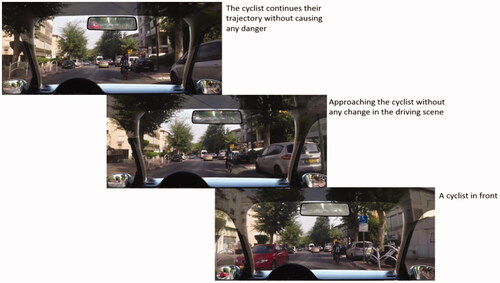
Table 2. A description of the a priori hazardous and non-hazardous traffic situations selected for each clip.
The mirror footage was synchronised with the forward view and edited into mirror placeholders that were contained in a graphic overlay of the inside of a car with Adobe Premiere CC. The overlay was designed to be transparent from halfway up the A-pillars, allowing the forward view to be seen through these sections of the overlay.
2.4. Video clips
Thirteen hazardous and 13 non-hazardous videos were selected from the footage. Each hazardous clip was occluded prior to the hazardous situation fully materialising. There was always, however, a precursor that would help participants predict how the hazardous situation was going to develop. For example, in one clip the camera car is driving on a three-lane carriageway. An urban bus from the right intends to join the lane. The clip occludes when the bus has started to turn left slightly and has emitted a couple of flashes of the indicator (). Regarding the non-hazardous video clips, although there was always a source of potential hazard prior to occlusion, none of these sources led to an actual hazard or indicated that they would lead to a hazard. For example, in one non-hazardous clip the camera car is driving along a narrow urban road and there is a cyclist in front at the point of occlusion (). Had the clip played in full, participants would have seen that the cyclist continues their trajectory without causing any danger, and thus not evolving into a hazardous event. All hazards were captured naturalistically. Hazards are described in detail in .
The stimuli were presented in a randomised order to participants online. They were asked to undertake the experiment using a computer or laptop, but to avoid using a tablet or mobile phone (due to the reduced visibility of the video clips caused by inadequate screen size).
2.5. Test development and clip selection
Prior to the actual experiment, a pilot study was undertaken to test the video clips and generate plausible alternatives for the multiple-choice questions. Two experts in traffic and transport psychology selected the initial set of non-hazardous/hazardous videos and occlusion points (we selected occlusion points proximal to the hazard, see Ventsislavova and Crundall Citation2018 for more information on the method used to select the occlusion points). Four participants (that did not participate in the final experiment) were asked to watch an initial set of 50 videos, report whether they have perceived a hazard and predict the hazardous situations for the hazardous videos. Two were non-drivers and two experienced drivers (three years and nine years of driving experience, respectively). The non-drivers found it particularly difficult to predict hazards when mirrors were required or when the precursor was a turning indicator. The scores for each one of the pilot participants were 30.8, 38.5, 46, and 61% of accuracy for the two non-drivers and experienced drivers (three- and nine-years of experience, respectively). Clips that were predicted by all four participants or by none of the participants (or non-hazardous clips that were reported as hazardous) were removed. The final set comprised 13 hazardous videos and 13 non-hazardous clips, with each hazard successfully predicted by at least one of the experienced participants.
After the clips were selected, an online questionnaire was created to aid in the development of the multiple-choice options. Participants were asked to watch the clips and write down as many possible answers as they could think of, in regard to how the driving situations might develop (they were asked to provide a minimum of four options). Twelve participants, all Israeli drivers with more than 3 years of driving experience, completed the online questionnaire. A link was generated from Qualtrics and posted on social media. The link was shared across the social network of native Israeli drivers (collaborators and colleagues). Potential participants were asked to click on it in order to be directed to the questionnaire and information sheet. Their answers were then subjected to a frequency analysis where semantically similar answers were grouped together. The three most frequent incorrect alternatives were used for each video clip as distracters, along with a correct answer (the wording of which was inspired by participants’ responses).
Once the final set of videos was selected, and the multiple-choice options created, the final test was administered via the online platform Qualtrics. The study (instructions, consent form, alternatives etc.) was translated from English into Hebrew via a forward-backward translation procedure (following the guidelines of International Test Commission; ITC, 2010). The translation into Hebrew was performed by a team consisting of two bilingual experts with a high level of expertise in both Hebrew and English, and expertise in traffic regulations and driving habits.
2.6. Procedure
Participants were recruited via a link to the study that was promoted on social media and through driving schools. Following the link, participants were presented with instructions and a tick-box consent form. Prior to the experiment, participants were instructed that they should only access the test via a PC as the test would not work on mobile devices (i.e. the test was designed not to run on phones etc.). Each clip was preceded by a screen inviting participants to press a ‘play’ button in order to start each video, allowing a self-paced test. To avoid confounds, participants were not able to stop or re-watch any of the video clips, or to remain on the page where the video was displayed longer than its duration (as the first question page appeared automatically after the end of each video). Participants were instructed that they were going to see 26 driving video clips which will cut prior to a potential hazardous situation. It was clearly explained that some of the trials did contain an imminent hazardous situation and some did not (although the video would still cut to black). Prior to the first session, participants viewed a practice trial, where they had the opportunity to familiarise themselves with the experiment. They received feedback on their performance only during the practice; that is, following their selection of a multiple-choice option, the clip was replayed in full, showing the fully materialised hazard and where the precursor was. They were instructed that there will always be a cue/precursor to the hazard which will make a correct prediction possible (providing they were looking in the right place at the right time).
Following each hazardous clip, participants were asked two questions. The first one was whether they had seen evidence for an upcoming hazard. They answered by ticking either yes or no. The second question asked participants to predict how the traffic situation was going to develop by choosing one of the four options provided after each video. Non-hazardous trials were only followed by the first question (‘Was there a hazard?’). While participants were aware that some clips would be followed by a multiple-choice question, the link between this question and the appearance of a hazard was de-emphasised. At the end of the study, participants were debriefed and rewarded with a 48 Israeli Shekels voucher. The duration of the study was approximately 40 minutes.
2.7. Statistical analyses
Our measure of hazard prediction consisted of two questions. We first measured the ability to detect an imminent hazard by asking participants whether they think there was a hazard in the video clip. Then we measured participants’ ability to predict the outcome of the scenario (prediction accuracy) by asking them what will happen next in the driving scene. When a hazard was present in the video clip, participants received a multiple-choice question with four response options, asking them to indicate ‘what will happen next?’. We dichotomised responses into incorrect (coded as 0; three out of four response options) and correct (coded as 1; one out of four response options). As our observations were dichotomous, we used a logit link function (i.e., logistic regression).
Responses are nested both in participants (26 responses for hazardous and non-hazardous situations for 74 participants) and in clips of hazardous situations (74 responses in 13 video clips). This nested structure violates assumptions of linear models. We therefore utilised generalised hierarchical linear modelling to account for this nested structure. In the analyses reported below, we included random intercepts for both participants and clips. Null models indicated that a model with random intercepts for participants and clips had significantly better fit compared to a model without such intercepts, χ2(2) = 121.27, p < .001. In addition, we included random slopes for the association between driver experience and prediction accuracy in video clips. We also included random slopes for the association between imminent hazard (i.e., whether the participant indicated they had seen a hazard or not) and prediction accuracy in participants. We report odds ratios as the effect size.
3. Results
3.1. Internal consistency
The test consisted of 26 videos and showed a good Cronbach’s alpha coefficient of 0.74.
3.2. Hazard identification and prediction accuracy
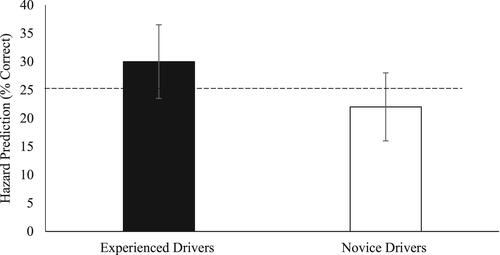
We started by fitting a generalised linear mixed model with regression model with main effects of driver experience (coded: −1 = novice driver and 1 = experienced driver) and correctly identifying an imminent hazard (coded: −1 = did not see the hazard, 1 = saw the hazard) as predictors for prediction accuracy. This model contained random intercepts for clip and participants, random slopes for the effect of driver experience within clips and random slopes for the effect of imminent hazard within participants. We found significant main effects of driver experience and correct identification of an imminent hazard on prediction accuracy. Experienced drivers (M = 0.30, SE = 0.29, 95% C.I. [0.20, 0.43]) were more likely to correctly predict the hazardous situation than novice drivers (M = 0.22 SE = 0.34, 95% C.I. [0.12, 0.35]; b = 0.23, 95% C.I. = [0.04, 0.44], Z = 2.39, p = .017, odds ratio = 1.26; see ). Likewise, when participants thought there was a hazard in the video clip (M = 0.33, SE = 0.32, 95% C.I. = [0.21, 0.48]) they were more likely to correctly predict the hazardous situation compared to when no hazards were reported (M = 0.22, SE = 0.30; b = 0.29, 95% C.I. = [0.13, 0.34], Z = 3.20, p = .001, odds ratio = 1.33).
Figure 3. Percentage of prediction accuracy across driving groups with standard error bars representing 95% confidence interval. The dashed line represents the mean chance expectancy.
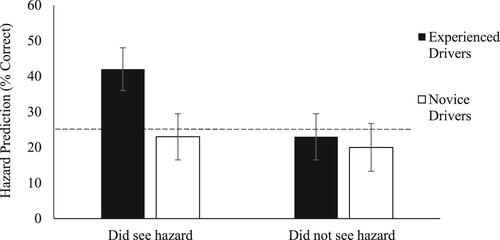
We subsequently added the interaction term between driver experience and participants’ belief that a hazard was imminent to assess its impact on prediction accuracy, which was significant (b = 0.18, 95% C.I. = [0.01, 0.36], Z = 2.08, p = .037, odds ratio = 1.20; see ). A simple slopes analysis was used to decompose the interaction effect. When participants believed an imminent hazard was present in the video clip, experienced drivers (M = 0.42, SE = 0.32, 95% C.I = [0.28, 0.57]) were more likely to correctly predict the hazardous situation than the novices (M = 0.23, SE = 0.38, 95% C.I. = [0.12, 0.38]; b = 0.45, 95% C.I. = [0.17, 0.74], Z = 3.09, p = .002, odds ratio = 1.57). However, when participants believed a hazard was not present, there was no difference on prediction accuracy between experienced drivers (M = 0.23, SE = 0.30, 95% C.I. = [0.14, 0.36]) and novice drivers (M = 0.20, SE = 0.36, 95% C.I. = [0.11, 0.34]; b = 0.09, 95% C.I. = [-0.14, 0.31], Z = 0.73, p = .465, odds ratio = 1.09). From a different angle, for experienced drivers, when they reported to have seen the hazard, they were more likely to accurately predict the hazardous situation compared to when they did not report to have seen a hazard (b = 0.43, 95% C.I. = [0.21, 0.65], Z = 3.84, p < .001, odds ratio = 1.54). However, novice drivers did not show a difference in prediction accuracy between when they saw the hazard and when they did not (b = 0.06, 95% C.I. = [-0.21, 0.33], Z = 0.45, p = 0.653, odds ratio = 1.06)
Figure 4. Percentage of correctly identifying that there was a hazard vs. failing to identify the hazardous situation for the hazardous clips across the experienced groups with standard error bars representing 95% confidence interval. The dashed line represents the mean chance expectancy.
3.3. Analyses of the signal detection theory parameters: d-prime and criterion c
The binary nature of the ‘Have you seen a hazard’ question also allowed Signal Detection Theory measures to be calculated. Sensitivity (d’) is measured by calculating how well participants can discriminate between a hazard-present and a hazard-absent trial (hits and false alarms, using a binary classification of response). Hits were identified as those trials where there was indeed a hazard and participants responded affirmatively. Misses were identified as those trials where there was a hazard, but participants did not believe there to be a hazard. False alarms were those trials where there was not a hazard, however participants reported they have seen an imminent hazard. Finally, correct rejections were those trials where there was not a hazard, with participants responding that they had not seen an upcoming hazard. Both novice and experienced drives had similar average hit percentages (43% hits for each group). Novice drivers reported on average 50% false alarms while experienced drivers reported on average 47% false alarms. A t-test on d' failed to show any differences between driver groups (t(72) = −0.52, p = .60).
A similar t-test was conducted to compare drivers’ criterion c which, in this case, is the tendency to report traffic situation as either hazardous or non-hazardous. The response bias was measured using criterion (c) rather than index β, as it has been argued that is more appropriate for vigilance-like tasks (Wallis and Horswill Citation2007; See et al. Citation1997). No main effect was found for response bias. Experienced drivers did not have a tendency to report more (or fewer) hazards than the novices (t(72) = −0.24, p = .81).
A multiple regression was conducted where sensitivity (d'), criterion (c), and driving experience were used as predictors for multiple-choice prediction accuracy. The overall model was significant F(3,70) = 3.79, p < .01, with R2 = .10. Both sensitivity and driving experience were significant predictors for prediction accuracy, indicating positive association between sensitivity to hazards and prediction accuracy (β = 0.25, t = −2.16, p < .05) and between driving experience and prediction accuracy (β = 0.25, t = 2.15, p < .05). In turn, criterion was not a significant predictor (β = −0.09, t = −0.79, p = .42) for prediction accuracy.
We fitted a second model that included interactions between driver experience and criterion and driving experience and sensitivity. The moderated regression showed that the interaction between driving experience and criterion (β = −0.22, t = −0.33, p = .73) and between driving experience and sensitivity (d-prime) (β = −0.06, t = −1.72, p = .08) were not significant.
3.5. Hazard prediction accuracy for the individual hazardous clips
To assess the contribution of individual clips to this effect, the accuracy for each clip and across experience () was charted. It can be observed that the experienced drivers were overall more accurate at predicting the hazards than the novices.
Figure 5. (a) (Top left) one of the parked cars turns on its brake lights and another car emerges from the right side of the street. (b) (Top right) a car on the left starts reversing back into the main road. (c) (Bottom left) a motorbike appears from the right and approaches the main road without stopping at the red lights. (d) (Bottom right) an urban bus from the right intends to join the lane of the camera car.
However, the pattern of responses for Clips 1, 9, and 10 suggests that all participants did not perform well on these clips. All three clips contain hazards appearing from a side road, aiming to join the main road. More specifically, in Clip 1 the camera car is driving along a narrow residential road, with cars parked on the right side of the street. One of the parked cars turns on its brake lights and another car emerges from the right side of the street. The clip occludes at the moment when the front part of the emerging car is partially visible (). The majority of participants failed to identify the correct answer and opted instead for two of the distracters (the parked car on its brake lights and the car driving in front of the camera car). It could be possible that the parked car obstructed the emerging one thus attracting the attention of the participants (). In Clip 9, a car on the left starts reversing back into the main road. However, participants incorrectly prioritised a pedestrian visible on the right (the most frequently chosen distracter) although this pedestrian does not pose a danger (). Finally, in Clip 10 a motorbike appears from the right and approaches the main road without stopping at the red lights. Participants focussed, however, on the white taxi driving in front of the camera car (). It is possible that the precursors of the hazards described above were too subtle to spot among the other distractors, resulting in participants focussing on more immediate (yet incorrect) sources of potential danger.
Figure 6. Hazard prediction accuracy scores across all hazardous clips for both experienced and novice drivers (with standard error bars added).
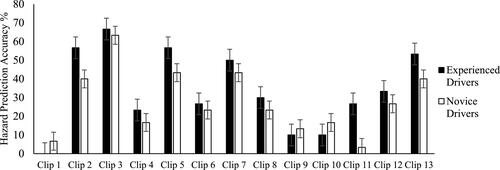
Clip 11, however, seemed to be particularly difficult only for the novices, producing the greatest difference between the two driver groups. In this clip, an urban bus from the right intends to join the lane of the camera car while the traffic lights are green (). To predict this hazard, participants need to spot the flashes of the indicator of the bus when the bus starts to move leftwards immediate prior to occlusion. However, the novices in this study focussed their attention on the traffic light, as this distracter was the most frequently selected option, despite the traffic lights remaining green until the end of the clip.
4. Discussion
This is the first time a hazard prediction test has been specifically developed for unsupervised online testing in the Israeli driving context. Our hazard prediction blueprint was applied for the first time in a country beyond those that have contributed to the development of its methodology. The test featured a multiple-choice format, both hazardous and non-hazardous clips, left right and rear-view mirror information and was administered fully online. The results showed that the newly developed test showed good reliability and was successful in differentiating between experienced and novice driver groups for accuracy in prediction.
Participants appeared to be better able to predict the hazardous situations if they thought they had seen a hazard. The interaction term between driver experience and correctly identifying a hazard on accuracy of hazard prediction showed that experienced drivers predicted significantly more hazards than the novices specifically for those trials where participants reported to have seen hazard, although no differences were found between the groups when there was a hazard but they reported that a hazard was not imminent.
The fact that experienced drivers outperformed novices in prediction accuracy shows that driving experience is associated with qualities that help predict how hazardous situations unfold. All hazardous trials contained precursors to the hazards which should be more easily spotted by the experienced drivers, making the prediction of the hazardous situation plausible. Moreover, there were no differences between the experienced and novice drivers when both groups reported to have not seen a hazard showing that the selected clips are sensitive to drivers’ ability to correctly predict hazardous situations.
Although, this study focussed on the predictive element of hazard perception, sensitivity to hazards and criterion bias were also examined. Experienced drivers did not appear to be better at discriminating between hazardous or non-hazardous situations (sensitivity), neither were there differences between the groups in relation to the threshold bias (experienced drivers did not seem to be more, or less, liberal in their responses). This might seem initially surprising as the present results contradict previous studies that have found differences for at least one of these parameters. For instance, both Wallis and Horswill (Citation2007) and Crundall et al. (Citation2003) argued for criterion differences between experienced and novice drivers (albeit in different directions). In both of these previous studies, however, the participants witnessed fully materialised hazards. In contrast, the current study occluded clips prior to the full materialisation of the hazard. This was specifically intended to reduce any criterion bias in the measure of prediction accuracy. However, it remained possible that some drivers (especially experienced drivers) might be able to predict what happens next (Q2) without considering the unfolding scenario to be hazardous (Q1). The results suggest that this pattern of responding was not a significant problem.
Though the criterion did not predict multiple-choice accuracy, sensitivity did. This result is important for two reasons. First, it is sensible that being able to correctly detect a possible hazardous situation means that one is more aware of such situations and is more likely to be able to predict how the situation is going to develop. Secondly, the fact that the criterion was not a significant predictor of accuracy shows that in this test the threshold bias perhaps does not impact accuracy prediction. We have observed that drivers from countries with more hazardous driving environment show a stricter criterion for reporting a situation as hazardous (their threshold for hazardous situations is high; e.g Bazilinskyy et al. Citation2020; Bränström, Kristjansson, and Ullen Citation2006). This means that criterion is influenced by cultural differences and can impact our understanding of what constitutes a hazardous situation. For example, drivers from the Western countries were found to report higher optimistic bias towards risk assessment (Bränström, Kristjansson, and Ullen Citation2006; DeJoy Citation1989) in comparison to those in low-income countries who are exposed to a greater risk (Lund and Rundmo Citation2009; Nordfjaern and Rundmo Citation2009). Similar results were found by Di Satsi et al. (2020) with Swedish drivers showing a laxer criterion and a more optimistic bias towards the hazardous situations presented in their study in comparison to the Ukrainian drivers. Wang et al. (Citation2019) also assessed cultural differences in criterion bias by comparing hazard perception performance of German and Chinese drivers. Their results showed that Chinese drivers reacted slower to the hazards and time-to-collision scenarios than the German drivers. Exploring the role of criterion bias and its link to cultural differences is of a high importance considering the problems found to export the traditional hazard perception methodology overseas due to the threshold bias issues (Lim, Sheppard, and Crundall Citation2013). Therefore, the finding that criterion bias was not a significant predictor for accuracy in prediction suggest that the current methodology is less sensitive to cultural differences. This is of importance as cultural sensitivity may mask the experiential differences that might otherwise be found (Ventsislavova et al. Citation2019).
Cultural differences not only influence our criterion but our perceptual processes too. Visual attention of Westerners appears to be context-independent and more localised, while Easterners explore the environment in a holistic manner considering the context related to the objects (Nisbett and Miyamoto Citation2005). Miller, Chapman, and Sheppard (Citation2021) demonstrated such differences specifically within the driving context. While both, UK and Malaysian drivers initially focussed on exploring more focal objects, cultural differences did emerge with Malaysian participants showing a higher tendency to select areas irrelevant to the driving task (though the relevance of this finding to the proposed holistic attentional processing is arguable). These findings suggest that there are certain differences in how drivers from different cultures explore the driving environment. Consequently, they could also adopt different strategies for locating hazards.
Finally, the driving context also differs between countries. Typically, the driving environment of developing countries is considerably more cluttered in comparison to developed countries. Ventsislavova et al. (Citation2019) discussed the differences between the Chinese and UK driving environment with the first being considerably more cluttered with several hazards appearing simultaneously. Furthermore, Malaysian and Indian roads have been reported to contain similar features to the Chinese roads. Bazilinskyy et al. (Citation2020) found that different nationalities perceived Indian roads to be the riskiest and Miller, Chapman, and Sheppard (Citation2021) and Lim, Sheppard, and Crundall (Citation2013) observed that their participants rated Malaysian roads as more hazardous than the UK roads. Each driving context produces its own particular hazards. For this reason, the validation and adaptation of the hazard prediction test to each driving context is essential so it can represent the hazards specific to this driving environment. Cross-cultural validation of tools is a common practice, and each test should be validated to its specific driving context to ensure that participants are tested solely on their skills and are not hindered by their cultural backgrounds.
4.1. Limitations
It should be noted that in this study the scores obtained on hazard prediction test were slightly lower in comparison to previous studies (e.g. Gugliotta et al. Citation2017; Ventsislavova and Crundall Citation2018). It might be argued that performance reached a floor effect, as the test appeared to be too hard. Therefore, mean accuracy scores of each group of drivers was compared to chance (25%). Only the experienced drivers scored significantly higher than chance. Although, the test appeared to be hard, it still demonstrated potential differences between different driving groups’ ability to identify hazardous and non-hazardous situations, and it seems that experienced drivers were not randomly guessing the correct answer (as indicated by their chance scores on those trials where they reported not seeing an imminent hazard). However, the accuracy scores of novices were not significantly different from chance. Even though it is expected that novices will perform worse than the experienced drivers, it would be more comforting if novices could also score above chance. There could be two reasons behind novices’ extremely low scores. First, during the pilot session, clips were presented only to two non-drivers and the responses were generated only by experienced drivers (to assure the plausibility of the distracters). Perhaps, showing the videos to a younger, more inexperienced population would have yielded different results. Second, this is the first time we have undertaken a hazard prediction test online. It is possible that participants interacted with this test in ways that are unlikely to happen in the laboratory. For instance, participants may have tried to interact with the videos (e.g. seeking to pause them), which may have prevented them from attending to the appropriate cues. Although pausing the videos was not possible, attempting to do this may have deviated participants’ attention from the main task. Younger participants (i.e. novice drivers) may have been more prone to this distraction: if they interact more than older participants with online videos, they may have greater expectations regarding their ability to control the playback of the clips.
Furthermore, providing the multiple-choice questions only after the hazardous clips could have provided a potential clue for participants to use as feedback. However, we decided against providing multiple-choice options for the non-hazardous clip as these may have been less plausible and therefore created their own form of clue to feedback. In order to mitigate the potential feedback, we informed participants that multiple-choice options would only appear after some of the clips (implying that the appearance of the multiple-choice question was not reliant on the appearance of the hazard). This weakened the potential link between the appearance of a hazard and the appearance of the multiple-choice questions. Thus, we hoped to reduce the clues to feedback that participants might otherwise use to influence their criterion.
Finally, online studies could involve some issues due to the lack of rigorous control. Concerns have been raised regarding the quality of data collected online. Participants in online studies are susceptible to distraction and multitasking which can impact the outcomes. However, some recent studies have argued that participants usually provide quality answers independently of the device or context (Antoun, Couper, and Conrad Citation2017; Huber and Gajos Citation2020). Two recent studies in hazard perception and risk appraisal have reported that online skill testing and training can provide valid results. Horswill et al. (Citation2021) reported that their brief online intervention improved hazard perception scores (Horswill et al. Citation2021). Although Hoswill et al. (2021) did not assess hazard perception/prediction skills of their participants online, the unsupervised training (which involved interacting with hazard perception video clips online) showed improvement of hazard perception skills. These results show that participants seem to engage well with online content. Ventsislavova et al. (Citation2021) also reported a recent study that featured a similar methodology and was conducted online. They assessed willingness to engage in risky driving situations by occluding the clips prior to the risky scenarios. Their online test successfully differentiated between drivers of different age and gender.
4.2. Conclusions and practical implications
The aim of this study was to design a hazard prediction test suitable for the Israeli context based on the findings of previous studies that attempted to validate the test for different driving contexts (e.g., Ventsislavova et al. Citation2016; 2018; Citation2019). Applying a newly developed prediction test in a setting with such a diverse cultural profile was a big challenge. This first attempt seemed to be promising and in view of the consistent results so far (Castro et al. Citation2014; Crundall Citation2016; Jackson, Chapman, and Crundall Citation2009; Lim, Sheppard, and Crundall Citation2014; Gugliotta et al. Citation2017), the hazard prediction test could be considered as a valid option for international export. Since it has been argued that the traditional hazard perception test has poor face validity (Groeger Citation2000), and a mixed evidence base (e.g., Borowsky, Shinar, and Oron-Gilad Citation2010; Chapman and Underwood Citation1998; Sagberg and Bjørnskay Citation2006; Smith et al. Citation2009; Wallis and Horswill Citation2007; Wetton et al. Citation2010), an alternative valid methodology is a valuable addition to our range of measures. Certainly, the newly developed test requires more investigation as this study represents one of only a few studies to measure hazard prediction in different countries. However, this test has shown that performance is not predicted by criterion bias (which is of a high importance for countries with more hazardous environment where drivers are desensitised to hazards) and it requires both early detection and future prediction (which seems to be better predicted by driver experience).
There are numerous practical implications related to the findings of this study. The hazard prediction test could serve as both a diagnostic and training tool. The few other studies that have applied the prediction paradigm in other countries have successfully differentiated between safe and unsafe drivers (at least based on experience), independently of the cultural background and driving context. Such relatively large-scale validation provides at least some evidence that the prediction test could contribute to the licencing procedure in many countries.
Teamed with the traditional hazard perception test, the hazard prediction test could be very useful in terms of testing young drivers’ prediction skills (which, similarly to the hazard perception skill, have also been found to develop within the first year of driving experience) and situation awareness (Ventsislavova and Crundall Citation2018). This test also has great potential as a training tool. As drivers are asked to predict a hazardous situation, they might consider several possible outcomes that would enrich their hazard awareness. Indeed, the multiple-choice format forces them to actively consider the possibility of 4 potential outcomes. Furthermore, the multiple-choice hazard prediction test allows immediate feedback of performance, and drivers could also receive guidance on where to direct their gaze in search of possible precursors even prior to the hazardous situation. Thus, drivers will learn not only to react in time to hazards, but to actively search for their precursors.
Finally, the pragmatic features of the hazard prediction test will allow global assessment and training. Research groups in different countries can easily follow the suggested guidelines for a valid test in their own countries, which in turn could reduce collisions around the world.
CRediT author statement
Petya Ventsislavova: Conceptualisation, Methodology, Software, Validation, Formal analysis, Investigation, Resources, Data curation, Data Collection, Supervision, Writing - original draft, Writing - review & editing. Tova Rosenbloom: Resources, Translation, Data Collection, Writing - review & editing. Joost Leunissen: Formal Analysis, Writing - review & editing. Yishai Spivak: Translation, Data Collection. David Crundall: Conceptualisation, Methodology, Software, Validation, Writing - original draft, Writing - review & editing, Funding acquisition.
| Abbreviations | ||
| OHPTDDBDDG | = | Online hazard prediction test demonstrates differences between different driving groups |
Acknowledgement
We would also like to thank Alon Karni for filming the footage and Nardeen Dai for helping with data collection.
Disclosure statement
No potential conflict of interest was reported by the author(s).
Additional information
Funding
References
- Allen, R. W., G. Park, M. Cook, D. Fiorentino, and E. Viirre. 2005. “Novice Driver Training Results and Experience with a PC Based Simulator.” Proceedings of the 2nd International Driving Symposium on Human Factors in Driver Assessment, Training and Vehicle Design: Driving Assessment 2003.
- Antoun, C., M. Couper, and F. Conrad. 2017. “Effects of Mobile versus PC Web on Survey Response Quality: A Crossover Ex-Periment in a Probability Web Panel.” Public Opinion Quarterly 81 (S1): 280–230. doi:https://doi.org/10.1093/poq/nfw088.
- Bazilinskyy, P., Y. B. Eisma, D. Dodou, and J. C. de Winter. 2020. “Risk Perception: A Study Using Dashcam Videos and Participants from Different World Regions.” Traffic Injury Prevention 21 (6): 347–353.
- Borowsky, A., and T. Oron-Gilad. 2013. “Exploring the Effects of Driving Experience on Hazard Awareness and Risk Perception via Real-Time Hazard Identification, Hazard Classification, and Rating Tasks.” Accident; Analysis and Prevention 59: 548–565.
- Borowsky, A., T. Oron-Gilad, and Y. Parmet. 2009. “Age and Skill Differences in Classifying Hazardous Traffic Scenes.” Transportation Research Part F: Traffic Psychology and Behaviour 12 (4): 277–287. doi:https://doi.org/10.1016/j.trf.2009.02.001.
- Borowsky, A., D. Shinar, and T. Oron-Gilad. 2010. “Age, Skill and Hazard Perception in Driving.” Accident; Analysis and Prevention 42 (4): 1240–1249.
- Boufous, S., R. Ivers, T. Senserrick, and M. Stevenson. 2011. “Attempts at the Practical on-Road Driving Test and the Hazard Perception Test and the Risk of Traffic Crashes in Young Drivers.” Traffic Injury Prevention 12 (5): 475–482. doi:https://doi.org/10.1080/15389588.2011.591856.
- Bränström, R., S. Kristjansson, and H. Ullen. 2006. “Risk Perception, Optimistic Bias, and Readiness to Change Sun Related Behaviour.” European Journal of Public Health 16 (5): 492–497.
- Castro, C., J. L. Padilla, J. Roca, I. Benítez, P. García-Fernández, B. Estévez, M. F. López-Ramón, and D. Crundall. 2014. “Development and Validation of the Spanish Hazard Perception Test.” Traffic Injury Prevention 15 (8): 817–826. doi:https://doi.org/10.1080/15389588.2013.879125.
- Castro, C., P. Ventsislavova, E. Peña-Suarez, A. Gugliotta, P. Garcia-Fernandez, E. Eisman, and D. Crundall. 2016. “Proactive Listening to a Training Commentary Improves Hazard Prediction.” Safety Science 82: 144–154. doi:https://doi.org/10.1016/j.ssci.2015.09.018.
- Chapman, P., and G. Underwood. 1998. “Visual Search of Driving Situations: Danger and Experience.” Perception 27 (8): 951–964.
- Crundall, D. 2016. “Hazard Prediction Discriminates between Novice and Experienced Drivers.” Accident; Analysis and Prevention 86: 47–58. doi:https://doi.org/10.1016/j.aap.2015.10.006.
- Crundall, D., P. Chapman, N. Phelps, and G. Underwood. 2003. “Eye Movements and Hazard Perception in Police Pursuit and Emergency Response Driving.” Journal of Experiment Psychology: Applied 9 (3): 163–174.
- Crundall, D., P. Chapman, S. Trawley, L. Collins, E. van Loon, B. Andrews, and G. Underwood. 2012. “Some Hazards Are More Attractive than Others: Drivers of Varying Experience Respond Differently to Different Types of Hazard.” Accident; Analysis and Prevention 45: 600–609.
- Crundall, D., and V. Kroll. 2018. “Prediction and Perception of Hazards in Professional Drivers: Does Hazard Perception Skill Differ between Safe and Less-Safe Fire-Appliance Drivers?” Accident; Analysis and Prevention 121: 335–346.
- Crundall, D., G. Underwood, and P. Chapman. 2002. “Attending to the Peripheral World While Driving.” Applied Cognitive Psychology 16 (4): 459–475. doi:https://doi.org/10.1002/acp.806.
- DeJoy, D.M. 1989. “The Optimism Bias and Traffic Accident Risk Perception.” Accident; Analysis and Prevention 21 (4): 333–340. doi:https://doi.org/10.1016/0001-4575(89)90024-9.
- Di Stasi, L., C. Diaz-Piedra, J.M. Morales, A. Kurapov, M. Tagliabue, A. Bjärtå, A. Megias, J. Bernhardsson, S. Paschenko, S. Romero, A. Cándido, and A. Catena. 2020. “A Cross-Cultural Comparison of Visual Search Strategies and Response Times in Road Hazard Perception Testing.” Accident; Analysis and Prevention 148: 105785. doi:https://doi.org/10.1016/j.aap.2020.105785.
- Drummond, A. E. 2000. “Paradigm Lost! Paradigm Gained? An Australian’s Perspective on the Novice Driver Problem.” Presented at the Novice Drivers Conference, Bristol, UK.
- Egea-Caparrós, D., J. García-Sevilla, M. Pedraja, A. Romero-Medina, M. Marco-Cramer, and L. Pineda-Egea. 2016. “Late Detection of Hazards in Traffic: A Matter of Response Bias?” Accident; Analysis and Prevention 94: 188–197.
- Groeger, J. A. 2000. Understanding Driving. London: Taylor and Francis.
- Groeger, J. A., D. Field, and S. Hammond. 1998. Processes Involved in Responding to Risk. Behavioural Research in Road Safety VIII, TRL, Crowthorne, UK.
- Guggenheim, N., and O. Taubman-Ben-Ari. 2015. “Ultraorthodox Young Drivers in Israel – Driving through Cultural Lenses.” Transportation Research Part F: Traffic Psychology and Behaviour 33: 87–96. doi:https://doi.org/10.1016/j.trf.2015.07.011.
- Gugliotta, A., P. Ventsislavova, P. Garcia-Fernandez, E. Peña-Suarez, E. Eisman, D. Crundall, and C. Castro. 2017. “Are Situation Awareness and Decision-Making in Driving Totally Conscious Processes? Results of a Hazard Prediction Task.” Transportation Research Part F: Traffic Psychology and Behaviour 44: 168–179. doi:https://doi.org/10.1016/j.trf.2016.11.005.
- Haladyna, T. M., S. M. Downing, and M. C. Rodriguez. 2002. “A Review of Multiple-Choice Item-Writing Guidelines for Classroom Assessment.” Applied Measurement in Education 15 (3): 309–333. doi:https://doi.org/10.1207/S15324818AME1503_5.
- Hoffman, Y., and T. Rosenbloom. 2016. “Driving Experience Moderates the Effect of Implicit versus Explicit Threat Priming on Hazard Perception Test.” Accident; Analysis and Prevention 92: 82–88.
- Horswill, M. S., A. Hill, and T. Jackson. 2020. “Scores on a New Hazard Prediction Test Are Associated with Both Driver Experience and Crash Involvement.” Transportation Research Part F: Traffic Psychology and Behaviour 71: 98–109. doi:https://doi.org/10.1016/j.trf.2020.03.016.
- Horswill, M. S., A. Hill, D. Rodwell, G. S. Larue, L. Bates, and B. Watson. 2021. “A Brief and Unsupervised Online Intervention Improves Performance on a Validated Test of Hazard Perception Skill Used for Driver Licensing.” Transportation Research Part F: Traffic Psychology and Behaviour 78: 130–136. doi:https://doi.org/10.1016/j.trf.2021.02.003.
- Horswill, M. S., and F. P. McKenna. 1999. “The Development, Validation, and Application of a Video-Based Technique for Measuring an Everyday Risk-Taking Behaviour: drivers' Speed Choice.” The Journal of Applied Psychology 84 (6): 977–985.
- Horswill, M. S., and F. P. McKenna. 2004. “Drivers’ Hazard Perception Ability: situation Awareness on the Road.” In A Cognitive Approach to Situation Awareness: Theory and Application, edited by S. Banbury and S. Tremblay, 155–175. Aldershot, Hampshire: Ashgate Publishing.
- Huber, B., and K. Z. Gajos. 2020. “Conducting Online Virtual Environment Experiments with Uncompensated, Unsupervised Samples.” PLOS One 15 (1): e0227629.
- International Test Commission (ITC). 2010. “International test commission guidelines for translating and adapting tests.” http://www.intestcom.org>.
- International Transport Forum. 2019. Road Safety Annual Report 2018. Paris: OECD Publishing.
- Jackson, L., P. Chapman, and D. Crundall. 2009. “What Happens Next? Predicting Other Road Users' Behaviour as a Function of Driving Experience and Processing Time.” Ergonomics 52 (2): 154–164.
- Korn, L., Y. Weiss, and T. Rosenbloom. 2017. “Driving Violations and Health Promotion Behaviors among Undergraduate Students: Self-Report of on-Road Behavior.” Traffic Injury Prevention 18 (8): 813–819. doi:https://doi.org/10.1080/15389588.2017.1316842.
- Kroll, V., A. K. Mackenzie, T. Goodge, R. Hill, R. Davies, and D. Crundall. 2020. “Creating a Hazard-Based Training and Assessment Tool for Emergency Response Drivers.” Accident; Analysis and Prevention 144: 105607. doi:https://doi.org/10.1016/j.aap.2020.105607.
- Lehtonen, E., H. Sahlberg, E. Rovamo, and H. Summala. 2017. “Learning Game for Training Child Bicyclists’ Situation Awareness.” Accident; Analysis and Prevention 105: 72–83. doi:https://doi.org/10.1016/j.aap.2016.07.036.
- Lim, P.C., E. Sheppard, and D. Crundall. 2013. “Cross-Cultural Effects on Drivers’ Hazard Perception.” Transportation Research Part F: Traffic Psychology and Behaviour 21: 194–206. doi:https://doi.org/10.1016/j.trf.2013.09.016.
- Lim, P. C., E. Sheppard, and D. Crundall. 2014. “A Predictive Hazard Perception Paradigm Differentiates Driving Experience Cross-Culturally.” Transportation Research Part F: Traffic Psychology and Behaviour 26: 210–217. doi:https://doi.org/10.1016/j.trf.2014.07.010.
- Lund, I., and T. Rundmo. 2009. “Cross-Cultural Comparisons of Traffic Safety, Risk Perception, Attitudes and Behaviour.” Safety Science 47 (4): 547–553. doi:https://doi.org/10.1016/j.ssci.2008.07.008.
- Malone, S., and R. Brünken. 2015. “Hazard Perception Assessment: how Much Ecological Validity is Necessary?” Journal of Manufacturing Processes 3: 2769–2776.
- Miller, K., P. Chapman, and E. Sheppard. 2021. “A Cross-Cultural Comparison of Where Drivers Choose to Look When Viewing Driving Scenes.” Transportation Research Part F: Traffic Psychology and Behaviour 81: 639–649. doi:https://doi.org/10.1016/j.trf.2021.07.013.
- Moran, C., J. Bennett, and P. Prabhakharan. 2020. “The Relationship between Cognitive Function and Hazard Perception in Younger Drivers.” Transportation Research Part F: Traffic Psychology and Behaviour 74: 104–119. doi:https://doi.org/10.1016/j.trf.2020.08.008.
- Nisbett, R. E., and Y. Miyamoto. 2005. “The Influence of Culture: Holistic versus Analytic Perception.” Trends in Cognitive Sciences 9 (10): 467–473.
- Nordfjaern, T., and T. Rundmo. 2009. “Perceptions of Traffic Risk in an Industrialised and a Developing Country.” Transportation Research Part F: Traffic Psychology and Behaviour 12 (1): 91–98. doi:https://doi.org/10.1016/j.trf.2008.08.003.
- Parmet, Y., A. Meir, and A. Borowsky. 2014. “Survival Analysis: A Fresh Approach for Analyzing Response Times in Driving-Related Hazard Perception Paradigms.” Transportation Research Part F: Traffic Psychology and Behaviour 25: 98–107. doi:https://doi.org/10.1016/j.trf.2014.05.007.
- Rosenbloom, T., D. Nemrodov, and H. Barkan. 2004. “For Heaven’s Sake Follow the Rules: pedestrians’ Behavior in an Ultra-Orthodox and a Non-Orthodox City.” Transportation Research Part F: Traffic Psychology and Behaviour 7 (6): 395–404. doi:https://doi.org/10.1016/j.trf.2004.10.004.
- Rosenbloom, T., A. Perlman, and A. Pereg. 2011. “Hazard Perception of Motorcyclists and Car Drivers.” Accident; Analysis and Prevention 43 (3): 601–604. doi:https://doi.org/10.1016/j.aap.2010.08.005.
- Rosenbloom, T., A. Shahar, and A. Perlman. 2008. “Compliance of Ultra-Orthodox and Secular Pedestrians with Traffic Lights in Ultra-Orthodox and Secular Locations.” Accident; Analysis and Prevention 40 (6): 1919–1924. doi:https://doi.org/10.1016/j.aap.2008.08.004.
- Sagberg, F., and T. Bjørnskay. 2006. “Hazard Perception and Driving Experience among Novice Drivers.” Accident Analysis and Prevention 28 (2): 407–414.
- See, J.E., J.S. Warm, W.N. Dember, and S.R. Howe. 1997. “Vigilance and Signal Detection Theory: An Empirical Evaluation of Five Measures of Response Bias.” Human Factors: The Journal of the Human Factors and Ergonomics Society 39 (1): 14–29. doi:https://doi.org/10.1518/001872097778940704.
- Shahar, A., E. Van Loon, D. Clarke, and D. Crundall. 2012. “Attending Overtaking Cars and Motorcycles through the Mirrors before Changing Lanes.” Accident; Analysis and Prevention 44 (1): 104–110.
- Smith, S., M. Horswill, M. Wetton, and B. Chambers. 2009. Sleepiness and hazard perception while driving (Road Safety Grant Report No. 2009-001). Canberra, Australia: The Department of Infrastructure, Transport, Regional Development and Local Government.
- Taubman-Ben-Ari, O., M. Mikulincer, and O. Gillath. 2004. “The Multidimensional Driving Style Inventory-Scale Construct and Validation.” Accident; Analysis and Prevention 36 (3): 323–332.
- Taubman-Ben-Ari, O., V. Skvirsky, T. J. Greenbury, and C. G. Prato. 2018. “Explaining Risks behind the Wheel – Comparing Israeli and Queensland Young Drivers.” Transportation Research Part F: Traffic Psychology and Behaviour 58: 184–192. doi:https://doi.org/10.1016/j.trf.2018.05.005.
- Underwood, G., A. Ngai, and J. Underwood. 2013. “Driving Experience and Situation Awareness in HP.” Safety Science 56: 29–35. doi:https://doi.org/10.1016/j.ssci.2012.05.025.
- Ventsislavova, P., and D. Crundall. 2018. “The Hazard Prediction Test: A Comparison of Free-Response and Multiple-Choice Formats.” Safety Science 109: 246–255. doi:https://doi.org/10.1016/j.ssci.2018.06.004.
- Ventsislavova, P., D. Crundall, T. Baguley, C. Castro, A. Gugliotta, P. Garcia-Fernandez, W. Zhang, Y. Ba, and Q. Li. 2019. “A Comparison of Hazard Perception and Hazard Prediction Tests across China, Spain and the UK.” Accident; Analysis and Prevention 122: 268–286.
- Ventsislavova, P., D. Crundall, P. Garcia-Fernandez, and C. Castro. 2021. “Assessing Willingness to Engage in Risky Driving Behaviour Using Naturalistic Driving Footage: The Role of Age and Gender.” International Journal of Environmental Research and Public Health 18 (19): 10227. doi:https://doi.org/10.3390/ijerph181910227.
- Ventsislavova, P., A. Gugliotta, E. Peña-Suarez, P. Garcia-Fernandez, E. Eisman, D. Crundall, and C. Castro. 2016. “What Happens When Drivers Face Hazards on the Road?” Accident; Analysis and Prevention 91: 43–54. doi:https://doi.org/10.1016/j.aap.2016.02.013.
- Vlakveld, W.P. 2014. “A Comparative Study of Two Desktop Hazard Perception Tasks Suitable for Mass Testing in Which Scores Are Not Based on Response Latencies.” Transportation Research Part F: Traffic Psychology and Behaviour 22: 218–231. doi:https://doi.org/10.1016/j.trf.2013.12.013.
- Wallis, T. S. A., and M. S. Horswill. 2007. “Using Fuzzy Signal Detection Theory to Determine Why Experienced and Trained Drivers Respond Faster than Novices in a Hazard Perception Test.” Accident Analysis & Prevention 39 (6): 1177–1185. doi:https://doi.org/10.1016/j.aap.2007.03.003.
- Wang, W., Q. Cheng, C. Li, D. André, and X. Jiang. 2019. “A Cross-Cultural Analysis of Driving Behavior under Critical Situations: A Driving Simulator Study.” Transportation Research Part F: Traffic Psychology and Behaviour 62: 483–493. doi:https://doi.org/10.1016/j.trf.2019.02.007.
- Wells, P., S. Tong, B. Sexton, G. Grayson, and E. Jones. 2008. Cohort II: A Study of Learner and New Drivers: Volume 1 (Road Safety Research Report No. 81). London: Department for Transport.
- Wetton, M. A., A. Hill, and M. S. Horswill. 2011. “The Development and Validation of a Hazard Perception Test for Use in Driver Licensing.” Accident; Analysis and Prevention 43 (5): 1759–1770.
- Wetton, M. A., M. S. Horswill, C. Hatherly, J. M. Wood, N. A. Pachana, and K. J. Anstey. 2010. “The Development and Validation of Two Complementary Measures of Drivers’ Hazard Perception Ability.” Accident; Analysis and Prevention 42 (4): 1232–1239.
- Worthen, B. R., K. R. White, X. Fan, and R. R. Sudweeks. 1999. Measurement and Assessment in Schools. New York: Longman.
- Yeung, J. S., and Y.D. Wong. 2015. “Effects of Driver Age and Experience in Abrupt-Onset Hazards.” Accident Analysis & Prevention 78: 110–117. doi:https://doi.org/10.1016/j.aap.2015.02.024.
- Zhang, Y., and P.A. Ioannou. 2016. “Combined Variable Speed Limit and Lane Change Control for High Way Traffic.” IEEE Transactions on Intelligent Transportation System 99: 1–12.
