
 ?Mathematical formulae have been encoded as MathML and are displayed in this HTML version using MathJax in order to improve their display. Uncheck the box to turn MathJax off. This feature requires Javascript. Click on a formula to zoom.
Abstract
Several professions in industries, such as petroleum, manufacturing, construction, mining, and forestry require prolonged work tasks in awkward postures, increasing workers’ risks for musculoskeletal pain and injury. Therefore, we developed and validated a rule-based model for classifying unilateral and bilateral kneeling and squatting based on 15 individuals wearing personal protective equipment and using three wireless triaxial accelerometers. The model provided both high sensitivity and specificity for classifying kneeling (0.98; 0.98) and squatting (0.96; 0.91). Hence, this model has the potential to contribute to increased knowledge of physical work demands and exposure thresholds in working populations with strict occupational safety regulations.
Practitioner summary: Our results indicate that this rule-based model can be applied in a human-factors perspective enabling high-quality quantitative information in the classification of occupational kneeling and squatting, known risk factors for musculoskeletal pain, and sick leave. This study is adapted for working populations wearing personal protective equipment and aimed for long-term measurements in the workplace.
Background
Several industries require prolonged work in awkward postures (Morken, Mehlum, and Moen Citation2007; Wiggen et al. Citation2011), increasing the risk for musculoskeletal disorders, sick leave, and early retirement (Andersen et al. Citation2016; Morken, Mehlum, and Moen Citation2007). In the industrial sector (e.g. petroleum, manufacturing, construction, mining, forestry), numerous work operations are conducted while kneeling or squatting. The high volume and frequency of kneeling or knee-straining postures have been associated with pain, musculoskeletal disorders, and injuries, such as osteoarthritis and meniscal tears (Breloff et al. Citation2019; Brennan-Olsen et al. Citation2018; McWilliams et al. Citation2011).
Tailored occupational health and safety (OHS) measures could reduce and prevent musculoskeletal problems. However, self-reported data and observations, the predominant tools for measuring physical exposures, suffer from bias and inconsistencies, are time-consuming and expensive (Gupta et al. Citation2017; Koch et al. Citation2016; Kwak et al. Citation2011). Accordingly, objective measurements of physical behaviour using movement sensors (i.e. accelerometers and/or gyroscopes) or video have gained interest in recent years (Afzali Arani, Costa, and Shihab Citation2021; Duncan et al. Citation2018; Twomey et al. Citation2018).
Microsensor technology enables solutions that can objectively measure aspects of physical exposure, such as specific activity types, postures, frequency, and duration with a high level of precision and accuracy (Duncan et al. Citation2018; Seeberg et al. Citation2014; Stewart et al. Citation2018; Twomey et al. Citation2018). Moreover, this methodology has been demonstrated to be more cost-effective than video-based observations (Trask et al. Citation2014). The literature on classification methodology based on data from movement sensors (i.e. accelerometers and/or gyroscopes), can be divided primarily into two groups. The first is rule-based, where the classification is based on a general understanding of the dynamics, kinematics, position, posture, and other descriptions of the work task. Several studies developing human-activity recognition models for the evaluation of physical activity have used a rule-based approach (Hendriksen et al. Citation2020; Korshoj et al. Citation2014; Skotte et al. Citation2014). The second group is supervised machine-learning models, trained by data sets labelled by experts (Papagiannaki et al. Citation2019; Twomey et al. Citation2018). These approaches can also be combined by considering labelled data and machine learning to calibrate the parameters in the mechanism-based methods or by using selected features instead of raw data in the training process of the supervised machine-learning models. We developed our model with a rule-based approach as this method is widely used to classify human movements, is suited for classifying simple cases with clear-cut definitions (Chylek et al. Citation2015), has high generalisability, and can easily be used in relation to other groups (Vrigkas, Nikou, and Kakadiaris Citation2015).
Although several models for movement classification (i.e. lying, standing, walking, running) exist (Crowley et al. Citation2019; Skotte et al. Citation2014), few have been designed to classify lower-limb postures and movements (Burdorf et al. Citation2007; Ditchen et al. Citation2015; Ellegast, Hermanns, and Schiefer Citation2009; Hendriksen et al. Citation2020; Martin et al. Citation2015). Thus, a gap exists in quantitative exposure thresholds for the lower limb (Arvidsson et al. Citation2021) as opposed to the upper limb, where an exposure limit has been proposed (Gupta et al. Citation2021). Hendriksen et al. conducted a validation study on a model enabling classification of kneeling using accelerometers (Hendriksen et al. Citation2020), with the sensor placed just above the tuber calcanei on the lower leg. In addition, the workers did not wear personal protective equipment (PPE). Placing the sensor just above the ankle would induce friction and restrict the ability to move the foot freely and be uncomfortable in workers wearing protective shoes with high shafts. Therefore, we wanted to develop a model suitable for long-term measurements and adapted for working populations using PPE. To ensure a relevant protocol, we conducted several workshops with the ergonomic teams from four petroleum companies to gain insight into how work was performed, what PPE was commonly used, and how its use affected work tasks. As there were no models specifically adapted to working populations using PPE, we developed and validated a rule-based model placing the sensor on the lateral aspect just below the head of the fibula on the lower leg, thereby avoiding conflict with protective shoes with high shafts. This model is capable of classifying bilateral and unilateral kneeling and squatting using wireless triaxial accelerometers in individuals wearing PPE.
Materials and methods
Participants
A total of 15 healthy adults were included in this laboratory-based experimental study (eight males and seven females) with a mean age of 30 ± 5.8 years, height 176 ± 11.5 cm, and weight 78 ± 18.8 kg. The exclusion criteria for participation were: (1) physical disability not allowing kneeling and squatting, (2) bandage and/or adhesives allergy, and (3) inability to follow verbal instructions.
This validation study was approved by the Norwegian Centre for Research Data (NSD). Oral and written consents were given by the participants before participation. All the participants were informed that they could withdraw from the study at any time without giving any reason.
Instrumentation
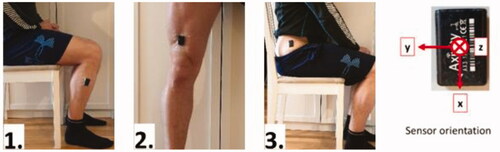
Three AX3 accelerometers (Axivity Ltd., Newcastle upon Tyne, UK) were used to detect the acceleration of different body segments. Acceleration was recorded triaxially with a sample frequency of 100 Hz and a dynamic range of ±8 G (1 G = 9.8 m/s2). shows the positioning of the three accelerometers: (1) attached just below the head of the fibula on the proximal and lateral aspect of the calf, (2) on the distal, anterior, and medial aspects of the femur (∼10 cm above the crest of the patella), and (3) just below the iliac crest of the hip. Specific software (OmGui version 1.0.0.43, Axivity Ltd., Newcastle upon Tyne, UK) was used to configure the sensors and export recorded accelerometer data. Video for validation was recorded by a stationary GoPro Hero3 + Silver camera (GoPro, Inc., Clearview Way, San Mateo, CA, USA) with a resolution of 720p and a frame rate of 30 frames per second.
Figure 1. Sensor placement on: 1. lower leg, 2. thigh, and 3. hip, as well as the sensor orientation seen in all images. The arrows show the direction of positive acceleration with x pointing downward, y to the side, and z into the limb.
Protocol
The research protocol was initiated with a procedure for calibrating sensor orientation and time synchronisation. This calibration procedure began with the participants walking back and forth in a straight line ∼3 m each way before standing still for ∼15 s. Then they performed a vertical jump and stood still for another 15 s. This calibration sequence was repeated at the end of the protocol. Next, participants were instructed to perform the following protocol (shown in ):
Figure 2. Positions performed during the protocol: 1. sitting on chair, 2. sitting on chair with legs under the seat, 3. lying supine on the floor with hip and knee flexion, 4. lying on the side with hip and knee flexion, 5. bilateral kneeling, 6. unilateral kneeling, and 7. squatting.
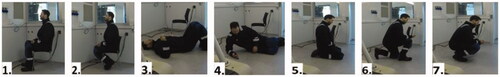
sit on a chair with legs resting on the floor
sit on the chair with legs under the seat of the chair
lie on the floor in a supine position with hip and knee flexion
lie on the side with hip and knee flexion
bilateral kneeling
unilateral kneeling with right and left leg
squatting
All positions seen in were performed four times (sets), and 1 min each, with a short break of a few seconds standing upright between each position.
Observations
Video recordings of the protocol were made to validate the model. The videos were annotated by one person marking the activities of the protocol with start and end points and the name of the activity. All activities that were not part of the protocol were unmarked. An inter-rater reliability test was conducted by two individuals with no previous knowledge of the project who judged all 15 video recordings of the test subjects independently. The raters were asked to identify kneeling and squatting according to the definitions provided in the Appendix. The 15 video recordings comprised a total of 481 observations (all the included positions seen in ), and a single score was assigned to each observation; here, a 1 was assigned if the observed posture was kneeling or squatting (either bilateral kneeling, unilateral kneeling, or squatting), and a 0 if the observed posture was neither kneeling nor squatting but referring to any other posture listed in the Appendix (i.e. sitting on chair). Each posture was rated from start to finish. The annotation of the video recordings was used to investigate the ability of the classification models to classify kneeling and squatting.
Data analysis
Data from the three accelerometers and video recordings with annotation were synchronised using the custom-made software ActivityPresenter (AutoActive Research Environment: https://www.sintef.no/projectweb/autoactive/software-platform/). The classification model development and data analysis of the synchronised data were performed using MATLAB® (R2018b, MathWorks Inc., Natick, MA, USA). The video recordings were annotated frame by frame using specialised video annotation research software (Anvil 6.Ink 2017, Augsburg, Germany) (Kipp Citation2012).
Calculation of lower leg and thigh angles
All accelerometers were virtually rotated during post-calibration to have the z-axis pointing forward (while standing upright) and the x-axis pointing downward. For this rotation, the calibration movements with periods of walking and standing still were used. After post-calibration, the angles between the line of gravity and the downward axis (x-axis) of the lower leg (lower-leg inclination) and of the thigh (thigh inclination) were calculated in the sagittal plane (xz-plane). For the thigh and lower leg, 0° refers to the upright position parallel to the line of gravity with the x-axis pointing down and the z-axis pointing forward. For the lower leg, 90° refers to the horizontal position parallel to the ground with the z-axis pointing down. For the thigh, 90° refers to the horizontal position parallel to the ground with the z-axis pointing up. The classification of kneeling and squatting was performed once considering all sensors (left and right) where the activity was classified if detected on at least one side (either right or left). Furthermore, the classification was performed once considering one side only (only left or right), and only if detected on the considered side of the body (e.g. only left). The classification limits were picked slightly larger than the expected values to account for variation in sensor positioning and leg rotation for different participants, as well as the possible impact from the protective clothes or inclination of the surface the participant is kneeling/squatting on (not the case in this lab study).
Classification of kneeling
Kneeling was defined as a position with at least one knee touching the ground. During kneeling, the lower leg was close to parallel with the ground, while the thigh could be anywhere between resting on the calf up to an upright or slightly forward-tilted position. To classify kneeling, the idea was, therefore, to detect lower-leg inclinations close to parallel with the ground, while the thigh inclination was somewhere between resting on the calf up to tilting slightly forward. Additionally, the value of gravity in the lateral direction (y-axis) of the thigh was lower than ±1 G to distinguish kneeling from lying on the side.
Classification of squatting
Squatting was defined as a position where the lower leg was tilted forward, and the thigh was tilted backward with the feet on the ground. During squatting, the thigh was close to the lower leg. To classify squatting, the idea was, therefore, to detect positions where the lower leg was tilted forward but not parallel to the ground at the same time the thigh was tilted backward. Squatting might be mimicked by sitting with the lower legs bent under the chair and might have some positions similar to kneeling with the lower legs almost parallel to the ground. Additionally, the value of gravity in the lateral direction (Y-axis of the sensor) of the thigh should be lower than ±1 G to distinguish squatting from lying on the side.
Statistical analysis
An inter-rater reliability test was performed in SPSS (version 26.0.0.0, IBM Corp., USA) and calculated using Cohen’s kappa coefficient (Cohen Citation1960). The Cohen’s kappa coefficient was calculated by assigning a single score to each observation (see Appendix) in the videos, corresponding to 1 as bilateral kneeling, unilateral kneeling, and squatting, and 0 as not kneeling and not squatting.
The sensitivity (percentage of correctly classified activity) and specificity (percentage of correctly classified non-activity) were calculated for both models. Furthermore, the positive predictive value (PPV) was calculated for both kneeling and squatting using the following equation: PPV = TP/(TP + FP), where TP is the number of true positive and FP is the number of false-positive classified activities. The sensitivity and specificity were evaluated using sensors on one side only (either left or right leg) or for the combined case with sensors on both sides (left and right leg). For kneeling, all activity not classified as kneeling was classified as ‘other’, and similarly, for squatting, all activity not classified as squatting was classified as ‘other’. The classified activities and the annotated activities were classified for time periods of 1 s (a ‘count’).
Results
Observations
A total of 570 min was observed based on 15 video recordings (or a total of 1140 min observed based on the two observations of 15 video recordings of one leg at a time). shows activity counts, total time, and mean time in minutes spent kneeling, squatting, and engaging in the other activities included in the protocol.
Table 1. Total time in minutes and 1-s counts of kneeling and squatting. The mean value per participant and standard deviation are shown in parentheses.
Inter-rater agreement test
Agreement between the two observers for bilateral kneeling, unilateral kneeling, and squatting was 100%.
Classification model
shows the lower-leg and thigh angles for the different activities (unilateral and bilateral kneeling, squatting, sitting on a chair, and sitting on a chair with the legs under the seat of the chair) for all test subjects. The model made classifications on windows of 1 s, meaning that one count corresponds to 1 s. The areas classified as either squatting (dotted lines) or kneeling (dashed lines) are indicated. The resulting model classifies kneeling or squatting based on the following.
Figure 3. Thigh angle vs. lower-leg angle for different activities for sensors on the left leg (top) and the right leg (bottom). The area within the box with a dotted black line indicates the angles classified as squatting, and the area within the box with a dashed black line indicates the angles classified as kneeling.
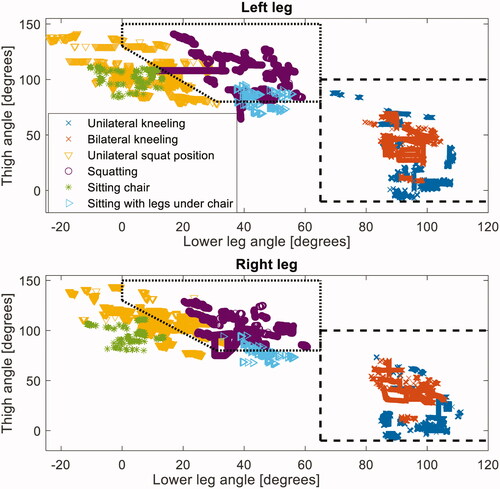
Kneeling: The position was classified as kneeling if the angle between the lower leg and the vertical axis was >65° and the angle between the thigh and the vertical axis was > −10° and <100°. Additionally, the absolute value of the acceleration in the lateral direction of the thigh had to be <0.85 G to avoid classifying lying as kneeling.
Squatting: The position was classified as squatting if the angle between the lower leg and the vertical axis was >0 and <65°, the angle between the thigh and vertical axis was >80 and <150°, and the angle between the lower leg and vertical axis () and between the thigh and vertical axis (
) were larger than the line:
[°]. Additionally, the absolute value of the acceleration in the lateral direction of the thigh had to be <0.85 G to avoid classifying lying as squatting.
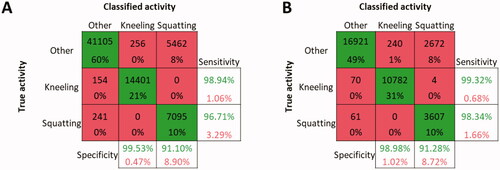
depicts the confusion matrices of the predicted and true activities using sensors on the left or right leg only (1) or on both legs (2), as well as the overall sensitivity and specificity of the classification models for squatting and kneeling. The classification model classified most activities correctly, but for squatting, several ‘other’ activities were incorrectly classified as squatting compared to only a few that were incorrectly classified as kneeling. The sensitivity and specificity of the kneeling classifications were high (>0.98), while for squatting, the sensitivity was rather high (>0.96), but the specificity was clearly lower (>0.91). PPV of kneeling and squatting were 98 and 57%, respectively.
Figure 4. The confusion matrices for the classification models using sensors on: 1. one side of the body only and on 2. both sides of the body. The sensitivity is shown in the green-print numbers in the right-hand columns, and the specificity is shown in the green-print numbers in the lower rows for the kneeling and squatting classification models.
Discussion
This laboratory study developed and validated a rule-based model for classifying bilateral and unilateral kneeling and squatting using wireless triaxial accelerometers in individuals wearing PPE. The main finding was that the model had a very high level of accuracy for classifying both kneeling and squatting.
The sensitivity and specificity for classifying kneeling with sensors mounted on one or both sides of the body were all above 0.98. For squatting, the sensitivity and specificity were above 0.96 and 0.91, respectively. Furthermore, we observed that the classification models with sensors on only one leg performed slightly less accurate compared to the classification models considering sensors on both legs. Wearing sensors on one side of the body only could result in unilateral kneeling on the leg without sensors to be classified as something other than kneeling (e.g. sitting). Therefore, to improve the accuracy of the classification of kneeling, we advise mounting sensors on both legs. However, this would impose a greater burden on the participants. Hence, when it is impractical to measure both, the next best option would be mounting the sensors on the dominant leg of each person to increase the probability of correct classification. The dominant leg was defined as the preferred leg with which one would kick a ball (van Melick et al. Citation2017).
Although the model was able to classify kneeling and squatting with a high level of precision and accuracy, the sensitivity, specificity, and PPV of squatting were less accurate than kneeling. The PPV for squatting was 57%. Hence, there is a moderate probability that the classification of squatting is a false positive and would impact the accuracy of the results when implemented in real-world conditions. Therefore, we would emphasise that this limitation should be considered when classifying squatting in a real-world working environment. The low PPV can partly be explained by more ‘other’ activities being similar to squatting than the kneeling position in terms of thigh and lower-leg angles. ‘Sitting with legs tucked under the seat of the chair’, in particular, is a posture similar to squatting, and the classified angles for both positions overlap (see ). Additionally, squatting includes a greater variation of the position compared to kneeling, which increases the probability of misclassification. Moreover, the participants spent more time performing bilateral and unilateral kneeling (12.1 min) than squatting (4.1 min) (see ). Consequently, there are fewer counts of squatting than of kneeling, likely reducing the sensitivity and specificity and, thereby, resulting in a lower positive predictive value.
Kneeling has been validated by only a few previous studies. Burdorf et al. objectively measured kneeling among floor layers and road workers using wireless technology called DynaPort with multiple accelerometers placed in belts on the body (Burdorf et al. Citation2007). A few other studies also measured knee-straining postures using wired ambulant measuring devices called CUELA (computer-based measurement and long-term analysis of stresses upon the musculoskeletal system), which is a belt system attached to the clothing and containing gyroscopes, potentiometers, and inclinometers (Ditchen et al. Citation2015; Ellegast, Hermanns, and Schiefer Citation2009). However, these studies did not calculate sensitivity and specificity, making them less compared to our study. Furthermore, attaching the sensors to clothes with a belt could cause undesired movement of the sensors relative to the skin, thus increasing the likelihood of misclassification. A study conducted by Martin et al. developed a technical system for the classification of kneeling in women of childbearing age using ActivPal (Martin et al. Citation2015). This study defined kneeling as being on all fours and reached a sensitivity and specificity of 91.4 and 98.4%, respectively, which is somewhat poorer than our model for the classification of kneeling (Martin et al. Citation2015). In addition, only two sensors were used, with the lower leg sensor mounted on the distal end and anterior surface of the tibia (Martin et al. Citation2015), which would not be compatible with protective shoes with high shafts.
The study most comparable to our validation study was conducted by Hendriksen et al. (Citation2020). Small differences were seen when comparing the lower-leg angles in our model with that developed by Hendriksen et al. Our model classified kneeling as having the lower-leg angle >65° and the thigh angle in the range of −10–100°, whereas Hendriksen et al. classified kneeling when the lower-leg angle was between 90 and 135° and the thigh angle was <90°. Also, we placed the sensor on the lateral aspect of the lower leg, just below the head of the fibula (i.e. higher up) to prevent unnecessary pressure and friction to participants wearing protective shoes with high shafts (Hendriksen et al. Citation2020). Furthermore, the participants in our study wore a protective suit with knee pads. The thickness of the knee pads used in the protective suit could have an impact on the angle of the lower leg and can explain why we have chosen a lower limit of the lower-leg angle and a higher angle for the thigh. However, this was not measured and must not be interpreted as conclusive.
This validation study was performed in a laboratory setting under controlled conditions, and the sensitivity and specificity would likely be lower in real-world conditions and long experiments due to, e.g. unpredictable behaviour of the participants or drift in time between sensors. Based on the domain competence available in our research group and industrial partner, the postures included in the protocol were carefully selected as relevant positions that could possibly be misclassified as kneeling or squatting (see ). We could have chosen to include more seldom used and easily detectable postures (such as standing with one leg on the seat of a chair or climbing a ladder) that would have increased the probability of correct classification. Still, we believe that the present model can accurately classify most cases of kneeling and squatting. However, this must be further verified in a study with real-world conditions.
The classification of transitions between activities was not performed in this study as our model was aimed at quantifying long-term measurements of occupational kneeling and squatting since long durations in these postures are associated with musculoskeletal disorders and injuries. Additionally, the AX3 sensors do not have an internal time synchronisation between each sensor. The sensors may, therefore, drift over time, and since transitions between activities are of short duration, it might not be possible to classify them with the current sensor setup. Nevertheless, to some extent, the drift in time could be considered by conducting a reference movement (i.e. vertical jump in the morning or before initiating a work task) for time re-synchronisation, regularly, and to correlate and interpolate the different signals in the post-processing to allow transitions to be classified. However, in long-term measurements, not knowing the behaviour of the participants, including controlling reference movements are challenging as the participants need to remember and mark when it’s conducted without supervision. The extra burden on the participant would likely affect the feasibility of the study. Additionally, the probability of inaccuracy would still be high as the drift over time is not necessarily linear. To perform reference movements would not be applicable to an unsupervised field study with several days of 24/7 monitoring, which is the intended usage for this classification model. Furthermore, there is currently no sensor system that provides adequate automatic time synchronisation for continuous 24/7 measurements with sufficient battery capacity for measurements over several days.
Our model was developed using rule-based modelling for the classification of kneeling and squatting as these positions seem to be more suitable for use when handling less-complex information and clear-cut definitions (Chylek et al. Citation2015; Vrigkas, Nikou, and Kakadiaris Citation2015). However, different methods in human-activity recognition exist, and each has strengths and limitations. Machine-learning methods have advanced in recent years and become more widespread in human-activity recognition (Halilaj et al. Citation2018; Sanhudo et al. Citation2021). One reason for not using supervised machine-learning models in the development of our model is that this approach demands a great amount of labelled training data for robust classification. Therefore, using this approach can be more tedious and resource-intensive. Moreover, machine-learning models randomly make decisions, which could give different results using the same data. This is easier to control when using a simpler rule-based model where specific cut-off values can be set. In addition, a common problem with machine learning is that the algorithm is either too flexible or too complex, struggling with differentiating between noise and the signal (Zhang, Ballas, and Pineau Citation2018) and, thereby, increasing the risk of underfitting or overfitting the data (Roelofs et al. Citation2019). Consequently, such models may lack the ability to generalise. They perform well on training data with known subjects but less well on new data (Halilaj et al. Citation2018). Rule-based models, on the other hand, do not require large amounts of training data and can easily be generalised to new, unseen data sets and subjects (Vrigkas, Nikou, and Kakadiaris Citation2015). This approach uses a set of rules (here, leg angles) to classify different activities, providing the model with a high level of accuracy in the classification of the respective positions. Additionally, rule-based models are much easier to build and verify compared to machine-learning models.
Limitations
The lack of time synchronisation due to possible drift between the sensors is a limitation in this study, as transitions cannot be accurately classified, which increases the probability of misclassification. However, sensor and battery technology are improving rapidly and are becoming more efficient. A consequence is that future movement sensors will require less power and batteries will become smaller with enhanced capacity.
Although a greater age span would most likely have influenced the firmness of the skin, adipose tissue, and muscle mass, we argue that this would not have greatly affected the results as the sensors were attached to the skin with medical tape to prevent the sensor from moving freely on the body. A large amount of adipose tissue or muscle mass could influence some movement of the sensors. However, this would not have been several degrees as the sensors were fixed to the skin with medical tape and not attached directly to clothing. The rather small number of participants can be considered a limitation as we do not know how well the model will perform on new data. However, the rule-based model is expected to be robust and generalisable, and the lab tests were performed with PPE to simulate real-world working conditions more closely.
Conclusion
Using wireless triaxial accelerometers, this study developed and validated a model with high sensitivity and specificity for the classification of kneeling and squatting in workers wearing personal protective equipment. If proven to perform well in real-world conditions, the cost-efficiency of this method makes it suitable for application in epidemiological studies with large sample sizes. Furthermore, the implementation of this model in workplace studies has the potential to contribute to increased knowledge of physical work demands. Therefore, we encourage future researchers to apply the model and develop guidance for exposure thresholds in various working populations, as a dose–response relationship with occupational kneeling and squatting and knee disorders and injuries is currently unknown.
| Abbreviations | ||
| CUELA | = | computer-based measurement and long-term analysis of stresses upon the musculoskeletal system |
| OHS | = | occupational health and safety |
| PPE | = | personal protective equipment |
| PPV | = | positive predictive value |
| TP | = | true positive |
| FP | = | false positive |
Acknowledgements
The authors would like to thank the Norwegian Research Council and their project partners, Equinor, Aker BP, Vår Energi, and Lundin Energy Norway, for financial support through the project ‘Digital Worker and Exposure Risk Assessment’. We would also like to express our sincere gratitude to all the participants in this validation study and the two inter-rater observers for their substantial help.
Disclosure statement
The authors have no conflicts of interest to report.
Additional information
Funding
References
- Afzali Arani, M. S., D. E. Costa, and E. Shihab. 2021. “Human Activity Recognition: A Comparative Study to Assess the Contribution Level of Accelerometer, ECG, and PPG Signals.” Sensors 21 (21): 6997. doi:10.3390/s21216997.
- Andersen, L. L., N. Fallentin, S. V. Thorsen, and A. Holtermann. 2016. “Physical Workload and Risk of Long-Term Sickness Absence in the General Working Population and among Blue-Collar Workers: Prospective Cohort Study with Register Follow-up.” Occupational and Environmental Medicine 73 (4): 246–253. doi:10.1136/oemed-2015-103314.
- Arvidsson, I., C. Dahlqvist, H. Enquist, and C. Nordander. 2021. “Action Levels for the Prevention of Work-Related Musculoskeletal Disorders in the Neck and Upper Extremities: A Proposal.” Annals of Work Exposures and Health 65 (7): 741–747. doi:10.1093/annweh/wxab012.
- Breloff, S. P., A. Dutta, F. Dai, E. W. Sinsel, C. M. Warren, X. Ning, and J. Z. Wu. 2019. “Assessing Work-Related Risk Factors for Musculoskeletal Knee Disorders in Construction Roofing Tasks.” Applied Ergonomics 81: 102901. doi:10.1016/j.apergo.2019.102901.
- Brennan-Olsen, S. L., S. Solovieva, E. Viikari-Juntura, I. N. Ackerman, S. J. Bowe, P. Kowal, N. Naidoo, S. Chatterji, A. E. Wluka, M. T. Leech, R. S. Page, K. M. Sanders, F. Gomez, G. Duque, D. Green, and M. Mohebbi. 2018. “Arthritis Diagnosis and Symptoms Are Positively Associated with Specific Physical Job Exposures in Lower- and Middle-Income Countries: Cross-Sectional Results from the World Health Organization's Study on Global AGEing and Adult Health (SAGE).” BMC Public Health 18 (1): 719. doi:10.1186/s12889-018-5631-2.
- Burdorf, A., J. Windhorst, A. J. van der Beek, H. van der Molen, and P. H. J. J. Swuste. 2007. “The Effects of Mechanised Equipment on Physical Load among Road Workers and Floor Layers in the Construction Industry.” International Journal of Industrial Ergonomics 37 (2): 133–143. doi:10.1016/j.ergon.2006.10.007.
- Chylek, L. A., L. A. Harris, J. R. Faeder, and W. S. Hlavacek. 2015. “Modeling for (Physical) Biologists: An Introduction to the Rule-Based Approach.” Physical Biology 12 (4): 045007. doi:10.1088/1478-3975/12/4/045007.
- Cohen, J. 1960. “A Coefficient of Agreement for Nominal Scales.” Educational and Psychological Measurement 20 (1): 37–46. doi:10.1177/001316446002000104.
- Crowley, P., J. Skotte, E. Stamatakis, M. Hamer, M. Aadahl, M. L. Stevens, V. Rangul, P. J. Mork, and A. Holtermann. 2019. “Comparison of Physical Behavior Estimates from Three Different Thigh-Worn Accelerometers Brands: A Proof-of-Concept for the Prospective Physical Activity, Sitting, and Sleep consortium (ProPASS).” International Journal of Behavioral Nutrition and Physical Activity 16 (1): 65. doi:10.1186/s12966-019-0835-0.
- Ditchen, D. M., R. P. Ellegast, T. Gawliczek, B. Hartmann, and M. A. Rieger. 2015. “Occupational Kneeling and Squatting: Development and Validation of an Assessment Method Combining Measurements and Diaries.” International Archives of Occupational and Environmental Health 88 (2): 153–165. doi:10.1007/s00420-014-0946-5.
- Duncan, S., T. Stewart, L. Mackay, J. Neville, A. Narayanan, C. Walker, S. Berry, and S. Morton. 2018. “Wear-Time Compliance with a Dual-Accelerometer System for Capturing 24-h Behavioural Profiles in Children and Adults.” International Journal of Environmental Research and Public Health 15 (7): 1296. doi:10.3390/ijerph15071296.
- Ellegast, R., I. Hermanns, and C. Schiefer. 2009. Workload Assessment in Field Using the Ambulatory CUELA System. International Conference on Digital Human Modeling ICDHM 2009: Digital Human Modeling, 221–226. Berlin; Heidelberg.
- Gupta, N., C. S. Christiansen, C. Hanisch, H. Bay, H. Burr, and A. Holtermann. 2017. “Is Questionnaire-Based Sitting Time Inaccurate and Can It Be Improved? A Cross-Sectional Investigation Using Accelerometer-Based Sitting Time.” BMJ Open 7 (1): e013251. doi:10.1136/bmjopen-2016-013251.
- Gupta, N., C. L. Rasmussen, M. Forsman, K. Søgaard, and A. Holtermann. 2021. “How Does Accelerometry-Measured Arm Elevation at Work Influence Prospective Risk of Long-Term Sickness Absence?” Scandinavian Journal of Work, Environment & Health. doi:10.5271/sjweh.4000.
- Halilaj, E., A. Rajagopal, M. Fiterau, J. L. Hicks, T. J. Hastie, and S. L. Delp. 2018. “Machine Learning in Human Movement Biomechanics: Best Practices, Common Pitfalls, and New Opportunities.” Journal of Biomechanics 81: 1–11. doi:10.1016/j.jbiomech.2018.09.009.
- Hendriksen, P. F., M. Korshøj, J. Skotte, and A. Holtermann. 2020. “Detection of Kneeling and Squatting during Work Using Wireless Triaxial Accelerometers.” Ergonomics 63 (5): 607–617. doi:10.1080/00140139.2020.1734668.
- Kipp, M. 2012. “Annotation Facilities for the Reliable Analysis of Human Motion.” In Proceedings of the Eighth International Conference on Language Resources and Evaluation, 4103–4107. European Language Resources Association (ELRA).
- Koch, M., L.-K. Lunde, T. Gjulem, S. Knardahl, and K. B. Veiersted. 2016. “Validity of Questionnaire and Representativeness of Objective Methods for Measurements of Mechanical Exposures in Construction and Health Care Work.” PLoS One 11 (9): e0162881. doi:10.1371/journal.pone.0162881.
- Korshoj, M., J. H. Skotte, C. S. Christiansen, P. Mortensen, J. Kristiansen, C. Hanisch, J. Ingebrigtsen, and A. Holtermann. 2014. “Validity of the Acti4 Software Using ActiGraph GT3X + Accelerometer for Recording of Arm and Upper Body Inclination in Simulated Work Tasks.” Ergonomics 57 (2): 247–253. doi:10.1080/00140139.2013.869358.
- Kwak, L., K. I. Proper, M. Hagstromer, and M. Sjostrom. 2011. “The Repeatability and Validity of Questionnaires Assessing Occupational Physical Activity–A Systematic Review.” Scandinavian Journal of Work, Environment & Health 37 (1): 6–29. doi:10.5271/sjweh.3085.
- Martin, C. J. H., L. Kenney, T. Pratt, and M. H. Granat. 2015. “The Development and Validation of an Activity Monitoring System for Use in Measurement of Posture of Childbearing Women during First Stage of Labor.” Journal of Midwifery & Women's Health 60 (2): 182–186. doi:10.1111/jmwh.12230.
- McWilliams, D. F., B. F. Leeb, S. G. Muthuri, M. Doherty, and W. Zhang. 2011. “Occupational Risk Factors for Osteoarthritis of the Knee: A Meta-Analysis.” Osteoarthritis and Cartilage 19 (7): 829–839. doi:10.1016/j.joca.2011.02.016.
- Morken, T., I. S. Mehlum, and B. E. Moen. 2007. “Work-Related Musculoskeletal Disorders in Norway's Offshore Petroleum Industry.” Occupational Medicine 57 (2): 112–117. doi:10.1093/occmed/kql154.
- Papagiannaki, A., E. I. Zacharaki, G. Kalouris, S. Kalogiannis, K. Deltouzos, J. Ellul, and V. Megalooikonomou. 2019. “Recognizing Physical Activity of Older People from Wearable Sensors and Inconsistent Data.” Sensors 19 (4): 880. doi:10.3390/s19040.
- Roelofs, R.,. V. Shankar, B. Recht, S. Fridovich-Keil, M. Hardt, J. Miller, and L. Schmidt. 2019. “A Meta-Analysis of Overfitting in Machine Learning.” Paper Presented at the NeurIPS.
- Sanhudo, L., D. Calvetti, J. P. Martins, N. M. M. Ramos, P. Mêda, M. C. Gonçalves, and H. Sousa. 2021. “Activity Classification Using Accelerometers and Machine Learning for Complex Construction Worker Activities.” Journal of Building Engineering 35: 102001. doi:10.1016/j.jobe.2020.102001.
- Seeberg, T. M., J. Vedum, M. Sandsund, H. O. Austad, A. E. Liverud, A. B. Vardøy, I. Svagaard, and F. Strisland. 2014. “Development of a Wearable Multisensor Device Enabling Continuous Monitoring of Vital Signs and Activity.” Paper Presented at the IEEE EMBS International Conference on Biomedical and Health Informatics (BHI), June 1–4.
- Skotte, J., M. Korshoj, J. Kristiansen, C. Hanisch, and A. Holtermann. 2014. “Detection of Physical Activity Types Using Triaxial Accelerometers.” Journal of Physical Activity & Health 11 (1): 76–84. doi:10.1123/jpah.2011-0347.
- Stewart, T., A. Narayanan, L. Hedayatrad, J. Neville, L. Mackay, and S. Duncan. 2018. “A Dual-Accelerometer System for Classifying Physical Activity in Children and Adults.” Medicine and Science in Sports and Exercise 50 (12): 2595–2602. doi:10.1249/mss.0000000000001717.
- Trask, C., S. E. Mathiassen, J. Wahlström, and M. Forsman. 2014. “Cost-Efficient Assessment of Biomechanical Exposure in Occupational Groups, Exemplified by Posture Observation and Inclinometry.” Scandinavian Journal of Work, Environment & Health 40 (3): 252–265. doi:10.5271/sjweh.3416.
- Twomey, N., T. Diethe, X. Fafoutis, A. Elsts, R. McConville, P. Flach, and I. Craddock. 2018. “A Comprehensive Study of Activity Recognition Using Accelerometers.” Informatics 5 (2): 27. doi:10.3390/informatics5020027.
- van Melick, N., B. M. Meddeler, T. J. Hoogeboom, M. W. G. Nijhuis-van der Sanden, and R. E. H. van Cingel. 2017. “How to Determine Leg Dominance: The Agreement between Self-Reported and Observed Performance in Healthy Adults.” PLoS One 12 (12): e0189876. doi:10.1371/journal.pone.0189876.
- Vrigkas, M., C. Nikou, and I. A. Kakadiaris. 2015. “A Review of Human Activity Recognition Methods.” Frontiers in Robotics and AI 2:28. doi:10.3389/frobt.2015.00028.
- Wiggen, Øystein Nordrum, Sigri Heen, Hilde Færevik, and Randi Eidsmo Reinertsen. 2011. “Effect of Cold Conditions on Manual Performance While Wearing Petroleum Industry Protective clothing.” Independent Health 49 (4): 443–451. doi:10.2486/indhealth.ms1236.
- Zhang, A., N. Ballas, and J. Pineau. 2018. A Dissection of Overfitting and Generalization in Continuous Reinforcement Learning.