?Mathematical formulae have been encoded as MathML and are displayed in this HTML version using MathJax in order to improve their display. Uncheck the box to turn MathJax off. This feature requires Javascript. Click on a formula to zoom.
Abstract
Individual responses to fatigue have been observed in lifting kinematics, suggesting a subject-specific approach is necessary for fatigue identification. One-class support vector machines (OCSVM) may provide an objective method to classify fatigue-related kinematic changes during repetitive lifting. Participants completed a repetitive lifting protocol while motion capture recorded lifting motions. Subject-specific kinematics from participants’ first 35% of lifts trained OCSVM decision boundaries. The remaining lifts were separated into test sets and classified against the decision boundary to identify the percentage of outlier lifts within each test set. Spearman’s correlation assessed if the test sets' percentage of outlier lifts increased concurrently with participants’ rating of perceived exertion (RPE). Significant positive associations were found for participants who demonstrated evidence of fatigue, while no significant associations were found for participants who did not demonstrate evidence of fatigue. These results demonstrate the prospective efficacy of an outlier detection tool for fatigue detection during repetitive lifting.
Practitioner Summary: An objective subject-specific fatigue detection method is desired for workplace tasks, such as lifting. An outlier detection machine learning approach was identified when lifting movement patterns changed from baseline throughout a repetitive lifting protocol. Participants who demonstrated an increase in outlier movement patterns had a concurrent increase in self-reported fatigue.
1. Introduction
Performing cyclic tasks for extended periods, such as repetitive lifting in a workplace, has been shown to lead to the development of work-related musculoskeletal disorders (MSDs) (da Costa and Vieira Citation2010), partly attributed to fatigue (Sedighi and Nussbaum Citation2017). Fatigue can be defined as a reduction in muscular capability, which can negatively impact task performance (Srinivasan and Mathiassen Citation2012) and increase the perception of task difficulty (Enoka and Stuart Citation1992), leading to possible MSD development. Some individuals may be more susceptible to MSDs caused by repetitive tasks than others due to differences in motor variability (Mathiassen, Möller, and Forsman Citation2003). Research has shown that some individuals may adapt their movement to maintain task performance when fatigue accumulates, increasing their motor variability to slow fatigue development (Fuller, Fung, and Côté Citation2011), while individuals exhibiting pain are less likely to increase movement variability (Sedighi and Nussbaum Citation2019), but may systematically adapt altered patterns due to fatigue. Identifying when an individual begins to fatigue during repetitive lifting through changes in movement kinematics may assist in developing counteractive measures for reducing MSDs, such as job modifications (da Costa and Vieira Citation2010). Detecting fatigue is also critical for clinical applications, such as functional capacity evaluations (FCE) (Allison et al. Citation2018), where subjective visual appraisal of biomechanics is the primary method used to estimate capacity in return-to-work assessments (Sinden et al. Citation2017).
Several reasons may underpin why an individual might alter or adapt their movement patterns during repetitive lifting, but fatigue is likely a primary cause. Previous literature indicates that fatigue-related kinematic changes do indeed occur during repetitive lifting (Bonato et al. Citation2003; Fischer et al. Citation2015; Mehta, Lavender, and Jagacinski Citation2014; Sparto et al. Citation1997); however, the reported kinematic changes that occur are inconsistent between studies, providing evidence of subject-specific responses. Measuring group-level kinematic changes that occur during a repetitive lifting protocol may not be as meaningful as detecting subject-specific changes (Banks and Aghazadeh Citation2009). Development and use of an objective subject-specific method may aid in identifying lifting fatigue in the workplace or during clinical functional assessments (i.e. an FCE).
Various approaches have been explored for detecting subject-specific movement pattern changes, but without a focus on lifting. For example, Kobsar and Ferber (Citation2018) investigated gait changes following a clinical intervention for knee osteoarthritis patients. Subject-specific one-class support vector machines (OCSVM) were trained to objectively classify within-individual changes in gait based on deviations from their normal range of gait behaviour. The OCSVM algorithm operates by enclosing data from an arbitrary distribution that describes a particular individual within a defined boundary and then identifying any later supplied data as outliers if those data fall outside the boundary. The novelty of Kobsar and Ferber’s (Citation2018) work was the use of OCSVM models at a subject-specific level, to define a decision boundary for ‘normal’ movement by using biomechanical data from baseline or initial trials (i.e. training data) and then classifying new data (i.e. test data) against that decision boundary, serving as an outlier detection algorithm. The subject-specific OCSVM approach may also be useful for objectively classifying adaptations away from baseline movement patterns due to factors, such as work-related fatigue during lifting, motivating the objective of this study.
Exploring the use of subject-specific, objective machine learning tools, such as OCSVMs, is a logical direction to strengthen the identification of workplace fatigue and decision-making in FCEs. Therefore, the purpose of this study was to determine if subject-specific OCSVM models could objectively detect changes in whole-body kinematics during a repetitive floor-to-shoulder lifting protocol and then to determine if those changes were associated with self-reported ratings of perceived exertion (RPE). To address our purpose, we answer the question: is the percentage of outlier lifts calculated from an OCSVM machine learning model correlated with increases in RPE during a single-session repetitive lifting task in healthy adults? In the context of this study, an outlier lift was defined as a lift that was completed with a different kinematic profile than those defined by the OCSVM model. We hypothesised that a significant strong positive correlation would exist between the percentage of outlier lifts classified by the OCSVM, and the RPE of participants who demonstrated evidence of self-reported fatigue during a 60-min repetitive lifting task, and no significant correlation would exist for participants who did not demonstrate evidence of self-reported fatigue.
2. Methods
2.1. Participants
A convenience sample of 14 healthy participants (seven female; age 23.7 ± 4.0 years, height 1.70 ± 0.12 m, weight 64.6 ± 10.7 kg) participated in this study. Participants were excluded if they had acute and/or chronic pain that interfered with prolonged lifting in the previous seven days, determined using the Nordic Musculoskeletal Disorder Questionnaire (Kuorinka et al. Citation1987). This study was reviewed and approved by the University Research Ethics Board. Informed consent was provided by each participant before participating in the study.
2.2. Instrumentation
A 12-camera (6 Vero v2.2, 6 Vantage V5) Vicon motion capture system (Vicon, Oxford, UK) was used to track 3 D kinematics of participants at 100 Hz. A whole-body marker set was used, with 52 individual markers to define anatomical locations (22 of which were removed following calibration) and 42 markers on rigid plastic clusters used to track the upper arms, forearms, thighs, shanks, trunk, and pelvis. All markers were attached to participants with double-sided tape, and Velcro straps were used to secure rigid clusters. The three boxes used for lifting had four reflective markers attached to them each so their trajectories could be tracked.
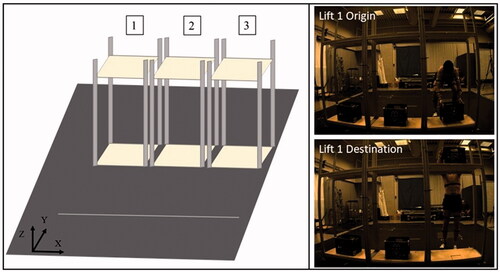
2.3. Lifting protocol
Collection sessions began by obtaining informed consent. Participants were asked to perform as many symmetrical two-handed lifts from floor-to-shoulder height as possible until volitional fatigue (participants’ expressed inability to continue), or until a maximum of 60 min was reached. Participants were instructed to self-select their pace such that they should be able to maintain the task for the full 60-min. The shoulder-height shelf was height-matched for each participant so that when they held the box straight out in front of them with their arms parallel to the floor, the box was resting on the shelf. Participants started each lift cycle behind a line positioned 3 m away from three adjacent shelves and boxes. Each box (standard milk crate) contained weight of ∼30% of their maximum lifting capacity as determined using Matheson’s EPIC Lifting Capacity test (Matheson et al. Citation1995), conducted 7–14 days before performing the repetitive lifting task. Participants completed trials that consisted of three consecutive lifts using a natural self-selected lifting strategy comfortable to them (). Motion capture records were initiated as soon as the participant began to move over the start line to repeat the next 3-lift trial. After completion of each 3-lift trial, participants walked back to the start line, paused while the researcher triggered the next motion capture recording, then continued at their self-selected pace. After five 3-lift trials (15 lifts), participants stopped for 30 s to give their RPE using Borg’s 6–20 scale (Borg Citation1982), and participants were asked if they were able to continue the protocol. If they answered no, the protocol was stopped due to volitional fatigue.
Figure 1. Schematic (left pane) and performance (right pane) of the repetitive lifting protocol. Three symmetrical two-handed floor-to-shoulder height lifts were completed consecutively per trial. After the three lifts in a trial, participants walked back to the starting line (white line on the schematic) before starting the next trial.
2.4. Data processing and analysis
All marker trajectory data were labelled then gap filled consistent with best practice guidelines (Howarth and Callaghan Citation2010) using Vicon Nexus (v2.6, Vicon, Oxford, UK). Data were then exported into Visual3D (v6.01.03, C-Motion, Germantown, MD, USA) and filtered through a zero-lag (dual-pass), low-pass second-order Butterworth filter with an effective cut-off frequency of 6 Hz (Winter Citation2009). A rigid-link whole-body kinematic model was created for each participant using the anatomical landmark position data from a collected static trial to define segments using ISB recommended segment definitions (Wu et al. Citation2002; Wu et al. Citation2005). Visual3D defaults for segment anthropometrics and inertial properties, based on participant mass, were used to define segments and calculate segment centres of gravity, based on Hanavan’s (Citation1964) equations. Inverse kinematic constraints were used to allow only physiological segment motion within the models. The head, pelvis, and trunk centres of gravity, and the bilateral ankle, knee, hip, wrist, elbow, and shoulder joint centres were calculated for every frame of each lift to represent whole-body motion. These joint centres and segment centres of gravity were chosen to be consistent with past literature utilising principal component analysis (PCA) to detect and reduce features of whole-body movement (Armstrong et al. Citation2021; Ross et al. Citation2018; Troje Citation2002). The time-series trajectory data for these 15 anatomical locations from each individual lift were exported into Python (v3.8) for further data processing and analysis. Trajectory data for each lift were time-normalised to 101 frames then re-expressed in the local pelvis body-specific coordinate system to remove trial-to-trial variations in global positioning (i.e. at the three different shelves). Following conditioning, each lift was reshaped into a 1 × 4545 row vector containing the 45 time-series trajectory data points (15 anatomical locations × 3 axes) for each frame (101 time points).
Data were separated into training and test sets to address the research question. The approach to separating data into training and test sets required an attempt to balance between ensuring that the training sets included a sufficient number of trials to create robust boundaries when using the OCSVM, but also not including so many trials in the training set that those data were confounded with fatigued movements. As a result, training sets were confined to the first 35% of the total number of lifts completed by each participant, respectively. Previous literature has shown progressive fatigue effects occur over prolonged bouts of lifting, even after 30 min of consecutive lifting (Banks and Aghazadeh Citation2009; Potvin and Norman Citation1993). Since individual lifts could not be defined as fatigued or non-fatigued in this study, a separation point of 35% (about 20 min of lifting) was chosen to balance between providing enough lifts to describe the baseline lifting movement patterns and natural variability for each participant, while also minimising the inclusion of lifts that may have been contaminated by early fatigue effects. The remaining 65% of the lifts were then separated into distinct test sets. Test sets were sectioned to correspond to the 15 lifts completed immediately before an RPE measurement.
2.4.1. Evidence of participant fatigue
The rate and magnitude of fatigue response are likely subject-specific, so participants were therefore classified as either likely fatigued or unlikely fatigued to aid in analysis. If a participant did not finish the full 60-min protocol due to volitional fatigue, they were classified as likely fatigued. If a participant completed the 60-min protocol and had a difference of two or greater between their median RPE from the training set (first 35% of lifts) and median RPE from the test sets (last 65% of lifts), they were classified as likely fatigued. However, if a participant finished the 60-min protocol but did not have a difference of two or greater, they were classified as unlikely fatigued. Since the RPE scale is categorical (i.e. the distance between categories is unknown), a change in RPE of two or more meant that lifters were required to demonstrate a change of at least two categories (e.g. from ‘fairly light’ or 11 to ‘somewhat hard’ or 13) to be included in the likely fatigued category. The median was chosen as the measure of central tendency because RPE is typically given as whole numbers (in this case, 6–20), where the use of the mean would result in less meaningful decimal places, suggesting that the scale is a ratio, and not categorical as noted above. Recognising that RPE is a surrogate measure of fatigue, more direct measures, such as EMG or maximum voluntary exertions were omitted to reduce the potential effect of added body-worn sensors on natural lifting kinematics and limit the already high time burden on volunteering participants.
2.4.2. Principal component analysis
PCA was used as feature extraction and data reduction method to identify a subset of features that could be used to describe the movement pattern for each lift (Daffertshofer et al. Citation2004). A 95% trace criterion was used, where principal components (PCs) were retained until the cumulative variance explained reached 95% of the overall variance in the data (Armstrong et al. Citation2021, Brandon et al. Citation2013; Kobsar and Ferber Citation2018; Sadler, Graham, and Stevenson Citation2011). PCA was only applied on the training set of lifts for each participant separately. Each retained PC explained an independent source of variability in the marker trajectories from the training set (Armstrong et al. Citation2021). A p × q matrix was produced from the raw trajectory data, where p was the number of training lifts for a participant (first 35% of their completed lifts), and q represented the 4545-length row vector describing the motion for each individual lift. PCA was conducted on the p × q matrix to generate PCs, where the PC scores were used as features to define participants’ baseline lifting patterns. The trajectory data from each test set were then projected onto the training set PC feature space to generate corresponding PC scores for each test set lift. Training set PC scores were standardised to a mean of zero and a standard deviation of one to ensure equal weighting of features on the OCSVM model (Halilaj et al. Citation2018). The test set PC scores were then standardised using the training set mean and standard deviation to ensure the test set PC scores were aligned with the training set PC scores distribution (Kobsar and Ferber Citation2018).
2.4.3. OCSVM classification
Training set PC scores were used as inputs into an OCSVM to train a decision boundary representative of initial lifting motions using a Gaussian kernel function. The OCSVM tool from the scikit-learn (v0.23.2) library in Python was used (Pedregosa et al. Citation2011). The OCSVM had two hyperparameters that influenced how the decision boundary was trained. Gamma is a hyperparameter of the Gaussian kernel, controlling the influence of individual training examples (gamma > 0). Conceptually, gamma changes the ‘smoothness’ of the model, where a greater gamma creates a tighter fitted, complex boundary, and a lower value creates a broader, more generalisable boundary. The library default value, ‘scale’, was used for each model (EquationEquation 1(1)
(1) ) and confirmed as appropriate via a post-hoc sensitivity analysis (Appendix A).
(1)
(1)
where matrix X refers to the matrix of training set PC scores that defined each participant’s movement pattern. Since these matrices were standardised to standard deviation of one, the variance was equal to one.
The other hyperparameter, nu (0 < nu < 1), defines the upper bound on the fraction of training errors and the lower bound on the fraction of support vectors. Conceptually, nu represents the proportion of outliers that the model may allow based on the training data. For this study, nu was set to 0.01, where the model tries to limit outliers to 1% of the training data lifts. Allowing some outliers from the training data tends to improve overall performance as the OCSVM algorithm will otherwise attempt to compute a tight envelope that is more irregular in shape to capture the boundary perturbations caused by the most extreme points. The use of the selected nu value was confirmed as appropriate via a post-hoc sensitivity analysis (Appendix A).
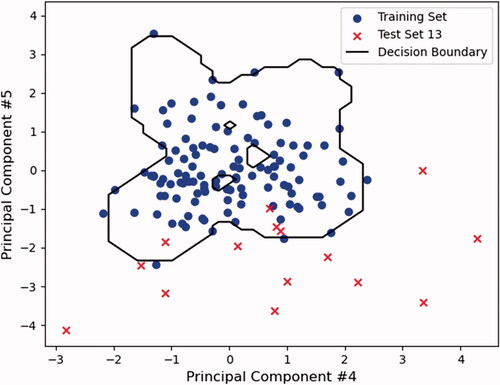
The PC scores from the training set were then used to fit an OCSVM decision boundary to the data (). The test set PC scores were then classified against the decision boundary. The percentage of outlier lifts was calculated for the training set and each test set using EquationEquation (2)(2)
(2) .
(2)
(2)
Figure 2. A simplified example of a two-dimensional decision boundary (black line) is defined by the training set data (blue circles), where only two PCs were used to train the decision boundary. In the example test set shown, 73.3% of the test lifts (red x’s) would be classified as outliers due to falling outside of the decision boundary.
2.5. Statistical analysis
To test the hypothesis, Spearman’s rank-order correlation (ρ), a non-parametric test, was used to assess the association between the test set percentage of outlier lifts and RPE. Spearman’s rank-order correlations were applied to each individual participant using the spearmanr function from the SciPy library (v1.6.0) in Python. Spearman rank-order correlations (ρ) of 0.10–0.29, 0.30–0.49, and 0.5+ were interpreted as small, medium, and large, respectively (Cohen Citation1988). Significance for the Spearman correlation was determined as p < 0.05.
3. Results
3.1. Fatigue likeliness classification
Participants completed an average of 444 ± 103 lifts during the lifting protocol. Three participants were classified as likely fatigued due to volitional fatigue and seven participants were classified as likely fatigued due to having a difference in median training and test sets RPE of two or greater (). Four participants were classified as unlikely fatigued due to not having a difference in median training and test sets RPE of two or greater.
Table 1. Descriptive statistics for each participant’s RPE measurements from the training and test sets, their total number of lifts completed, time spent completing the protocol, and their likeliness of fatigue classification.
3.2. OCSVM training and test sets lift classification
The average number of PCs retained to explain 95% of the total variance in the training set lifts for each participant was 20.4 ± 8.8. An average of 16.0 ± 2.9% of training lifts were classified as outliers from the training set decision boundary (). Although the observed average percentage of training set outliers is in contradiction to the hyperparameter nu being set to 0.01, the results are stable using nu values up to 0.21 (Appendix A). The observed average percentage of training set outliers of 16% is related to the complexity of data around the decision boundary.
Table 2. Training set and test set OCSVM classification results.
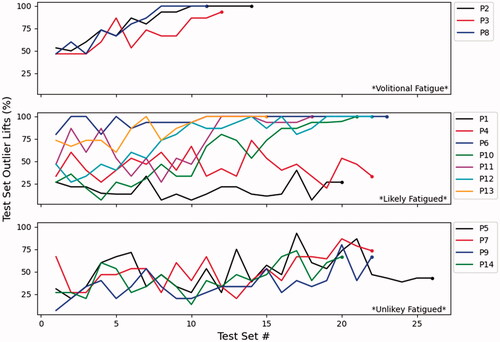
Seven of the ten likely fatigued participants had a greater median test set percentage of outlier lifts than the unlikely fatigued participants (). Eight of the ten likely fatigued participants finished the protocol with a greater percentage of outlier lifts in their final test sets than those who were unlikely fatigued ().
Figure 3. Percentage of outlier lifts for each test set. Moving right along the test set number indicates an increase in time during the protocol. Participants are separated into subplots based on fatigue likeliness classification.
3.3. Association between RPE and percentage of outlier lifts
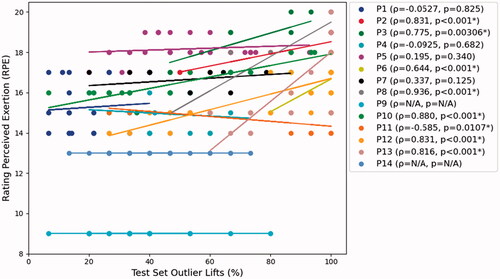
Seven of the ten participants who were likely fatigued had a significant large positive association between RPE and the percentage of test set outlier lifts, while one participant had a significant large negative association (). All four participants that were unlikely fatigued had no significant association.
Figure 4. Percentage of the test set outliers lifts and the associated RPE score. Each dot represents one test set. Participants are separated by colour. Some data points are not visible due to overlapping values across participants. The Spearman rho (ρ) and p-values results of the Spearman rank-order correlation are shown in the legend. Asterisks in the legend denote participants with a significant association between the percentage of test set outlier lifts and RPE (p < 0.05). Lines of best fit do not represent the Spearman rank-order correlation. P9 and P14 gave consistent RPE ratings through the entire protocol so a correlation could not be calculated.
4. Discussion
The objective of this study was to investigate the use of OCSVM as an outlier detection tool for identifying fatigue-related changes in whole-body kinematics over the course of a 60-min repetitive lifting protocol. Significant positive associations were observed between RPE and the percentage of test set outlier lifts in seven of ten participants with demonstrated evidence of self-reported fatigue, supporting the hypothesis. No significant associations between the percentage of outlier lifts and RPE were observed in participants who did not demonstrate evidence of self-reported fatigue, also providing support for the hypothesis. The OCSVM models were able to objectively identify when participants were adapting their movement pattern away from their baseline lifting pattern, and the results support that these adaptations coincided with increased self-reported fatigue. Our findings provide evidence regarding the efficacy of an objective, subject-specific OCSVM model-based approach to detect fatigue-related changes in lifting kinematics during a prolonged, repetitive lifting protocol. This approach could potentially be used for objective identification of fatigue in workplace settings and to evaluate work tolerance in functional tests.
The preponderance of subject-specific responses to a fatiguing lifting protocol is consistent with past research. Bonato et al. (Citation2002) demonstrated that participants with demonstrated evidence of fatigue during a repetitive lifting protocol, measured as a significant decrease in instantaneous median frequency in their electromyography signal of select back muscles, also had significant changes in their knee and elbow ranges of motion during the lifting protocol (Bonato et al. Citation2002). Participants who did not demonstrate evidence of fatigue, concurrently, did not have significant changes in their lifting kinematics. This is an important comparison to highlight because the subjective self-reported RPE demonstrated similar findings to a more direct indicator of muscle fatigue (EMG signal) (Bonato et al. Citation2002). The results of Bonato et al. (Citation2002) also reinforce why a weaker relationship between fatigue and lifting outliers was observed in the current study among the not likely fatigued group, relative to those who were likely fatigued.
Among participants who were unlikely to be fatigued, some still exhibited an increase in their percentage of outlier lifts during the test sets. For example, P9 exhibited an increase in outlier lifts, even though they reported a consistent RPE rating of 9 throughout the entire protocol, suggesting they were not fatigued. These results might be explained by considering the repeater/replacer movement-variability hypothesis (Srinivasan and Mathiassen Citation2012). It is hypothesised that some individuals adapt their movement strategies to avoid fatigue during prolonged work tasks (Banks and Aghazadeh Citation2009). Increasing movement variability may help to limit fatigue development or relieve loading on tissues that may be fatiguing during repetitive movements (Srinivasan and Mathiassen Citation2012). Therefore, individuals, such as P9 may be known as a ‘replacer’, who exploit the flexibility of the motor system to use more variable movement during repetitive tasks (Srinivasan and Mathiassen Citation2012). This hypothesis may also explain why some participants had a high percentage of test set outliers in their first test sets after the training set of lifts (). A participant may have used one specific movement pattern in their beginning lifts, captured as inliers by the decision boundary, then switched to a different pattern to avoid fatigue. The new pattern may have been varied enough to be considered an outlier throughout the rest of the protocol. Since some individuals seem to adapt movement as a result of fatigue, but others may adapt movement to avoid fatigue, future research should explore these forms of adaptation in more detail. For example, to improve the ability of OCSVM as a fatigue detection tool, it might be useful to only consider features (i.e. PCs) that are independently associated with an increase in fatigue, rather than considering all features where changes may not be directly dependent on fatigue. Also, future research should examine the relationship between fatigue-induced variability and naturally-occurring variability in dynamic tasks like lifting to better understand and differentiate between the two.
To improve the use of OCSVM as a fatigue detection tool, it might be useful to only consider features (i.e. PCs) that are independently associated with an increase in fatigue, rather than considering all features where some may not be directly related to fatigue. In a post-hoc analysis, the mean of a PC score over time was calculated for each interval of 15 lifts, and the correlation of the mean PC score with RPE was assessed. The PC scores that were significantly associated with fatigue were then further analysed using single component reconstruction (Brandon et al. Citation2013) and a visual interpretation of the reconstructed feature of movement (method described in Armstrong et al. Citation2021). The characteristics of movement that changed through the protocol as fatigue increased could then be examined. In the post-hoc analysis, various adaptations to fatigue were found across participants, with some participants sharing similar characteristics. For example, adaptations included both an increased and decreased base of support width, torso rotation range, and knee flexion angles. Also, a participant that was classified as unlikely fatigued changed which direction they rotated their torso as they completed the lifting protocol. In line with the repeater/replacer movement-variability hypothesis (Srinivasan and Mathiassen Citation2012), this participant may have changed their movement pattern to limit fatigue development. Identifying the features of movement directly associated with increased fatigue allows for a direct interpretation of how an individual is adapting their movement.
This study demonstrates how whole-body motion capture data can be used to objectively identify when an individual is adapting their movement pattern, likely as a result of fatigue. However, laboratory-grade motion capture systems are not available for use in day-to-day clinical applications, like the administration of FCE, to make gold-standard tracking of whole-body kinematics possible. Therefore, alternative approaches should be considered for future work. Similar to other applications of subject-specific approaches to detecting changes in movement (Clermont et al. Citation2019; Conforti et al. Citation2020; Kobsar and Ferber Citation2018), IMUs are a potential wearable sensor alternative to track kinematic variables. IMUs are affordable, easy-to-use sensors that could be used in conjunction with real-time monitoring systems to get quick feedback and measurements that even have the potential to utilise machine learning algorithms (Graham and Josan Citation2017). An additional potential approach to collecting whole-body kinematic data is using marker-less motion capture and convolutional pose estimation (Cao et al. Citation2021; Wei et al. Citation2016). Real-time motion data could be captured and analysed (Van Den Bogert et al. Citation2013) in conjunction with an outlier detection algorithm to provide quick information for more objective fatigue identification. Another future direction is to assess the utility of the OCSVM approach in a workplace or clinical setting, where completion of dynamic repetitive tasks may involve more variability than would be seen in a laboratory setting.
Limitations related to the participant sample, measure of fatigue, and application of OCSVM should be considered in this study to inform future research. A small sample size recruited from the local university population was used. This may limit the generalisability of the results towards a working population but provides proof of concept that OCSVM may be useful for fatigue detection. As a consequence of recruiting non-MMH participants, we increased the potential that there may have been a learning effect period at the start of the protocol. However, to mitigate that effect, and as part of a broader research question, the participants had already completed a bout of lifting, followed by at least 15 min of rest to mitigate potential fatigue before engaging in the prolonged lifting bout that we report on here. Despite the 15-min rest, it is possible that the prior manual material handling affected their starting RPE level, which explains why many participants may have indicated RPEs consistent with a ‘hard’ or ‘somewhat hard’ rating during the training set lifts.
The use of RPE as a fatigue measure limited the utility of the Spearman rho to measure associations in two participants. The use of a more objective fatigue measure, such as maximal isometric strength tests (Banks and Aghazadeh Citation2009; Fischer et al. Citation2015; Potvin and Norman Citation1993), may have improved the utility of Spearman rho to assess the associations between fatigue and lifting movement outliers. Exploring the utility of OCSVM for fatigue detection, while using a more direct measure of fatigue provides a logical next step.
Feature reduction was a necessary first step before developing the OCSVM model. The use of PCA as a data reduction and feature extraction method, as applied, distorted the time domain of the lifts since each lift was normalised to 101 frames. The OCSVM model could therefore not differentiate lifts based on any absolute time-related kinematic measures. For example, the time to complete a lift has been shown to both increase (Fischer et al. Citation2015) and decrease (Mehta, Lavender, and Jagacinski Citation2014) over the duration of a repetitive lifting protocol.
Moving forward, these data support that OCSVM may have the potential for fatigue detection during lifting, but we acknowledge that our investigation was conducted under ideal conditions. For example, we constrained the OCSVM to lifts with specific origin and destination locations, where workers might lift between several different origin and destination locations during a workday. If there is variability in the start or end points of the movement, the OCSVM may detect these as outliers that may not be related to fatigue. Also, the outlier detection tool does not specifically identify what aspect of movement has changed as a function of fatigue. Deeper level analysis, such as single component reconstruction (Brandon et al. Citation2013) could identify individual kinematic factors that are associated with fatigue.
5. Conclusion
The use of OCSVM successfully identified subject-specific fatigue-related changes in repetitive lifting kinematics from baseline that were significantly associated with self-reported fatigue in participants that were likely fatigued, but not in participants who were unlikely fatigued. However, the OCSVM models were also able to detect changes in some participants’ movement patterns relative to baseline, even though they may not have been fatigued. Therefore, future efforts should aim to identify a sub-set of movement features that might best capture fatigue-specific changes, opposed to training an OCSVM model containing features that may be related to other sources of movement variability that may exist over a prolonged bout of lifting. Overall, the current method shows promise to support increased data-driven approaches in workplace fatigue detection to decrease MSD risk and to support improved return-to-work decision-making in clinical assessments.
| Abbreviations | ||
| MSD | = | musculoskeletal disorder |
| FCE | = | functional capacity evaluation |
| OCSVM | = | one-class support vector machine |
| RPE | = | rating of perceived exertion |
| PCA | = | principal component analysis |
| PC | = | principal component |
| EMG | = | electromyography |
| MMH | = | manual materials handling |
Disclosure statement
The authors of this paper declare there are no conflicts of interest.
Additional information
Funding
References
- Allison, S., J. Galper, D. Hoyle, and J. Mecham. 2018. Current concepts in functional capacity evaluation: a best practices guideline. https://www.orthopt.org/uploads/content_files/files/2018%20Current%20Concepts%20in%20OH%20PT-FCE%2006-20-18%20FINAL.pdf
- Armstrong, D. P., A. R. Budarick, C. E. Pegg, R. B. Graham, and S. L. Fischer. 2021. “Feature Detection and Biomechanical Analysis to Objectively Identify High Exposure Movement Strategies When Performing the EPIC Lift Capacity Test.” Journal of Occupational Rehabilitation 31 (1): 50–62. doi:10.1007/s10926-020-09890-2.
- Banks, A. D, and F. Aghazadeh. 2009. “Progressive Fatigue Effects on Manual Lifting Factors.” Human Factors and Ergonomics in Manufacturing 19 (5): 361–377. doi:10.1002/hfm.20170.
- Bonato, P., P. Boissy, U. Della Croce, and S. H. Roy. 2002. “Changes in the Surface EMG Signal and the Biomechanics of Motion during a Repetitive Lifting Task.” IEEE Transactions on Neural Systems and Rehabilitation Engineering 10 (1): 38–47. doi:10.1109/TNSRE.2002.1021585.
- Bonato, P., G. R. Ebenbichler, S. H. Roy, S. Lehr, M. Posch, J. Kollmitzer, and U. Della Croce. 2003. “Muscle Fatigue and Fatigue-Related Biomechanical Changes during a Cyclic Lifting Task.” Spine 28 (16): 1810–1820.
- Borg, G. 1982. “Psychophysical Bases of Perceived Exertion.” Medicine and Science in Sports and Exercise 14 (5): 377–381.
- Brandon, S. C., R. B. Graham, S. Almosnino, E. M. Sadler, J. M. Stevenson, and K. J. Deluzio. 2013. “Interpreting Principal Components in Biomechanics: Representative Extremes and Single Component Reconstruction.” Journal of Electromyography and Kinesiology 23 (6): 1304–1310. doi:10.1016/j.jelekin.2013.09.010.
- Cao, Z., G. Hidalgo, T. Simon, S. E. Wei, and Y. Sheikh. 2021. “OpenPose: Realtime Multi-Person 2D Pose Estimation Using Part Affinity Fields.” IEEE Transactions on Pattern Analysis and Machine Intelligence 43 (1): 172–186. doi:10.1109/TPAMI.2019.2929257.
- Clermont, C. A., L. C. Benson, W. B. Edwards, B. A. Hettinga, and R. Ferber. 2019. “New Considerations for Wearable Technology Data: Changes in Running Biomechanics during a Marathon.” Journal of Applied Biomechanics 35 (6): 401–409–409. doi:10.1123/jab.2018-0453.
- Cohen, J. 1988. Statistical Power Analysis for the Behavioral Sciences. 2nd ed. Lawrence Erlbaum.
- Conforti, I., I. Mileti, Z. Del Prete, and E. Palermo. 2020. “Measuring Biomechanical Risk in Lifting Load Tasks through Wearable System and Machine-Learning Approach.” Sensors 20 (6): 1557. doi:10.3390/s20061557.
- da Costa, B. R, and E. R. Vieira. 2010. “Risk Factors for Work-Related Musculoskeletal Disorders: A Systematic Review of Recent Longitudinal Studies.” American Journal of Industrial Medicine 53 (3): 285–323. doi:10.1002/ajim.20750.
- Daffertshofer, A., C. J. Lamoth, O. G. Meijer, and P. J. Beek. 2004. “PCA in Studying Coordination and Variability: A Tutorial.” Clinical Biomechanics 19 (4): 415–428. doi:10.1016/j.clinbiomech.2004.01.005.
- Enoka, R. M, and D. G. Stuart. 1992. “Neurobiology of Muscle Fatigue.” Journal of Applied Physiology 72 (5): 1631–1648. doi:10.1152/jappl.1992.72.5.1631.
- Fischer, S. L., H. P. Greene, R. H. Hampton, M. G. Cochran, and W. J. Albert. 2015. “Gender-Based Differences in Trunk and Shoulder Biomechanical Changes Caused by Prolonged Repetitive Symmetrical Lifting.” IIE Transactions on Occupational Ergonomics and Human Factors 3 (3–4): 165–176. doi:10.1080/21577323.2015.1034382.
- Fuller, J. R., J. Fung, and J. N. Côté. 2011. “ Time-Dependent Adaptations to Posture and Movement Characteristics during the Development of Repetitive Reaching Induced Fatigue.” Experimental Brain Research 211 (1): 133–143. doi:10.1007/s00221-011-2661-8.
- Graham, R. B, and G. P. Josan. 2017. “Development of a Novel Wearable System for the Clinical Assessment of Movement Quality and Control in Low Back Pain.” In Proceedings of the XXVI Congress of the International Society of Biomechanics, Brisbane, Australia, 407.
- Halilaj, E., A. Rajagopal, M. Fiterau, J. L. Hicks, T. J. Hastie, and S. L. Delp. 2018. “Machine Learning in Human Movement Biomechanics: Best Practices, Common Pitfalls, and New Opportunities.” Journal of Biomechanics 81: 1–11. doi:10.1016/j.jbiomech.2018.09.009.
- Hanavan, E. P. Jr. 1964. A Mathematical Model of the Human Body (No. AFIT-GA-PHYS-64-3). Wright-Patterson AFB, OH: Air Force Aerospace Medical Research Lab.
- Howarth, S. J., and J. P. Callaghan. 2010. “Quantitative Assessment of the Accuracy for Three Interpolation Techniques in Kinematic Analysis of Human Movement.” Computer Methods in Biomechanics and Biomedical Engineering 13 (6): 847–855. doi:10.1080/10255841003664701.
- Kobsar, D, and R. Ferber. 2018. “Wearable Sensor Data to Track Subject-Specific Movement Patterns Related to Clinical Outcomes Using a Machine Learning Approach.” Sensors 18 (9): 2828. doi:10.3390/s18092828.
- Kuorinka, I., B. Jonsson, A. Kilbom, H. Vinterberg, F. Biering-Sørensen, G. Andersson, and K. Jørgensen. 1987. “Standardised Nordic Questionnaires for the Analysis of Musculoskeletal Symptoms.” Applied Ergonomics 18 (3): 233–237. doi:10.1016/0003-6870(87)90010-X.
- Matheson, L. N., V. Mooney, J. E. Grant, M. Affleck, H. Hall, T. Melles, R. L. Lichter, and G. McIntosh. 1995. “A Test to Measure Lift Capacity of Physically Impaired Adults: Part 1-Development and Reliability Testing.” Spine 20 (19): 2119–2129.
- Mathiassen, S. E., T. Möller, and M. Forsman. 2003. “Variability in Mechanical Exposure within and between Individuals Performing a Highly Constrained Industrial Work Task.” Ergonomics 46 (8): 800–824. doi:10.1080/0014013031000090125.
- Mehta, J. P., S. A. Lavender, and R. J. Jagacinski. 2014. “Physiological and Biomechanical Responses to a Prolonged Repetitive Asymmetric Lifting Activity.” Ergonomics 57 (4): 575–588. doi:10.1080/00140139.2014.887788.
- Pedregosa, F., G. Varoquaux, A. Gramfort, V. Michel, B. Thirion, O. Grisel, P. Prettenhofer, R. Weiss, V. Dubourg, J. Vanderplas, A. Passos, D. Cournapeau, M. Brucher, M. Perrot, and E. Duchesnay. 2011. “Scikit-Learn: Machine Learning in Python.” Journal of Machine Learning Research 12: 2852–2830.
- Potvin, J. R, and R. W. Norman. 1993. “Quantification of Erector Spinae Muscle Fatigue during Prolonged, Dynamic Lifting Tasks.” European Journal of Applied Physiology and Occupational Physiology 67 (6): 554–562. doi:10.1007/BF00241654.
- Ross, G. B., B. Dowling, N. F. Troje, S. L. Fischer, and R. B. Graham. 2018. “Objectively Differentiating Movement Patterns between Elite and Novice Athletes.” Medicine and Science in Sports and Exercise 50 (7): 1457–1464. doi:10.1249/MSS.0000000000001571.
- Sadler, E. M., R. B. Graham, and J. M. Stevenson. 2011. “The Personal Lift-Assist Device and Lifting Technique: A Principal Component Analysis.” Ergonomics 54 (4): 392–402. doi:10.1080/00140139.2011.556259.
- Sedighi, A, and M. A. Nussbaum. 2017. “Temporal Changes in Motor Variability during Prolonged Lifting/Lowering and the Influence of Work Experience.” Journal of Electromyography and Kinesiology 37: 61–67. doi:10.1016/j.jelekin.2017.09.001.
- Sedighi, A, and M. A. Nussbaum. 2019. “Exploration of Different Classes of Metrics to Characterize Motor Variability during Repetitive Symmetric and Asymmetric Lifting Tasks.” Scientific Reports 9 (1): 9821. doi:10.1038/s41598-019-46297-3.
- Sinden, K. E., T. L. McGillivary, E. Chapman, and S. L. Fischer. 2017. “Survey of Kinesiologists' Functional Capacity Evaluation Practice in Canada.” Work 56 (4): 571–580. doi:10.3233/WOR-172519.
- Sparto, P. J., M. Parnianpour, T. E. Reinsel, and S. Simon. 1997. “The Effect of Fatigue on Multijoint Kinematics, Coordination, and Postural Stability during a Repetitive Lifting Test.” The Journal of Orthopaedic and Sports Physical Therapy 25 (1): 3–12. doi:10.2519/jospt.1997.25.1.3.
- Srinivasan, D, and S. E. Mathiassen. 2012. “Motor Variability in Occupational Health and Performance.” Clinical Biomechanics 27 (10): 979–993. doi:10.1016/j.clinbiomech.2012.08.007.
- Troje, N. 2002. “Decomposing Biological Motion: A Framework for Analysis and Synthesis of Human Gait Patterns.” Journal of Vision 2 (5): 371–378. doi:10.1167/2.5.2.
- Van Den Bogert, A. J., T. Geijtenbeek, O. Even-Zohar, F. Steenbrink, and E. C. Hardin. 2013. “A Real-Time System for Biomechanical Analysis of Human Movement and Muscle Function.” Medical & Biological Engineering & Computing 51 (10): 1069–1077. doi:10.1007/s11517-013-1076-z.
- Wei, S. E., V. Ramakrishna, T. Kanade, and Y. Sheikh. 2016. “Convolutional Pose Machines.” In Proceedings of the IEEE Conference on Computer Vision and Pattern Recognition, 4724–4732.
- Winter, D. A. 2009. Biomechanics and Motor Control of Human Movement. 4th ed. John Wiley & Sons, Inc.
- Wu, G., S. Siegler, P. Allard, C. Kirtley, A. Leardini, D. Rosenbaum, M. Whittle, D. D. D’Lima, L. Cristofolini, H. Witte, O. Schmid, and I. Stokes. 2002. “ISB Recommendation on Definitions of Joint Coordinate System of Various Joints for the Reporting of Human Joint Motion—Part I: Ankle, Hip, and Spine.” Journal of Biomechanics 35 (4): 543–548. doi:10.1016/S0021-9290(01)00222-6.
- Wu, G., F. C. van der Helm, H. E. Veeger, M. Makhsous, P. Van Roy, C. Anglin, J. Nagels, A. R. Karduna, K. McQuade, X. Wang, F. W. Werner, and B. Buchholz. 2005. “ISB Recommendation on Definitions of Joint Coordinate Systems of Various Joints for the Reporting of Human Joint motion-Part II: Shoulder, Elbow, Wrist and Hand.” Journal of Biomechanics 38 (5): 981–992. doi:10.1016/j.jbiomech.2004.05.042.
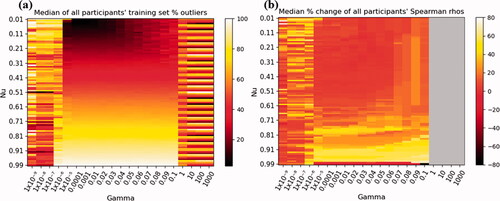
Appendix A
A.1 Hyperparameter sensitivity analysis methods
A post-hoc sensitivity analysis was conducted for the OCSVM hyperparameter values gamma and nu to evaluate their overall influence on the training set percentage of outliers and Spearman rank-order correlation outcomes. The assumption was that if sets of hyperparameter values other than the ones used (gamma = ‘scale’, nu = 0.01) resulted in similar outcomes, the observed relationship was robust and not overly sensitive to the specific hyperparameters used. In total, 2079 different sets of hyperparameter values were analysed using 21 gamma values (1 × 10⁻⁹–1000) and 99 nu values (0.01–0.99). The percentage of training set outlier lifts was calculated for each hyperparameter set (EquationEquation 2(2)
(2) ) to determine their influence on each participant’s decision boundary formation. A training set outlier percentage close to zero indicated an underfit model, too generalisable to detect outliers in the test sets, while a higher percentage indicated an overfit model that may be too sensitive to outliers. The median of the training set percentage of outlier lifts across participants was calculated for each set of hyperparameters. The second outcome measure, the Spearman rank-order correlation coefficient (ρ), was calculated from the percentage of outlier lifts in the test sets generated for each set of hyperparameters and the RPE of each participant exhibited in the test sets. The percentage change between the new Spearman rho and the original value was calculated (EquationEquation A.1
(1)
(1) ) for each set of hyperparameter values and each participant. The median percentage change of Spearman rho across participants was then calculated for each set of hyperparameter values.
(A.1)
(A.1)
where the original value refers to the Spearman rho calculated for a participant using the hyperparameter values in the study, and the new value refers to the Spearman rho calculated using the new set of hyperparameter values in the sensitivity analysis.
A.2 Hyperparameter sensitivity analysis results
The training set median percentage of outlier lifts across participants was 16% when the original hyperparameter values were used (gamma values ranged from 0.026 to 0.125). A similar median percentage was found in the sensitivity analysis using gamma values between 0.01 and 0.1, and nu values between 0.01 and 0.2 (). Increasing the nu value between gamma values of 1 × 10⁻⁵ and 0.1 led to a logical increase in training set outlier lifts. A lower nu value was, therefore, better for creating a decision boundary that limited the amount of training lift outliers. A lower percentage of training lift outliers signified that most of the movement patterns exhibited by participants in the training lifts were captured by the decision boundary to appropriately define their baseline lifting movement patterns. Considering Spearman rho results, 0% change indicated that the revised hyperparameter values lead to results that were similar to the actual results in the study (). Overall, results were not sensitive to small changes in hyperparameter values relative to those selected for this study.
Figure A1. Sensitivity analysis of different hyperparameter values on the resulting (a) median training set percentage outlier lifts and (b) median percentage change in Spearman rho across participants. Gammas increase at a power of 10 from left to right, with more added between 0.01 and 0.1 for higher resolution. A median near zero in (a) indicates a possibly underfit decision boundary, while a larger median (e.g. >30%) indicates a possibly overfit decision boundary. A median near 0% change in (a) indicates that the hyperparameter values did not change the Spearman rho correlation results. Gamma values ≥1 resulted in 100% lift outliers in every test set (indicative of an overfit model), so Spearman rank-order correlation could not be calculated for them (right side grey-out region in (b)).