
 ?Mathematical formulae have been encoded as MathML and are displayed in this HTML version using MathJax in order to improve their display. Uncheck the box to turn MathJax off. This feature requires Javascript. Click on a formula to zoom.
Abstract
The capability of current Ergonomics methods to capture dynamism is limited, stifling our understanding of work-as-done, distributed situational awareness and organisational drift. This paper provides a demonstration of concept of DynEAST; an extension of the EAST framework underpinned by principles from Dynamic Network Analysis, to capture elements of dynamism within work systems. The DynEAST concept is applied to a railway maintenance case study. Case study findings demonstrate how DynEAST outputs can be used to advance our understanding of the aforementioned phenomena and better equip practitioners for current and future Ergonomics challenges.
Practitioner summary: This paper introduces the DynEAST method. DynEAST enables HF/E practitioners to model and analyse dynamic features of complex work systems. The development of DynEAST is timely due to the concurrent proliferation of increasingly complex sociotechnical systems and stagnation of HF/E methods development; particularly those able to model systemic dynamism.
Abbreviations: DynEAST: dynamic event analysis of systemic teamwork; EAST: dynamic event analysis of systemic teamwork; HF/E: human factors and ergonomics; HF: human factors; DNA: dynamic network analysis; HTA: hierarchal task analysis; CWA: cognitive work analysis; CAST: causal analysis based on system theory; STAMP: system theoretic accident model and processes; FRAM: functional resonance analysis method; SNA: social network analysis; DSA: distributed situational awareness; PPO: possession protection officer; PO: protection officer; RTS: railway track signals; LPA: local possession authority; SMEs: subject matter experts
Introduction
The high value problems ergonomists should be resolving are systems based (Dul et al. Citation2012). A critical component of these problems is their dynamism (Walker et al. Citation2017). Current ergonomics methods have limited capability in dealing with this important feature, especially at scale (Salmon et al. Citation2017; Walker et al. Citation2017; Holman et al. 2020). Systems Ergonomics methods are typically driven by static inputs and produce static outputs (Dekker, Hancock, and Wilkin Citation2013; Thatcher, Nayak, and Waterson Citation2020). As a result, users of such methods are confronted by three problems:
The system snapshot problem. Systems change over time. Basing the analysis of a complex sociotechnical system on a set of static data inputs (e.g. observations, interviews, operating procedures etc.) can result in the generation of outputs that no longer represent the system in a meaningful way. Subsequent analyses performed in precisely the same way may yield entirely different outputs. The continuous replication of analyses to track system behaviour over time is usually impractical, and in view of the burgeoning field of big data analytics, increasingly outmoded.
Uncertainty of input data values and sensitivity to initial conditions. As per the maxims of chaos theory (see Lorenz Citation1972) interconnected systems can allow features to propagate and multiply out of proportion to the original input. In other words, even small errors in input data can result in wildly inaccurate outputs leading to gross misjudgements of current and predicted system states.
The coarse grain problem. Static method outputs do not typically enable systemic phenomena such as non-linearity, emergence, and phase changes to be abstracted. They result in a ‘low resolution’ output which does not represent the dynamism of the system and the resulting higher order effects.
The argument for the utility of systems ergonomics methods over conventional deterministic methods for analysing complex systems is now well established (see Underwood and Waterson Citation2014; Read, Salmon, and Lenné Citation2015; Walker et al. Citation2017; Salmon et al. Citation2017; Grant et al. Citation2018; Hulme et al. Citation2019; Holman et al. 2020; Holman et al. Citation2021). A potential barrier to their use, however, is that the current state of science in systems methods has not advanced enough to deal with the three weaknesses identified above. The logical next step is to develop methods capable of coping with systemic dynamism. This will better equip ergonomics practitioners to deal with the high value, deeply systemic issues the discipline should be contributing towards (Dul et al. Citation2012).
In this paper a conceptual demonstration of how principles from Dynamic Network Analysis (DNA) (Newman Citation2018) can be used to augment the systems method Event Analysis for Systemic Teamwork (EAST) (Walker et al. Citation2006) is presented. In doing so, this paper advances the directives outlined in the Radical Systems Thinking in Ergonomics Manifesto put forward by Holman et al. (Citation2019) and Dul et al.’s (Citation2012) broader strategic direction to strengthen the value proposition of HF/E.
Event analysis for systemic teamwork (EAST)
EAST is a systems thinking framework which operationalises how performance and safety emerges in complex sociotechnical systems. EAST utilises an array of existing ergonomics methods to develop three interlinked networks. The social network represents the actors within the system and the communication links which join them. The task network represents the activities performed within the system and how they too connect and the information network represents the information which resides in the sociotechnical system, and how individual items of information interconnect (). These networks () can be analysed to drive out systems level insights such as networked system vulnerability (Lane et al. Citation2019), system safety margins (Salmon et al. Citation2018), distributed cognition (Walker, Stanton, Salmon, et al. Citation2010, Banks et al. Citation2018) and distributed situation awareness (Stanton et al. Citation2006; Stewart et al. Citation2008).
Figure 1. EAST framework (adapted from Walker et al. 2006).
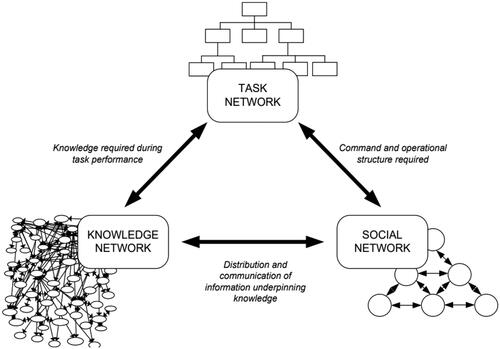
Table 1. EAST network types (adapted from Stanton, Salmon, and Walker Citation2018).
describes the rules regarding the relationship between nodes within EAST Networks.
The use of EAST to represent networked systems evolving over time involves constructing a single aggregated static EAST network, where all the contacts between nodes are represented as a single link (e.g. Stanton, Roberts, and Fay Citation2017). Although additional information can be encoded via weighted links (such as link frequency or importance), conventional EAST networks are still unable to capture the temporal evolution of network structures; if the timings of node contacts are modified, the resultant weighted EAST network structure will remain the same.
Therefore, a simplifying assumption, and an acknowledged limitation (Waterson et al. Citation2015), is that composite networks characteristic of conventional EAST – strictly speaking – represent links between nodes that are always available and persist over time. In other words, they do not capture the temporal characteristics of a system unless individual time-separated EAST analyses are performed (Walker et al. 2009; Walker, Stanton, Baber, et al. Citation2010). While the EAST method offers a useful analytical advance even with this limitation present, it is clear the method can be developed further.
There is a broader relative dearth of HF methods explicitly designed to model temporal characteristics of complex systems. Prominent systems methods such as Cognitive Work Analysis (CWA) (Rasmussen et al. Citation1990), Causal Analysis based on System Theory (CAST) (Leveson Citation2016), STAMP (Leveson Citation2016) and FRAM (Hollnagel Citation2018) do not explicitly model systemic dynamism. Whilst these systems HF methods have enabled the discipline to keep pace with the increasing complex systems characteristic of the 3rd industrial revolution, they can only take us so far. The development of HF methods capable of modelling systemic dynamism is overdue and is particularly prescient given the dawning of the 4th industrial revolution (Holman et al. 2020) or Industry 4.0. Herein lies the motivation of the paper.
Concepts from the burgeoning discipline of Dynamic Network Science are presented in the following section. These concepts underpin a demonstration of concept for a novel extension of EAST called – ‘DynEAST’. The enhanced method is not domain specific, but to demonstrate its efficacy it is applied to a use case from the rail sector. The outcomes of applying DynEAST frame the final section of this paper in which new, and practical, analytical capabilities are revealed.
Augmenting EAST with dynamic network science
Dynamic Network Analysis (DNA) is an emergent scientific field unifying traditional social network analysis (SNA), link analysis, and multi-agent systems theory (Braha and Bar-Yam Citation2006). Whereas nodes and links in a traditional SNA model (and indeed EAST network) are static, nodes and links within a dynamic network model can have additional properties, such as the ability to evolve over time. Dynamic networks come in several forms and differ from traditional social networks in that they can be;
Multiplex: composed of multiple overlapping networks that capture the different types of links between the same nodes throughout a network.
Multilayer: a network made up of multiple connected layers each comprising a distinct node set which can be linked via inter-layer edges.
Dynamic: a network whose nodes and links can evolve over time (also known as a temporal network) (Newman 2016).
The target systems of EAST analyses comprise overlapping and interconnected task, agent, and information networks. Within these networks, nodes and links can appear, configure, reconfigure, and dissolve within and across network layers throughout its timebound lifecycle. The modelling and analyses of these dynamic properties are beyond the capability of the conventional EAST framework. Multilayer and temporal networks, therefore, are particularly germane for extending the analytical capability of EAST. The following subsections explore these network types and discuss their utility for augmenting the EAST framework.
Multilayer networks
A multilayer network comprises a set of network layers. Each of these layers represents a discrete network and contains a series of N nodes and E edges, as is typical of traditional networks. Multilayer networks also contain a set of interlayer edges which connect nodes from one layer to nodes in a different layer. Interlayer edges can connect nodes from any layer to nodes in any other layer, and as such, are not constrained by adjacency. In multilayer networks, therefore, a node within a layer can reach another node in the same layer without being directly connected to it. Multilayer networks have been used to analyse the performance of multi-modal networks such as trade relationships (Gao, Sun, and Shen Citation2015), transmission of diseases (Masuda and Holme Citation2013; Lee et al. Citation2012) and transportation networks (Cantarella and de Luca Citation2005; Gallotti and Barthelemy Citation2015; Tsiotas and Polyzos Citation2015; Du et al. Citation2016; Hong et al. Citation2016; Ganin et al. Citation2017). Across many of these application areas multilayer network analysis has been used to derive node criticality metrics based on node interdependencies (He and Cha Citation2020).
Representing EAST networks as multi-layered enables the identification of interdependencies between task, agent, and information nodes. Node interdependencies could be used to identify critical nodes and links within and across network layers, understand the implications of broken links between nodes and evaluate overall network resilience (Stanton and Harvey Citation2017; Lane et al. Citation2019). The analytical possibilities afforded by representing EAST networks as multi-layered could empower analysts to analytically prototype and ‘stress test’ observed and simulated work systems. This capability could be especially valuable in the development of complex safety critical teamworking tasks. It could also be valuable for the integration of autonomous agents into work systems where critical interdependencies may not be identified and fully understood through traditional EAST analyses alone. For example, optimal propagation of information across human and/or autonomous agents could be evaluated by constructing a range of dynamic EAST networks where information propagates to different agents, at different times and at different rates. Using a dynamic EAST scenario analysis approach, the networks which best support system goals could then be brought forward for further refinement, development, and verification prior to commissioning.
Temporal networks
Dynamic temporal networks are a type of multilayer network whose structure (nodes and edges) and/or associated attributes may change over time (Holme Citation2015). The majority of networked systems are best described as temporal networks (Holme and Saramäki Citation2012; Li et al. Citation2017; Masuda and Lambiotte Citation2020).
Temporal networks can be used to represent the dynamic nature of node interactions across the network life-cycle by modelling links which appear at the point of interaction and disappear when interactions end. Temporal networks can also represent the dynamic characteristics of nodes, which may also appear and disappear at different times across the network life-cycle. Nodes and edges in conventional EAST networks are static and persistent. The properties of temporal networks therefore present a compelling opportunity to model and evaluate dynamism across EAST networks.
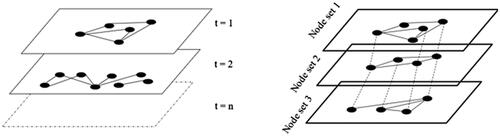
Temporal networks can be represented in several ways. One method is to present them as a time-bound sequence of static networks (Perra et al. Citation2012; Nicosia et al. Citation2013). This method is equivalent to the sequencing of layers in a multilayer network (Lee, Min, and Goh Citation2015) (). Using this approach, networks occurring at discrete time steps – for example, those representing a sub task in EAST – can be modelled by networks bounded by task start and end times. Nodes and links that exist during each interval constitute a snapshot of the system at the given point in time. These snapshots can then be sequenced to form a time-ordered dynamic network which shows the evolution of the network over a given period. This approach is relevant to EAST. Representing temporal networks in this manner would allow the relationships between agents and information flow across EAST networks to be operationalised. This is an important capability the conventional EAST framework does not possess.
Figure 2. Temporal network slices (left) & Multilayer networks (right).
DynEAST
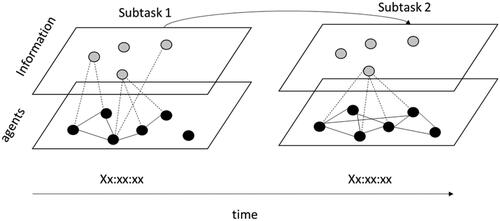
DynEAST is an augmentation of ‘conventional’ EAST that combines features of temporal and multilayer networks to form dynamic models of work systems. The DynEAST approach involves constructing a series of multilayer EAST network ‘slices’ representing the agents and information involved in each subtask. The temporal ‘life’ of subtask network slices are delimited by temporal data relating to the time of subtask occurrence. These slices are then arranged in sequence along a timeline bound by the beginning and end of the observed system (see ). The result is a ‘superordinate dynamic multilayer EAST network’. This superordinate network is different to the static composite networks currently produced using EAST (Salmon et al. Citation2018). Rather than producing a static representation of the total work system, the dynamic superordinate network model reconfigures its constituent nodes and links according to the agents and information involved throughout each sub-task. Dynamic network metrics can be extracted from this superordinate network, and its constituent network slices, to generate traceable insights into the dynamism of the system under analysis. These concepts apply in practice. A typical use case would be to employ DynEAST (as per conventional EAST) to the analysis of a ‘real-world’ work system. Such a use-case forms the topic of a proof-of-concept demonstration described in the next section.
Figure 3. DynEAST network slices.
Whilst EAST and DynEAST inevitably share many features, strengths and limitations, DynEAST exhibits some key points of difference which, the authors argue, extend EAST’s capabilities to model and analyse the features of systemic dynamism in greater detail. These are summarised in .
Table 2. Key differences between EAST and DynEAST concept.
Applying DynEAST
DynEAST, and its constituent multilayer and temporal network concepts, were applied to data collected from a complex track maintenance teamworking task carried out a by a major Australian rail operator. The following methodological steps (deliberately inspired by Stanton et al. Citation2017) were taken to collect and analyse this data and generate the temporal multilayer network and its resultant dynamic metrics. These steps can be used as a guide for further applications of the DynEAST approach. It should be noted that the data collection and analysis methods which typically feed into conventional EAST analyses (such as Task Analysis, Semi-structured interviews, Critical Decision Method, etc.) are all compatible with the DynEAST concept and should be used to inform DynEAST networks where appropriate.
Step 1 – Define analysis aims
As previously discussed, EAST (and DynEAST) can be used to reveal systemic insights across a broad range of factors critical to the safe and efficient functioning of any work system. In this particular case, the aim of the analysis was to generate a temporal multi-layered EAST network to understand how critical information is shared between agents across sub-tasks within a railway track possessionFootnote1 activity. The focus of this use-case is, therefore, on how distributed situational awareness (DSA) is achieved. DSA conceptualises Situational Awareness as a system property that emerges through interaction of agents and technology across tasks (see Salmon et al. Citation2006; Stanton et al. Citation2006; Stanton, Baber and Harris Citation2008; Salmon et al. Citation2009). DSA is vital to track maintenance activities due to their communication and information burden, safety critical nature, their geographical span, and quantity of agents involved (Golightly et al. Citation2013). DSA is a feature that EAST/DynEAST can expose from within work systems, among many others.
Step 2 – Define the task or scenario under analysis
Railway track possessions are a complex distributed task involving multiple agents using safety critical information to complete a series of sub-tasks. At a broad level, the functional purpose of a track possession is to allow safe access to a section of track for a pre-planned portion of time. This is to enable maintenance of railway assets without the risk of rail traffic being present.
The Possession Protection Officer’s (PPO’s) overall task is to plan and implement the track possession. This involves briefing a series of Protection Officer (PO) teams on the pre-planned method, location, and duration of worksite protection. The PPO then coordinates the POs to establish worksite protection using physical measures such as point clips and/or Railway Track Signals (RTS) at specified locations. It also includes removing protection once all maintenance work has been complete.
During planning and implementation, the PPO must communicate with the signaller(s) responsible for rail operations across the track territory. This communication includes intended worksite protection methods, location of the possession, forecasted duration and planned work-scope. The PPO may also request that the signaller(s) put blocks on signals to protect the worksite (thus the signals become part of the worksite protection). Signal protection arrangements are often pre-planned but may need to be negotiated in account of ongoing or foreseen operational constraints. The signaller must formally grant the PPO possession of the planned track territory prior to work taking place on track. During the possession, the PPO may request the signaller to perform various actions relating to the maintenance tasks occurring within the possession, such as ‘swinging points’.
Step 3 – Define the agents involved in the task or scenario under analysis
shows the agents involved in the scenario and briefly describes their role in relation to possession management.
Table 3. Agents involved in the track possession scenario.
Step 4 – Conduct observational study of the task or scenario under analysis
The planning and implementation of a track possession was observed between 21:05 and 03:55 during a night-shift in March 2018. The possession took place across a track territory in New South Wales, Australia, and involved 11 participants and one observer. Approval for data use was sought and granted from the participants and the Department Head of Human Factors of the rail operator.
The observation was carried out from the point of view of the Possession Protection Officer (PPO), and focussed on communication tasks associated with planning, briefing and management of the Local Protection Authority. The PPO coordinated five PO teams and a signaller via radio.
Step 5 – Collect data as per the analysis aims
From the PPO’s point of view, tasks related to the planning, execution, and management of track possessions are primarily communicative and coordinative. Instances where the PPO initiated a communication with another agent within the work system were identified as discrete tasks. Thus, data relating to the PPO’s communication with other actors within the work system was collected. The data attributes comprised of who the agent communicated with, the information conveyed, and the time at which the communication occurred. All data attributes were collected by an observer who was shadowing the PPO throughout the activity. Data was collected using a notepad.
Step 6 – Analyse data to identify agents and information nodes
Content analysis of the communications data attributes described in Step 5 enabled a list of 37 information nodes to be generated. These represented key information conveyed during each interaction between the PPO and the recipient agents (and vice versa). In this scenario the nodes also represented the task-related information conveyed to and from the PPO to the other agents. A further set of seven nodes represented the agents in the scenario.
Step 7 – Construct multilayer task networks
A series of forty multilayer ‘information by agent’ networks were created, each one representing a discrete communication task. For this analysis, a task was defined as every instance of purposive communication between the PPO and another agent related to the goal of the work system. For example, the worksite protection briefing was classified as a task, whereas a casual conversation between two agents during the observation was not. Thus, task networks were not defined for communications data unrelated to the work system. A formal Task Analysis was not developed as the generation of time-ordered task networks itself represents the sequence of tasks undertaken.
The agents involved in the communication tasks formed an ‘agent node layer’ within the multilayer network. The task-based information exchanged during communications comprised the ‘information node layer’. Links between agent nodes represent the network of agents involved in the communication, whereas interlayer links show the information used and conveyed by agents. Temporal data relating to communications during the observation was used to timestamp each multilayer task network. The multilayer task networks were then arranged in a time-respecting sequence. Data which fed into the networks were checked for accuracy by Subject Matter Experts (SMEs) involved in the task during periods of non-activity. Retrospective verbal protocol analysis (Kuusela and Paul Citation2000) was performed immediately after PPO tasks to confirm information conveyed and the agents to which it was conveyed to. This technique enabled task networks to be validated in the field. Individual networks were reviewed against the operator’s network rules to ensure they accurately represented the information conveyed during specific subtasks.
Step 8 – Identify metrics of interest and perform dynamic network analyses
Dynamic network and node metrics were derived from the resulting meta-network. These related to the main area of interest which in this demonstration was DSA. Other DynEAST analyses may have different foci for which these, or different, dynamic network node metrics may be appropriate. The metrics ‘dynamic network density’ (Dd) and ‘dynamic critical node in-degree centrality’ (CD) were deployed to explore DSA. These metrics were calculated using ORA network analysis software.
Network density represents the level of interconnectivity of the network in terms of relations between nodes. Density is expressed as a value between 0 and 1, with 0 representing a network with no connections between nodes and 1 representing a network in which every node is connected to every other node (Walker et al. Citation2011). Higher density values are indicative of a well-connected network in which tasks, agents and information are tightly coupled. Network density is used here as a proxy for the volume of communication and information embedded within the task network. This measure will vary by task in accordance with the relative volume of information conveyed between agents participating in the exchange at any one moment in time. In other words, the network density metric is contingent on the communication ‘traffic’ occurring throughout subtasks.
In-degree node centrality measures were derived to evaluate the importance of agents and information throughout the scenario (). For the purposes of the demonstration of concept, seven critical information nodes were identified for analysis. These nodes were judged to represent information that has immediate bearing on the successful execution (or otherwise) of track possession management tasks and for the establishment and continuation of site safety ().
Table 4. Critical information nodes.
At any point in time there will be ‘dormant nodes’ which are currently unconnected. These dormant nodes represent information and agents that were not involved in a particular subtask but were active during other sub-tasks. Dormant nodes were retained in each network in order to be able to derive metrics relative to the whole set of possible agents and information across the work system; not only those active during a given task. Their inclusion allowed the comparison of subtask metrics against the superordinate network.
Findings
shows the set of time-ordered multilayer information by agent networks. It also shows the network density and critical node centrality metrics associated with each task. This ‘film strip’ representation allows the reader to scan the scenario and visualise the network dynamics in the context of a static paper-based academic article. The networks were generated and analysed in the ORA Dynamic Network Analysis software. The supplementary file shows the network dynamics as an animation, a visualisation method more suited to DynEAST.
Table 5. DynEAST network.
New capabilities – extending EAST
Pushing the analytical boundary of the EAST framework enables insights into previously intractable HF/E phenomena. In the case study described above it shines a light into new forms of dynamic risk modelling, the dynamic nature of DSA, and work-as-done versus work-as-imagined. The enabler of these insights is the capability of DynEAST to model work-as-done in a more granular way than conventional EAST, grounding it firmly within the pragmatist framework underpinning applied HF/E enquiry (Walker et al. Citation2017). DynEAST models of work-as-done empower HF/E analysts to genuinely grapple with ‘thorny’ HF/E phenomena that are well known, yet difficult to approach with empiricism.
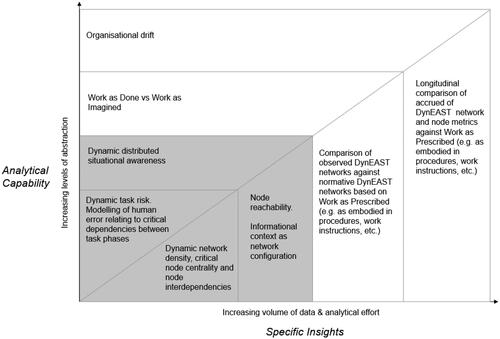
Before delving into the detailed findings as they relate specifically to this case study, shows four phenomena that DynEAST can be used to study, and the relative analytical effort required to address them. Uniting these phenomena is the notion of dynamism; the aspect of complexity which the DynEAST concept aims to tackle.
Figure 4. Insights enabled by DynEAST. Shaded areas show the phenomena discussed in relation to findings of the immediate case study, whilst the unshaded areas show those phenomena not directly addressed but to which DynEAST analyses can be applied.
Dynamic task-based risk profile – in-degree centrality
Dynamic In-degree centrality scores were calculated for the seven information nodes identified a-priori as being critical to safety in the case study. In-degree centrality is given by:
Within the context of the case study, in-degree centrality scores reflect the proportion of agents that have access to these critical pieces of information, and at what time, through their involvement or otherwise within a communication task. For example, the information node Worksite Protection Plan appeared in the task networks Confirm Protection Arrangements with Signaller and Worksite Briefing and yielded in-degree centrality values of 0.28 and 0.85 respectively. The lower value for Confirm Protection Arrangements with Signaller represents the fact that only two out of the seven total agents within the work system were connected to that information node the during the task compared to Worksite Briefing where six out of the seven agents were connected to it.
In-degree centrality scores for critical information nodes points to be clipped A, B, C, D and E were extracted from the set of time ordered task networks. These nodes appeared numerous times throughout the work system although the frequency and patterns of their transmission was not uniform across PPO and PO team interactions as indicated by their respective dynamic in-degree centrality scores.
The dynamics of latent errors
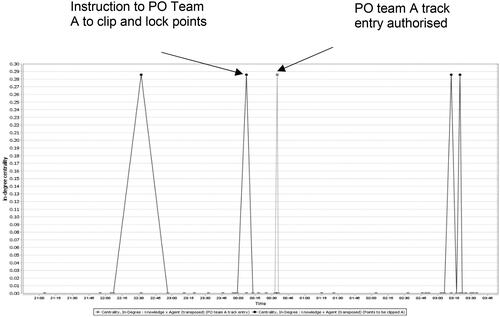
Extraction of dynamic in-degree centrality scores for critical information nodes can generate insights into dynamic latent error potential. Nodes Points to be clipped B, C, D and E, all appeared in the initial check described by task network PO Team E Pre-work check and appeared again when the PPO instructed PO teams to clip and lock points, and once more at 00:13 when the PO team called the PPO to confirm that points had been clipped and locked. The appearance of these nodes prior to the placement of protection and immediately after its placement is indicative of a corrective control which could mitigate against active errors (i.e. protection applied to the wrong points). The information node points to be clipped A essentially mirrors the appearance of other points to be clipped nodes but with one potentially significant difference; PO team A does not confirm with the PPO that their points have been clipped and locked after protection has been placed immediately after the PPO’s instruction to clip and lock points at 00:07. The links between information node Points to be Clipped A and agent nodes PPO and PO Team A did not occur at a critical juncture; immediately after the application of PO Team A’s point clips and prior to the entry of track by both PO Teams ().
Figure 5. Work as Done; omission of PO team A point clips application check.
The finding that PO team A did not confirm that their points and been clipped and locked, nor the request for the information from the PPO, highlights the advantage of the DynEAST concept over conventional EAST analyses for analysing dynamic work systems. Representation of the case study through a conventional EAST network would not have revealed this omission as information node Points to be clipped A was connected to agent nodes PPO and PO Team A during the subsequent PO Team A confirm point removal task network. Using conventional EAST, a link between the information and agents would have been shown to have had always been present throughout the course of the task. These findings are powerful. Using DynEAST, the analyst can represent a dynamic model of work-as-done from which latent error potential can be made manifest ().
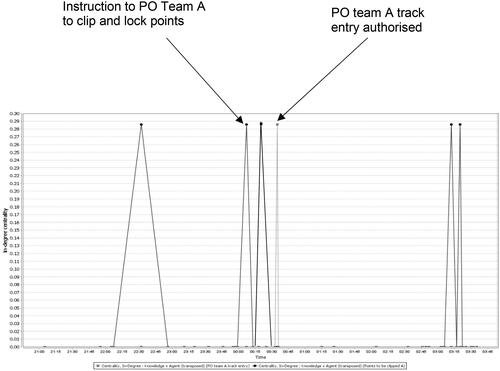
Figure 6. Work as imagined; PO team A point clip application check completed.
Dynamic task risk assessment
The case study is also a demonstration of DynEAST’s capability for probabilistic modelling of system error relating to critical task dependencies between task phases (see Wang et al. Citation2021). PO team A’s omission of a confirmation to the PPO that protection had been placed would likely increase the probability that the protection task would not be completed as prescribed during the planning phase. The breakdown of this defence would have allowed any latent errors made during the planning phase to propagate undetected through the dynamic network and manifest as an active error at the point of protection placement.
Within an organisational context the analyst could use findings such as these as a basis for further observations and analyses. DynEAST’s capture of dynamic work-as-done permits further analysis of what ‘normal’ actually is: are the discovered latent errors an outlier or are they the norm? It is now possible to more efficiently direct analytical effort and resources to find out. It is also possible to set thresholds based on network metrics to define what is considered acceptable and what warrants further action.
Dynamic situation awareness
The capability of DynEAST to model time-ordered interactions between nodes can be leveraged to build enhanced models of DSA. These enhanced models could yield an array of theoretical and practical benefits of interest to the HF practitioner. A component of Stanton et al.’s definition of DSA states ‘DSA is defined as activated knowledge for a specific task within a system’ (Stanton et al. Citation2006). Stanton et al.’s notion of ‘activated knowledge’ can be readily reconciled with outputs from DynEAST analyses, which can be used to;
Detect the presence of information nodes and agent nodes within discrete task networks through dynamic in-degree centrality measures.
Measure the reachability of information nodes transmitted or received by agents, and their temporal recency.
Identify and understand the informational context within which information was transmitted using network density.
DynEAST outputs can therefore be used to operationalise the notion of ‘activated knowledge’ and to examine it in terms of its transience, reachability (see next), and informational context across complex work systems. These angles of inquiry build on the many insights into DSA realised through application of conventional EAST analyses (see Walker, Stanton, Salmon, et al. Citation2010; Neville and Salmon Citation2016; Stanton et al. Citation2006; Salmon et al. Citation2017).
Dynamic node reachability
Reachability refers to the ability of one node to connect to another via a link or set of links. In the case of temporal multi-layered networks, the reachability of nodes can apply at intra and inter layer levels. In the context of the case study, therefore, reachability can be applied from agent-to-agent (intralayer), information-to-information (intralayer) and agent-to-information (interlayer) nodes. When considering dynamic networks, the reachability of nodes evolves as nodes and links appear and disappear as the network reconfigures over time. Thus, in dynamic networks, reachability of one node to another does not necessarily persist over time. Rather, node reachability is bounded by the presence of discrete node contact instances; links between nodes are only valid during a defined time interval (Holme and Saramäki Citation2012). DynEAST, which represents work systems as a dynamic multi-layered network, can therefore be used to model the dynamic interlayer reachability of information by individual agents.
Utilising the notion of activated knowledge as a conceptual lens, the temporally constrained reachability of information nodes across multi-layered task networks can be used to model the dynamism of DSA across a work system. Viewing work systems through this lens, we can not only ask ‘who knows what and when?’, but also ‘who could know what and when?’ and, perhaps more consequentially, ‘who couldn’t have known what and when’.
One way to formally represent temporal node reachability within dynamic networks is through time evolving node reachability sets (see Williams and Musolesi Citation2016). A temporal reachability set Kvx[T](v1, v2,…vn) is a set of nodes K that have been reached from origin node vx by the end of timestep T. Information nodes that are active within the reachability set are denoted as 1 and nodes that are not active but have been previously active are denoted by 1(t<0[z]), where t is the duration in minutes between the node being active and the T value of the reachability set (the t value can only ever be negative). The z value refers to the accrued instances of information node transmission at reachability set timestamp T. Nodes that have not been activated are denoted as 0 in the reachability set. Broadly speaking, a lower –t value can be considered to contribute to the approximated degree of activated knowledge decay (see Berman, Jonides, and Lewis Citation2009). However, this may be counterbalanced by accrued transmission. Both factors must be considered in relation to one another, as a high transmission rate may not necessarily counter the effects of decay as the transmission occurrences may not be distributed uniformally.
The temporal reachability set for the information node Worksite protection plan at t = 21:05:00 shows active links between the PPO and Signaller only, and no previous transmissions. Therefore, this node was not reachable by the remaining agent nodes (see ).
Figure 7. K(V worksite protection plan [21:05:00]).
![Figure 7. K(V worksite protection plan [21:05:00]).](/cms/asset/c2e08712-74d5-45b7-9a76-7dda5deaf772/terg_a_2092217_f0007_b.jpg)
In contrast, the temporal reachability set for worksite protection plan at t = 21:55:00 shows active links for all agents apart from the signaller. However, the signaller’s previous exposure to the information node at t = 21:05:00 indicates that the link was once active but has been subject to a degree of decay. Thus, temporal reachability set K(V worksite protection plan [21:55:00]) shows that information node Worksite protection plan was transmitted to the Signaller 50 minutes ago with an accrued transmission of 1 ().
Figure 8. K(V worksite protection plan [21:55:00]).
![Figure 8. K(V worksite protection plan [21:55:00]).](/cms/asset/9db4ea6b-379a-4878-b378-aca02096a538/terg_a_2092217_f0008_b.jpg)
This degree of knowledge decay may decrease the likelihood of accurate DSA as the information node was transmitted to the signaller once, and 50 minutes earlier than the reachability set timestamp (although it is likely that the signaller would record this information on a form or other memory aid).
This brief example highlights how dynamic reachability offers a means to build more nuanced understandings around the formulation and evolution of DSA across dynamic work systems in the field. Retrospective node reachability analysis can be applied to understand the degree to which the temporal patterns of information dissemination contributed to the formulation and dynamic profile of DSA, and most importantly, how this directly impacted task performance. On the prospective side, the concept of reachability can be applied to the development of broader work systems and working procedures. It would serve as an aid to designers for embedding optimal patters of information propagation. In this context, node reachability allows us to ask; ‘who should know what and when’? This is a significant extension to the capability of EAST.
Informational context
Analysis of dynamic network density also reveals some noteworthy findings that are particularly useful for understanding the formulation and dynamic profile of DSA. At a broad level, the networks associated with the track possession planning phase are dense relative to task networks across other phases. The mean density metrics for the tasks within this phase is 0.15 (with a peak of 0.208 for the communication task PO movements) compared with 0.03 for remaining tasks which occurred on track. The density of this task phase indicates that agents and information are well connected during planning tasks, but less so when completing planned tasks. It is during this phase that the PO teams discuss critical task information such as the location(s) and timings of their own tasks (e.g. protection placement, planned movements, etc.), and form and consolidate working mental models of their tasks in relation to the tasks of other PO teams involved in the possession. Any communication errors which occur in this task phase could propagate active errors during subsequent protection placement and other associated activities. In contrast, the relatively low density of networks representing PPO requests for PO teams A and E to clip and lock of points (0.07) show that little information is used to complete these tasks.
The high network densities typified by task networks in the planning phase may indicate the potential for a low signal to noise ratio relating to information immediately pertinent to individual PO teams. With regards to DSA, a low signal to noise ratio represents a context where critical information is conveyed alongside information that may not be pertinent to the agent(s) in question. For example, task network Protection Briefing involves the PPO and all PO Teams and yields a network density of 0.13 (see ). In relation to their active tasks of clipping and locking points, PO Teams are exposed to a multitude of surplus information during this task. The density of this network may reduce the salience of critical task information to agents and increase the likelihood of miscomprehension, recording errors or otherwise hinder the formulation of an accurate mental model of the task(s) that the critical information is related to. In the context of complex teamworking tasks, however, a densely connected information network involving all POs presents the opportunity for developing a shared mental model of the complete possession and the timing and importance of their specific tasks within it (see Salmon et al. Citation2010).
Figure 9. Dense information context.
DynEAST can offers a robust means of making these trade-offs explicit. By exploring the network configurations within which critical information is transmitted, the degree to which the organisation of agents supports the formulation of functional DSA can be evaluated. This can be applied at both task and system levels.
Further analysis of the discrete task networks reveals a seemingly obvious, but potentially important finding with relation to reduction of error probability within information-dense team working environments. That is, the instantiation of network configurations representing the exchange of latent information, and their replication when the information is actively ‘used’ during a task. To illustrate this, shows the appearance of information node Points to be Clipped E across three task networks. These networks represent the exchange of information between the PPO and PO Team E relating to the points to be clipped and locked by PO Team E. The instantiation of this network configuration prior to and after PO Team E’s active task of clipping and locking points demonstrates an in-built error reduction strategy of pre and post task checking.
Figure 10. Replication of network configuration across tasks.

Although the implication of this finding in this simple case study is limited, what is revealed is the broader utility of using DynEAST to identify multiple (re)occurring network configurations; or, perhaps more critically, their absence. The absence of multiple occurring networks may indicate that critical information had not been communicated, pre-checked or recorded between agents involved in a task which dependent on it (e.g. clipping and locking specific points at a specific location). In other words, the appearance of the information only during its active use throughout a critical task would indicate the absence of pre-task information checks. Therefore, within an information-dense team working task occurring over longer periods of time, the absence of discrete multiple occurring networks containing critical information may be a leading indicator of error potential. Thus, introduction of a network configuration containing critical information nodes prior to their active use within an identical (or similar) network configuration could serve as a type of inoculation against error. Again, an understanding of the operational context and the inherent trade-offs of any intervention is key. DynEAST can provide the entry point. DynEAST models can be formulated and iterated to examine the effects of patterns of informational relations on emergent system outcomes. This can be approached from the perspective of retrospective analyses of complex teamworking tasks (as was demonstrated by the case study) or explored through prospective DynEAST simulations. Simulated modifications to agents and information nodes involved in and across tasks networks can support identification of the network configurations which reinforce optimal DSA. The value of the latter approach becomes more apparent as networks scale in their diameter, geographical expansiveness and temporal lifecycle, making observational analyses impractical.
From work as done vs work as imagined to organisational drift
DynEAST has the potential to tackle the challenges of understanding differences between ‘Work as Done vs Work as Imagined’ at a level of fidelity that cannot be realised through application of conventional static-based HF analyses. In relation to communication tasks associated with possession management, the dynamic temporal EAST network presented provides a model of ‘Work as Done’ in the field. These findings could be compared against work as represented by procedures, rules and work instructions to understand the extent to which work as done diverges (or otherwise) from work as represented by these artefacts. Such a comparison would be relatively straightforward and could provide powerful insights. Dynamic metrics extracted from a normative DynEAST network reflecting work as prescribed by rules and procedures could be used as a baseline against which metrics extracted from DynEAST networks representing the same task as observed in the field could be compared. Deviation of DynEAST ‘Work as Done’ metrics from normative metrics would indicate a disparity between Work as Done and Work as Imagined. Observed disparities between Work as Imagined and Work as Done metrics could challenge long-held assumptions about how work is performed in the field and could invoke action to review the sufficiency of procedures and rules.
DynEAST representations of Work as Done could also yield valuable insights into system resilience as the impacts of various ‘stressors’ on system performance (e.g. weather, equipment availability, staffing availability etc.) can be modelled and compared against normative metrics. In doing so, the ways in which task, information and agent networks configure and reconfigure in response to variations in local and external conditions over time can be analysed.
Organisational drift
Accident theorist Turner suggested that organisational accidents undergo an incubation period, where the necessary conditions for accidents emerge, interact, and eventually initiate a sequence of events that lead to catastrophe (Turner and Pidgeon Citation1997). According to Turner, this process is often so gradual that leading indicators of drift towards safety margins may be barely perceptible at the organisational level. Further still, Turner and other safety scholars (e.g. Weick and Sutcliffe Citation2011; Dekker and Pruchnicki Citation2014; Reason Citation2016) note the inability of organisations to meaningfully conceptualise and monitor drift over time, due to how gradual and diffuse (within the organisation) the phenomenon is. It can be argued that navigation of the conceptual space between safety and production boundaries has been stifled by our inability to monitor and analyse work-as-done at scale and across time.
Longitudinal analysis of performance against prescribed norms using DynEAST could provide organisations one way to conceptualise and monitor drift over time. Comparison of DynEAST Work as Done networks against a large sample of tasks ‘as imagined’ could be used to generate an organisation-wide profile of where an organisation ‘is’ against where it ‘should be’ relative to safety and production boundaries. DynEAST networks showing increasing deviation from safety and quality standards over time could indicate the organisation in question is in fact in a state of drift. Conversely, accrued network data showing a consistent adherence to prescribed standards would indicate that organisation is position in a state of relative stability. The direction of drift, between the margins of safety and productivity, could be detected through observation of the type and characteristics of tasks observed. For example, a longitudinal dataset indicating the omission of safety checks across a sample of safety-related tasks analysed over time may imply that safety is being traded off in favour of production. If the incidence of omission were increasing, this would suggest that the organisation is in a state of drift towards the margin of safety.
Doesn’t EAST do all this anyway?
Yes and no. Whilst EAST networks can be decomposed into discrete time stamped composite networks, they cannot be formally subjected to dynamic network analyses. The crucial differentiator between EAST and the concept presented in this paper is that DynEAST is multi-layered. This difference may seem subtle, but it is an important difference. The formal linking of constituent agent and information EAST networks via interlayer edges enabled network metrics to be derived at intra and inter layer levels. For the present case study, these metrics represented the relationships between the agents and information involved within each time-ordered subtask and the active use of information by specific agents during tasks at discrete times. It is the analytical insights afforded by these new metrics that underpin the extended capabilities discussed throughout the previous section. Derivation of multilayer network metrics is not possible with conventional mono-layered EAST networks. As such, the relationships between task, social and agent node-sets cannot be formally modelled and must be inferred by the analyst. To illustrate this point, shows mono-layer network metrics for the constituent agent networks layer (as would be typical for a conventional EAST network).
Table 6. Mono-dimensional network metrics.
The PPO has the highest in-degree centrality score (0.648), indicating they had the highest communication burden, and the agent network is relatively dense (0.776). Whilst these metrics provide a general overview of task loading, they offer little insight into what information was conveyed to and from the PPO, when it was conveyed and during which tasks. For instance, these metrics do not tell us whether the PPO completed all communications during the first subtask and only exchanged non-critical information throughout the remainder, or whether the PPO was involved in every subtask and conveyed only critical information to other agents. Whilst the authors acknowledge this example is somewhat of a ‘strawman’, it serves to illustrate an important point; metrics derived from mono-layer EAST networks leave discernment of significance to the analyst. This may be tolerable (and even preferable) for EAST analyses of simple systems spanning short periods of time. But applied to complex systems of greater scales, dynamism, time spans and densities, mono-dimensional EAST metrics simply do not offer the granularity necessary to derive specific insights into the phenomena of interest discussed throughout the previous section.
Limitations
Despite the new analytical capabilities introduced by DynEAST, the concept exhibits several disadvantages, some of which are shared with the conventional EAST framework. Firstly, the time taken to apply the DynEAST concept would likely be greater in comparison to EAST if both were used to model the same work system due to the additional data required and its incorporation into time-ordered multilayered networks. The extent of this depends somewhat on the data coding methodology and the software used to construct, analyse, and present the time-ordered multilayer networks. A further limitation is the additional training and familiarisation time, which is already high for conventional EAST. Along with training in the various data collection, task analysis and communication analysis techniques which feed into conventional EAST, an understanding of the additional network types and a familiarisation with wider DNA concepts is necessary. Furthermore, training and familiarisation with the analytical software (or coding language) used to construct and analyse DynEAST networks would be required. As with EAST, DynEAST also demands a high level of access to the domain, task and operational SMEs to collect data. In addition, addressing the element of subjectivity when creating and linking the networks relies heavily on unrestricted access to SME knowledge, operational procedures and other documentation, and more broadly, the concession of the domain operator with the needs of the study. Like EAST, DynEAST outputs must be validated by SMEs with domain knowledge. The conventional means of data collection (i.e. observer-based) deployed for this demonstration of concept highlights another limitation shared with conventional EAST; scalability. Despite this, DynEAST networks (like EAST) can theoretically be driven or otherwise informed by live-data inputs. Combining live-data inputs with a computational approach to network generation would be a strong basis to overcome this limitation. Finally, the outputs of DynEAST can be difficult to represent in static graphical form. Dynamic representations of evolving network structure are simply not suited to conventional means of presentation, such as industry reports and journal papers. Acceptance of alternative report and journal paper formats would address this limitation.
Conclusion
DynEAST can overcome some key limitations of the conventional EAST framework. Currently EAST is not able to model the dynamism presented by real-work systems in a way that remains tractable while addressing strategic HF/E problems. The case study presented, and resultant discussion, shows how principles from DNA can be used to overcome this limitation. DNA unlocks the potential of EAST, allowing it to be applied and scaled to design and analyse potentially massive dynamic sociotechnical systems (Holman et al. 2020).
As acknowledged, the additional DNA components may increase the application time and training time required for users to familiarise with DynEAST in comparison with the conventional EAST framework. Nevertheless, the increasing availability of DNA software and the equalising effects of ‘DNA-capable’ open-source coding languages (such as R), make DynEAST accessible for HF/E practitioners, researchers, and students alike. Along with analytical speed, the computational augmentation of EAST diversifies the pool of potential data sources, enables the analysis of a near-limitless volume of data and, combined with Big Data inputs, allows systems of great scale to modelled. As the discipline adapts to the era of ‘Big Data’, the significance of these capabilities cannot be overstated (Holman et al. Citation2019; Holman et al. Citation2021).
Supplemental Material
Download MS Power Point (23.2 MB)Notes
1 A Localised Possession Authority (LPA) is a form of track possession. For the purpose of this paper, the terms track possessions and LPA are used interchangeably.
References
- Banks, V. A., N. A. Stanton, G. Burnett, and S. Hermawati. 2018. “Distributed Cognition on the Road: Using EAST to Explore Future Road Transportation Systems.” Applied Ergonomics 68: 258–266.
- Berman, M. G., J. Jonides, and R. L. Lewis. 2009. “In Search of Decay in Verbal Short-Term Memory.” Journal of Experimental Psychology 35 (2): 317–333.
- Braha, D., and Y. Bar‐Yam. 2006. “From Centrality to Temporary Fame: Dynamic Centrality in Complex Networks.” Complexity 12 (2): 59–63. doi:10.1002/cplx.20156.
- Cantarella, G. E., and S. de Luca. 2005. “Multilayer Feedforward Networks for Transportation Mode Choice Analysis: An Analysis and a Comparison with Random Utility Models.” Transportation Research Part C 13 (2): 121–155. doi:10.1016/j.trc.2005.04.002.
- Dekker, S. W., P. A. Hancock, and P. Wilkin. 2013. “Ergonomics and Sustainability: Towards an Embrace of Complexity and Emergence.” Ergonomics 56 (3): 357–364. doi:10.1080/00140139.2012.718799.
- Dekker, S., and S. Pruchnicki. 2014. “Drifting into Failure: theorising the Dynamics of Disaster Incubation.” Theoretical Issues in Ergonomics Science 15 (6): 534–544. doi:10.1080/1463922X.2013.856495.
- Du, W. B., X. L. Zhou, O. Lordan, Z. Wang, C. Zhao, and Y. B. Zhu. 2016. “Analysis of the Chinese Airline Network as Multi-Layer Networks.” Transportation Research Part E: Logistics and Transportation Review 89: 108–116. doi:10.1016/j.tre.2016.03.009.
- Dul, J., R. Bruder, P. Buckle, P. Carayon, P. Falzon, W. S. Marras, J. R. Wilson, and B. van der Doelen. 2012. “A Strategy for Human Factors/Ergonomics: Developing the Discipline and Profession.” Ergonomics 55 (4): 377–395. doi:10.1080/00140139.2012.661087.
- Gallotti, R., and M. Barthelemy. 2015. “The Multilayer Temporal Network of Public Transport in Great Britain.” Scientific Data 2 (1): 1–8. doi:10.1038/sdata.2014.56.
- Ganin, A. A., M. Kitsak, D. Marchese, J. M. Keisler, T. Seager, and I. Linkov. 2017. “Resilience and Efficiency in Transportation Networks.” Science Advances 3 (12): e1701079.
- Gao, C., M. Sun, and B. Shen. 2015. “Features and Evolution of International Fossil Energy Trade Relationships: A Weighted Multilayer Network Analysis.” Applied Energy 156: 542–554. doi:10.1016/j.apenergy.2015.07.054.
- Golightly, D., B. Ryan, N. Dadashi, L. Pickup, and J. R. Wilson. 2013. “Use of Scenarios and Function Analyses to Understand the Impact of Situation Awareness on Safe and Effective Work on Rail Tracks.” Safety Science 56: 52–62. doi:10.1016/j.ssci.2012.08.007.
- Grant, E., P. M. Salmon, N. J. Stevens, N. Goode, and G. J. Read. 2018. “Back to the Future: What Do Accident Causation Models Tell us about Accident Prediction?” Safety Science 104: 99–109. doi:10.1016/j.ssci.2017.12.018.
- He, X., and E. J. Cha. 2020. “Modeling the Damage and Recovery of Interdependent Civil Infrastructure Network Using Dynamic Integrated Network Model.” Sustainable and Resilient Infrastructure 5 (3): 152–167. doi:10.1080/23789689.2018.1448662.
- Hollnagel, E. 2018. Safety-I and safety-II: The past and Future of Safety Management. Boca Raton: CRC Press.
- Holman, M., G. Walker, M. Bedinger, A. Visser‐Quinn, K. McClymont, L. Beevers, and T. Lansdown. 2021. “Data Analytics in Human Factors.” Handbook of Human Factors and Ergonomics 2021: 1351–1384. doi:10.1002/9781119636113.ch51.
- Holman, M., G. Walker, T. Lansdown, and A. Hulme. 2019. “Radical Systems Thinking and the Future Role of Computational Modelling in Ergonomics: An Exploration of Agent-Based Modelling.” Ergonomics 63 (8): 1057–1074. doi:10.1080/00140139.2019.1694173.
- Holman, M., G. Walker, T. Lansdown, P. Salmon, G. Read, and N. Stanton. 2021. “The Binary-Based Model (BBM) for Improved Human Factors Method Selection.” Human Factors 63 (8): 1408–1436. doi:10.1177/0018720820926875.
- Holman, M., G. Walker, T. Lansdown, P. Salmon, G. Read, and N. Stanton. 2021. “The Binary-Based Model (BBM) for Improved Human Factors Method Selection.” Human Factors 63 (8): 1408–1436. doi:10.1177/0018720820926875.
- Holme, P. 2015. “Modern Temporal Network Theory: A Colloquium.” The European Physical Journal B 88 (9): 234. doi:10.1140/epjb/e2015-60657-4.
- Holme, P., and J. Saramäki. 2012. “Temporal Networks.” Physics Reports 519 (3): 97–125. doi:10.1016/j.physrep.2012.03.001.
- Hong, C., J. Zhang, X. B. Cao, and W. B. Du. 2016. “Structural Properties of the Chinese Air Transportation Multilayer Network.” Chaos, Solitons & Fractals 86: 28–34. doi:10.1016/j.chaos.2016.01.027.
- Hulme, A., J. Thompson, K. L. Plant, G. J. Read, S. Mclean, A. Clacy, and P. M. Salmon. 2019. “Applying Systems Ergonomics Methods in Sport: A Systematic Review.” Applied Ergonomics 80: 214–225.
- Kuusela, H., and P. Paul. 2000. “A Comparison of Concurrent and Retrospective Verbal Protocol Analysis.” The American Journal of Psychology 113 (3): 387–404.
- Lane, B. R., P. M. Salmon, A. Cherney, D. Lacey, and N. A. Stanton. 2019. “Using the Event Analysis of Systemic Teamwork (EAST) Broken-Links Approach to Understand Vulnerabilities to Disruption in a Darknet Market.” Ergonomics 62 (9): 1134–1149. doi:10.1080/00140139.2019.1621392.
- Lee, K. M., B. Min, and K. I. Goh. 2015. “Towards Real-World Complexity: An Introduction to Multiplex Networks.” The European Physical Journal B 88 (2): 48. doi:10.1140/epjb/e2015-50742-1.
- Lee, S., L. E. Rocha, F. Liljeros, and P. Holme. 2012. “Exploiting Temporal Network Structures of Human Interaction to Effectively Immunize Populations.” PLoS One. 7 (5): e36439. doi:10.1371/journal.pone.0036439.
- Leveson, N. G. 2016. Engineering a Safer World: Systems Thinking Applied to Safety. Massachusetts: MIT Press.
- Li, A., Sean P. Cornelius, Y.-Y. Liu, L. Wang, and A.-L. Barabási. 2017. “The Fundamental Advantages of Temporal Networks.” Science 358 (6366): 1042–1046. doi:10.1126/science.aai7488.
- Lorenz, E. 1972. “Predictability: Does The Flap of a Butterfly’s Wings in Brazil Set Off a Tornado in Texas” American Association for the Advancement of Science. http://gymportalen.dk/sites/lru.dk/files/lru/132_kap6_lorenz_artikel_the_butterfly_effect.pdf
- Masuda, N., and P. Holme. 2013. “Predicting and Controlling Infectious Disease Epidemics Using Temporal Networks.” F1000prime Reports 5: 6.
- Masuda, N, and R. Lambiotte. 2020. Guide to Temporal Networks, A (Vol. 6). Singapore: World Scientific.
- Neville, T. J., and P. M. Salmon. 2016. “Never Blame the Umpire–A Review of Situation Awareness Models and Methods for Examining the Performance of Officials in Sport.” Ergonomics 59 (7): 962–975. doi:10.1080/00140139.2015.1100758.
- Newman, M. 2018. Networks. Oxford: Oxford University Press.
- Nicosia V., J. Tang, C. Mascolo, M. Musolesi, G. Russo, and V. Latora. 2013. “Graph Metrics for Temporal Networks”. In Temporal Networks, 15–40. Berlin, Heidelberg: Springer.
- Perra, N., B. Gonçalves, R. Pastor-Satorras, and A. Vespignani. 2012. “Activity Driven Modeling of Time Varying Networks.” Scientific Reports 2: 469.
- Rasmussen, J., A. M. Pejtersen, and K. Schmidt. 1990. Taxonomy for Cognitive Work Analysis. Roskilde: Risø National Laboratory.
- Read, G. J., P. M. Salmon, and M. G. Lenné. 2015. “The Application of a Systems Thinking Design Toolkit to Improve Situation Awareness and Safety at Road Intersections.” Procedia Manufacturing 3: 2613–2620. doi:10.1016/j.promfg.2015.07.599.
- Reason, J. 2016. Managing the Risks of Organizational Accidents. London: Routledge.
- Salmon, P. M., G. J. M. Read, G. H. Walker, N. Goode, E. Grant, C. Dallat, T. Carden, A. Naweed, and N. A. Stanton. 2018. “STAMP Goes EAST: Integrating Systems Ergonomics Methods for the Analysis of Railway Level Crossing Safety Management.” Safety Science 110: 31–46. doi:10.1016/j.ssci.2018.02.014.
- Salmon P. M., N. A. Stanton, G. H. Walker, C. Baber, R. McMaster, D. Jenkins, A. Beond, O. Sharif, L. Rafferty, and D. Ladva. 2006, October. “Distributed Situation Awareness in Command and Control: A Case Study in the Energy Distribution Domain.” In Proceedings of the Human Factors and Ergonomics Society Annual Meeting, Vol. 50, No. 3, 260–264. Los Angeles, CA: SAGE Publications. doi:10.1177/154193120605000311.
- Salmon, P. M., N. A. Stanton, G. H. Walker, D. P. Jenkins, and L. Rafferty. 2010. “Is It Really Better to Share? Distributed Situation Awareness and Its Implications for Collaborative System Design.” Theoretical Issues in Ergonomics Science 11 (1–2): 58–83. doi:10.1080/14639220903009953.
- Salmon, P. M., Walker, G. H. M., Read, G. J., Goode N, and Stanton, N. A. 2017. “Fitting Methods to Paradigms: Are Ergonomics Methods Fit for Systems Thinking?” Ergonomics 60 (2): 194–205.
- Salmon, P., N. Stanton, G. Walker, and D. Green. 2006. “Situation Awareness Measurement: A Review of Applicability for C4i Environments.” Applied Ergonomics 37 (2): 225–238.
- Salmon, P. M., N. A. Stanton, G. H. Walker, D. Jenkins, D. Ladva, L. Rafferty, and M. Young. 2009. “Measuring Situation Awareness in Complex Systems: Comparison of Measures Study.” International Journal of Industrial Ergonomics 39 (3): 490–500. doi:10.1016/j.ergon.2008.10.010.
- Stanton, N. A., P. M. Salmon, L. A. Rafferty, G. H. Walker, C. Baber, and D. P. Jenkins. 2017. Human Factors Methods: A Practical Guide for Engineering and Design. Boca Raton: CRC Press.
- Stanton, N., C. Baber, and D. Harris. 2008. Modelling Command and Control: Event Analysis of Systemic Teamwork. Aldershot: Ashgate.
- Stanton N. A., D. P. D. Salmon, and G. H. D. Walker. 2018. Systems Thinking in Practice: Applications of the Event Analysis of Systemic Teamwork Method. Boca Raton: CRC Press.
- Stanton, N. A., A. P. Roberts, and D. T. Fay. 2017. “Up Periscope: Understanding Submarine Command and Control Teamwork during a Simulated Return to Periscope Depth.” Cognition, Technology & Work 19 (2–3): 399–417. doi:10.1007/s10111-017-0413-7.
- Stanton, N A., R. Stewart, D. Harris, R J. Houghton, C. Baber, R. McMaster, P. Salmon, G. Hoyle, G. Walker, M S. Young, M. Linsell, R. Dymott, and D. Green. 2006. “Distributed Situation Awareness in Dynamic Systems: Theoretical Development and Application of an Ergonomics Methodology.” Ergonomics 49 (12–13): 1288–1311. doi:10.1080/00140130600612762.
- Stanton, N. A., and C. Harvey. 2017. “Beyond Human Error Taxonomies in Assessment of Risk in Sociotechnical Systems: A New Paradigm with the EAST ‘Broken-Links’ Approach.” Ergonomics 60 (2): 221–233. doi:10.1080/00140139.2016.1232841.
- Stewart, R., N. A. Stanton, D. Harris, C. Baber, P. Salmon, M. Mock, K. Tatlock, L. Wells, and A. Kay. 2008. “Distributed Situation Awareness in an Airborne Warning and Control System: Application of Novel Ergonomics Methodology.” Cognition, Technology & Work 10 (3): 221–229. doi:10.1007/s10111-007-0094-8.
- Thatcher, A., R. Nayak, and P. Waterson. 2020. “Human Factors and Ergonomics Systems-Based Tools for Understanding and Addressing Global Problems of the Twenty-First Century.” Ergonomics 63 (3): 367–387.
- Tsiotas, D., and S. Polyzos. 2015. “Decomposing Multilayer Transportation Networks Using Complex Network Analysis: A Case Study for the Greek Aviation Network.” Journal of Complex Networks 3 (4): 642–670. doi:10.1093/comnet/cnv003.
- Turner, B. A., and N. F. Pidgeon. 1997. Man-made disasters (6nd Ed.). Oxford: Butterworth Heinemann.
- Underwood, P., and P. Waterson. 2014. “Systems Thinking, the Swiss Cheese Model and Accident Analysis: A Comparative Systemic Analysis of the Grayrigg Train Derailment Using the ATSB, AcciMap and STAMP Models.” Analysis and Prevention 68: 75–94. doi:10.1016/j.aap.2013.07.027.
- Walker G. H., N. A. Stanton, P. M. Salmon, and D. P. Jenkins. 2010. Command and Control: The Sociotechnical Perspective. Farnham, UK: Ashgate.
- Walker, G. H., P. M. Salmon, M. Bedinger, and N. A. Stanton. 2017. “Quantum Ergonomics: Shifting the Paradigm of the Systems Agenda.” Ergonomics 60 (2): 157–166.
- Walker, G. H., N. A. Stanton, C. Baber, L. Wells, H. Gibson, P. Salmon, and D. Jenkins. 2010. “From Ethnography to the EAST Method: A Tractable Approach for Representing Distributed Cognition in Air Traffic Control.” Ergonomics 53 (2): 184–197. doi:10.1080/00140130903171672.
- Walker, G. H., H. Gibson, N. A. Stanton, C. Baber, P. Salmon, and D. Green. 2006. “Event Analysis of Systemic Teamwork (EAST): a Novel Integration of Ergonomics Methods to Analyse C4i Activity.” Ergonomics 49 (12–13): 1345–1369. doi:10.1080/00140130600612846.
- Walker, G. H., N. A. Stanton, and P. M. Salmon. 2011. “Cognitive Compatibility of Motorcyclists and Car Drivers.” Accident; Analysis and Prevention 43 (3): 878–888. doi:10.1016/j.aap.2010.11.008.
- Walker, G. H., N. A. Stanton, C. Baber, L. Wells, H. Gibson, P. Salmon, and D. Jenkins. 2010. “From Ethnography to the EAST Method: A Tractable Approach for Representing Distributed Cognition in Air Traffic Control.” Ergonomics 53 (2): 184–197. doi:10.1080/00140130903171672.
- Wang, Z., S. Zeng, J. Guo, and H. Che. 2021. “A Bayesian Network for Reliability Assessment of Man-Machine Phased-Mission System considering the Phase Dependencies of Human Cognitive Error.” Reliability Engineering & System Safety 207: 107385. doi:10.1016/j.ress.2020.107385.
- Waterson, P., M. M. Robertson, N. J. Cooke, L. Militello, E. Roth, and N. A. Stanton. 2015. “Defining the Methodological Challenges and Opportunities for an Effective Science of Sociotechnical Systems and Safety.” Ergonomics 58 (4): 565–599.
- Weick, K. E, and K. M. Sutcliffe. 2011. Managing the Unexpected: Resilient Performance in an Age of Uncertainty (Vol. 8). Hoboken: John Wiley & Sons.
- Williams, M. J., and M. Musolesi. 2016. “Spatio-Temporal Networks: Reachability, Centrality and Robustness.” Royal Society Open Science 3 (6): 160196.