
Abstract
The role of the physical workspace in employee mental health is often overlooked. As a (mentally) healthy workforce is vital for an organisation’s success, it is important to optimise office workspace conditions. Previous studies on the effects of the physical workspace on mental health tended to focus on the effects of a specific element of the physical workspace on one or only a few mental health indicators. This study takes a more holistic approach by addressing the relationship of physical workspace characteristics with ten broad indicators of work-related mental health. Results of a systematic review of empirical evidence show that many aspects of (day)light, office layout/design, and temperature and thermal comfort have been proven to be related to many mental health indicators. Less tacit workspace characteristics (e.g., noise, use of colours) have been explored too, but so far have only been related to a few mental health indicators.
Practitioner summary: The absence of holistic insights regarding the empirical proof of the effects of workspace design on employee mental health prevents a clear business case for workplace investments. This paper presents a content analysis of existing studies and shows how seven elements of workspace design relate to 10 mental health indicators.
1. Introduction
Due to the growing number of people experiencing burnout-related mental health issues from stressors, such as work pressure (CBS Citation2020; TNO Citation2019), there is an increasing societal interest in mental health in the work environment (Hanc, McAndrew, and Ucci Citation2019). A large share of employers acknowledges the value of their employees’ mental health. Approximately 40% of these employers also take precautions for dealing with mental health-related issues (e.g., coaching, health-checks, yoga classes) (Pas, Busch, and Proper Citation2014). However, one of the potential contributors to health, the physical workspace (Chadburn, Smith, and Milan Citation2017; Cobaleda Cordero, Babapour, and Karlsson Citation2019; Thatcher and Milner Citation2014), is not considered very often. In the past, corporate real estate strategies and investments were often solely based on short-term cost reductions and efficiency (Lindholm and Leväinen Citation2006; Singer, Bossink, and Vande Putte Citation2007), ‘Business cases are constructed to outline the rationale and justification for a change, secure support and resources from leadership, and provide understanding about how a change in practice will yield an economic return on investment.’ (Linton et al. Citation2019, p. 2). For mental health outcomes of an improved physical workspace, such a business case remains unclear.
Apart from official mental disorders, mental health is a much broader concept regarding a person’s entire functioning (Harvard Health Publishing Citation2008; WHO Citation2004). The field of positive health refers to it as ‘a state of well-being that goes beyond the mere absence of disease or illness’ (Seligman Citation2008 p. 3). So, besides pathogenic work-related mental health issues, such as stress, sleep quality, mood, fatigue, or a general lack of well-being, and diagnosable mental disorders, such as depression and burnout, this WHO definition suggests that salutogenic indicators should be included as well for a holistic approach to mental health and well-being at work. Studies with a salutogenic approach have hinted for example at self-assessed productivity (Bringsén et al. Citation2012) and concentration (Ruohomäki et al. Citation2015). In addition, engagement has been put forward as the positive opposite of burnout on a continuum (Leiter and Maslach Citation2016). Based on such a broader approach to mental health at work, Bergefurt et al. (Citation2022) used these ten indicators (in italics above) to identify 133 studies on mental health outcomes related to the physical office workspace in their scoping review. They concluded that research on relationships between physical workspace characteristics and these ten potential mental health indicators, tends to focus on the effects of a specific element of the physical workspace on one or only a few mental health indicators; an overview of findings is missing.
Increased mental health in the workplace will not only result in lower absenteeism rates and decreased healthcare costs (Cooper and Dewe Citation2008; Muldavin, Miers, and McMackin Citation2017), but also has the potential to affect other important business key performance indicators. For example, pleasant and comfortable settings increase cognitive capacity by reducing feelings of stress and pressure and improving an individual’s mood (Isen Citation2001). Such increased cognitive capacity allows employees to quickly adapt to new situations and switch between tasks more easily, enhancing flexibility (Miner and Glomb Citation2010). Also, as indicated by Isen (Citation2001), more positive emotions and a better mood provide individuals with more cognitive space to generate new ideas and support creativity, improving an employee’s innovativeness. Furthermore, improvements in employee productivity and concentration and reductions in employee stress levels are expected to increase organisational performance too (Baird Citation2017; Obuobisa‐Darko Citation2020; van der Voordt Citation2016) and, in turn, may lead to higher levels of customer satisfaction (Amaratunga and Baldry Citation2003; Taris Citation2006). So, the value of employee mental health for a business case on organisational performance is clear. But what about the value of workspace design investments to improve employee mental health?
1.1. Aims and objectives
One of the main reasons that withhold an organisation from investing in the physical workspace to support employees’ mental health is the absence of insights into the effectiveness of such investments (Pas, Busch, and Proper Citation2014). Because of the specialised and focussed approach in existing studies on physical workspace and mental health (e.g. Appel-Meulenbroek, Clippard, and Pfnür Citation2018; Riba Sagar, Parikh, and Greden Editors Citation2019; Watson Citation2018), a holistic overview of the empirically demonstrated relationships between the two is currently missing. While Bergefurt et al. (Citation2022) have identified existing empirical evidence, they only analysed these 133 studies on the theories, measures, and indicators that were used. They did not, however, analyse their content to identify empirically demonstrated effects of space on mental health. Therefore, the aim of the current paper is to create an overview of the potential effects of the physical office workspace on these ten mental health indicators. It does so by analysing the 133 papers that were already systematically selected by Bergefurt et al. (Citation2022) on the gathered proof for implementing changes in each separate physical workspace element. Other systematic reviews that have been published on healthy workspaces identified far less studies (Forooraghi et al. Citation2020; Colenberg et al. Citation2021, respectively, reviewed 18 and 50 papers), as they used general search terms, such as ‘office’ or ‘workspace design’ thereby overlooking more detailed studies on, for example, noise or light. Jensen and Van der Voordt (Citation2019) did include such search terms, but only reviewed works in four journals, thus also missing out on a lot of the empirical evidence.
The present study, therefore, fills an important research gap by analysing the systematically collected 133 papers in such a way that an overview can be provided of how different quality levels of physical workspace characteristics have been proven to affect different mental health indicators. Such an overview can be used to support healthy office business case development and to identify gaps for future research.
2. Methods
Bergefurt et al. (Citation2022) used PRISMA guidelines to select these 133 papers from an initial database of 3695 papers, based on several eligibility criteria. Detailed information about the selection procedure can be found in Bergefurt et al. (Citation2022). The current study adds a content analysis of the same articles. Data was extracted from each paper on general paper information (e.g. author, year, journal), the research design, time horizon, and methods, number of buildings in the study, layout of the office(s), physical workplace characteristics, mental health indicators, and the direction and significance of relationships between physical workspace characteristics and mental health indicators.
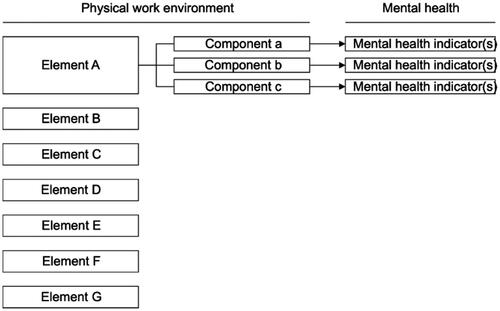
Next, the elements of the physical workspace (e.g. Temperature and Thermal Comfort) and their components [e.g., room temperature (°C) and relative humidity (%)] that were empirically tested (see ), were extracted from each study. Per element, relationships of the associated components with the ten mental health indicators are gathered (positive, negative, curvilinear, no effect). Various studies also reported percentages for possible effect sizes that were measured (e.g., 3% increase in productivity). Last, the design quality levels of the different components were allocated to three categories (insufficient, sufficient, and optimal) based on the empirical findings in the papers that indicated thresholds for component values that positively or negatively affected mental health indicators. These three categories allow to identify optimisation possibilities and their potential for a positive business case based on mental health outcomes. As this study is a review of literature, no ethical approval was necessary.
Figure 1. Division of physical workspace elements and components related to mental health indicators.
3. Results
The offices studied in the papers regarded open plan offices (n = 64 studies), cellular offices (n = 39), shared offices (n = 20), combi offices (n = 4), and activity-based offices (n = 14). Overall, 97% of the studies used a survey, with 50% using a longitudinal approach (with one pre-test and at least two post-tests). Several studies combined the use of a survey with a field experiment, as field experiments were used in 30% of the papers. Sample sizes ranged from 7 to 25,947 respondents, with an average of 887 (SD = 2832) and from 1 to 191 different office buildings (M = 11, SD = 25).
The journals that the papers were published in (see Supplementary Material) give some indication of the research fields. On the hand, there were 17 journals that could be said to stem from the field of building sciences (with 49 studies) and six journals (with 29 studies) from the field of ergonomics, facilities, and real estate. Regarding mental health, many of these studies focussed on the salutogenic indicators of productivity and concentration. The building's science journals appear more focussed on indoor environmental qualities (IEQ: temperature, air, lighting, and noise), whereas the ergonomics, facilities, and real estate journals additional include office layout and design. On the other hand, there were many journals included with the main focus on people instead of the spaces, from the field of medicine and health (12 journals with 21 studies) and psychology and behaviour (four journals with 17 studies). These studies seem a bit more focussed on pathogenic indicators, especially stress. Regarding workspaces, again the IEQ elements are studied most here. Five journals (with six studies) are nature focussed, mainly on relating biophilia to stress. Eight journals (with 11 studies) were hard to assign to a specific field.
3.1. Office layout and office design
The workspace element ‘office layout and office design’ considers components related to the physical and functional settings of the workspace as well as its design (Al Horr et al. Citation2016). Its ten components (see ) are shown to have significant relationships with most mental health indicators, but not (yet) with mood, depression, or fatigue. All components have been related to perceived productivity, and most to stress and well-being as well. Contrary to most other workspace elements, measured changes in mental health have not yet been indicated in percentages. In general, mostly perceptive measures of satisfaction are used to measure the layout, but five studies included an objective metric (e.g., workspace size).
Table 1. Office layout and design and mental health indicators.
Regarding office type (related to five mental health indicators), three main categories are distinguished: private offices, group offices, and open plan offices. The private office relates most positively—in comparison to the open plan office—to well-being and sleep quality (Bodin Danielsson and Bodin Citation2008), productivity, concentration, and reduced stress levels (Di Blasio et al. Citation2019; Haapakangas, Hallman, et al. Citation2018; Lindberg et al. Citation2018; Seddigh et al. Citation2014; Wiik Citation2011). The strength of the relationships of group office with these mental health indicators lies in between those of the two other office types. Besides office layout design, flexible use of individual workspaces relates more positively to productivity (Candido, Chakraborty, and Tjondronegoro Citation2019; Haapakangas, Hallman, et al. Citation2018; Haynes, Suckley, and Nunnington Citation2017; Kim et al. Citation2016) and stress levels (MacHe, Servaty, and Harth Citation2020) than dedicated seating.
In addition to the office layout in its entirety, the availability of concentration spaces and breakout rooms also relates to higher productivity (Di Blasio et al. Citation2019; Haynes, Suckley, and Nunnington Citation2017; Kim et al. Citation2016; Rasheed, Khoshbakht, and Baird Citation2019; Wiik Citation2011), better concentration, less stress (Haapakangas, Hongisto, et al. Citation2018; Seddigh et al. Citation2014) and higher overall well-being (Davis, Leach, and Clegg Citation2020). Similarly, vitality zones and active elements (e.g., exercise balls, standing desks, table tennis tables, lounge chairs, etc.) reduce stress and burnout-related symptoms (Coffeng et al. Citation2014; Engelen et al. Citation2017). Engelen et al. (Citation2017) also reported an increase in sleep quality, productivity, and engagement for such components. On top of that, people in workspaces with easy access to facilities that support them in their everyday tasks perceive higher productivity (Groen et al. Citation2019). Candido et al. (Citation2019) and Haynes, Suckley, and Nunnington (Citation2017) call for a clear separation of refreshment areas from workspaces as these areas cause distractions that negatively affect employee productivity and concentration.
The number of occupants and how they are spread over the office are also relevant layout components. In general, a larger number of occupants has adverse effects on productivity and well-being (Bodin Danielsson and Bodin Citation2008; Herbig, Schneider, and Nowak Citation2016). Di Blasio et al. (Citation2019) and Rasheed, Khoshbakht, and Baird (Citation2019) suggested a division of workspaces in clusters of 2–5 employees with acoustic and visual separations between the different clusters to enhance engagement and productivity. Clusters of 6–20 employees are found to negatively affect productivity and result in more difficulties in concentrating on tasks and increases in stress as well as decreased well-being (Di Blasio et al. Citation2019; Seddigh et al. Citation2014). Open office spaces that accommodate over 20 employees have the most negative effects on these mental health indicators (Di Blasio et al. Citation2019; Rasheed, Khoshbakht, and Baird Citation2019).
Last, the implementation of decorative elements (art, natural elements, furniture, colours, photos, etc.) also positively relates to employee well-being (Cobaleda Cordero, Babapour, and Karlsson Citation2019; Wiik Citation2011) and productivity (Candido et al. Citation2019; Fassoulis and Alexopoulos Citation2015). In addition, the freedom to adjust the workspace to personal preferences (e.g., furniture, decoration) relates to higher workspace satisfaction and increased productivity (Candido, Chakraborty, and Tjondronegoro Citation2019; Fassoulis and Alexopoulos Citation2015).
3.2. Look, feel, and color
The element Look, feel and colour of the workspace refers to aesthetic components as well as textures and colours (Al Horr et al. Citation2016). So far, it seems that only room colour has been studied in relation to mental health, without percentual indications of such effects (see ). Room colour is associated with productivity (Kwallek et al. Citation1997; Kwallek, Soon, and Lewis Citation2007; Poursafar, Rodrigues, and Sriram Citation2019), mood (Kwallek et al. Citation1997; Tonello Citation2004), and stress (Hsiao, Hsiao, and Wang Citation2013; Lee et al. Citation2018). Despite minor differences between personality types, predominantly white and blue colours are found to have the most positive effects (Poursafar, Rodrigues, and Sriram Citation2019). Both objective measures (e.g., colour intensity and saturation) and subjective measures have been used, but the objective ones were only included in two studies.
Table 2. Look, feel, and color and mental health indicators.
3.3. Biophilia, greenery, views, and plants
Regarding natural elements of the workspace, four components of plants and outside views have been studied (see ). Hähn, Essah, and Blanusa (Citation2021) showed that a small number of plants (1–3) per employee or desk is most beneficial for productivity, concentration, and stress, in line with earlier studies (e.g., Smith and Pitt Citation2009). A higher number of plants (>3) might be perceived as chaotic or busy, and reduces feelings of comfort in the workspace, which negatively relates to productivity and stress, although to a lesser extent than having no plants at all. In comparison to workspaces without indoor vegetation, the implementation of 1–3 plants per desk or employee is expected to result in increased productivity (3–15%), concentration (10–20%) (Hähn, Essah, and Blanusa Citation2021; Nieuwenhuis et al. Citation2014; Smith and Pitt Citation2009) and a reduction in stress symptoms (4–8%) (Bjornstad, Patil, and Raanaas Citation2015; Gray and Birrell Citation2014; Smith and Pitt Citation2009; Toyoda et al. Citation2020). Furthermore, the implementation of indoor vegetation relates to increased well-being (Thomsen, Sønderstrup-Andersen, and Müller Citation2011) and slight reductions in depression rates (Kim et al. Citation2011). Plants should be placed in the direct office environment for improvements in productivity and concentration; not just in breakout rooms and refreshment areas (Hähn, Essah, and Blanusa Citation2021). On the other hand, removing plants from the latter spaces leads to an increase in stress symptoms among employees.
Table 3. Biophilia, greenery, views, and plants and mental health indicators.
Regarding views, workspaces where employees can look outside, are related to better sleep quality, better mood, and higher ratings of overall well-being (Dreyer et al. Citation2018; Newsham et al. Citation2013). According to Meir et al. (Citation2019), pleasant views (e.g., of nature) increase productivity and reduce feelings of fatigue. Shin (2007) observed a 4% reduction in stress symptoms after employees moved towards windows that offered forest views. The studies on plants mostly used quantitative metrics (8 studies), but the studies on views were all using subjective quality assessments.
3.4. Temperature and thermal comfort
Also for this workspace element four components are identified, including temperature, humidity, personal control, and satisfaction (see ). Studies on optimal workspace temperatures vary between 18 and 25 °C (Kim et al. Citation2018; Park and Gotoh Citation1993; Valančius and Jurelionis Citation2013), based on seasonal and topographical differences. Generally speaking, temperatures within the range of 20–24 °C are considered optimal (Kekäläinen et al. Citation2010; Newsham et al. Citation2013; Wiik Citation2011), with adjustments of one or two degrees depending on the type of season and location-specific climate (Fassoulis and Alexopoulos Citation2015). Office environments that deviate from this bandwidth, particularly in terms of higher room temperatures negatively affect productivity and concentration (Kekäläinen et al. Citation2010; Menzies et al. Citation1997; Reynolds et al. Citation2001; Valančius and Jurelionis Citation2013), stress (Kim et al. Citation2018), fatigue (Kekäläinen et al. Citation2010; Menzies et al. Citation1997; Reynolds et al. Citation2001), sleep quality and mood (Newsham et al. Citation2013), and well-being (Wiik Citation2011). Generally, improvements of over 20% are measured when these components were optimised.
Table 4. Temperature and thermal comfort and mental health indicators.
The relative humidity is considered optimal between 40 and 55% (Bourbeau, Brisson, and Allaire Citation1997; Razjouyan et al. Citation2020; Wiik Citation2011), again with possible seasonal and geographical adjustments (Fassoulis and Alexopoulos Citation2015; Park and Gotoh Citation1993). Values below or above this range are associated with decreased productivity (Candido, Chakraborty, and Tjondronegoro Citation2019; Wiik Citation2011), difficulties concentrating on tasks (Mendell et al. Citation2008; Menzies et al. Citation1997), increased stress levels up to 22% (Razjouyan et al. Citation2020), poor sleep quality (Newsham et al. Citation2013; Razjouyan et al. Citation2020), negative mood (Newsham et al. Citation2013) and higher fatigue (Bourbeau, Brisson, and Allaire Citation1997; Mendell et al. Citation2008).
More specifically, Gupta, Howard, and Zahiri (Citation2020a, Citation2020b) note that high levels of satisfaction with thermal comfort could improve productivity. A widely used scale to measure satisfaction with the thermal climate is the Predicted Percentage Dissatisfied (PPD) rate, which indicates the percentage of dissatisfied employees. According to EN ISO 7730, this value should optimally be below 6% with an acceptable upper limit of 15% (Valančius and Jurelionis Citation2013). In addition, in comparison to offices without personal control, employees in offices with individually controllable thermal conditions are on average up to 85% more satisfied with the thermal comfort, which enhances employee productivity (D’Oca et al. Citation2018). Many studies (n = 24) used objective measures to identify either temperature and/or relative humidity, although also 24 studies only used subjective measures of comfort and satisfaction.
3.5. Noise, acoustics, and privacy
Literature on noise, acoustics, and privacy distinguishes four components of noise disturbance, that is mainly related to fatigue, concentration, and productivity (see ). In accordance with ISO 3382-3 standards, background noise levels should not exceed 48 dB (Haapakangas, Hallman, et al. Citation2018; Kaarlela-Tuomaala et al. Citation2009; Lou and Ou Citation2019; Seddigh et al. Citation2015). Moreover, Wiik (Citation2011) advised to set a limit of 35 dB for quiet areas intended for cognitively demanding tasks. Workspaces exceeding these standards are expected to negatively affect mental health, specifically regarding productivity (Di Blasio et al. Citation2019; Fassoulis and Alexopoulos Citation2015; Wiik Citation2011), concentration (Di Blasio et al. Citation2019; Reynolds et al. Citation2001; Roskams et al. Citation2019; Seddigh et al. Citation2015), stress (Leather, Beale, and Sullivan Citation2003; Seddigh et al. Citation2015), fatigue (Kaarlela-Tuomaala et al. Citation2009; Park and Gotoh Citation1993; Perrin Jegen and Chevret Citation2017; Reynolds et al. Citation2001), and depression (Zhang, Kang, and Jiao Citation2012). In addition, low-frequency noise (below 20 Hz, mostly caused by climate systems or office equipment; Tesarz et al. Citation1997) results in difficulties concentrating and increased levels of fatigue for those sensitive to it (Burt Citation1996; Tesarz et al. Citation1997). Higher general satisfaction with acoustics also positively affects productivity (Chadburn, Smith, and Milan Citation2017; Lou and Ou Citation2019; Wiik Citation2011).
Table 5. Noise, acoustics, and privacy and mental health indicators.
Besides noise, speech privacy—the (in)ability to listen to conversations of co-workers—correlates with concentration, productivity, and well-being as well (Candido, Chakraborty, and Tjondronegoro Citation2019; Fassoulis and Alexopoulos Citation2015; Haapakangas, Hongisto, et al. Citation2018). In total, 15 studies included objective and subjective measurements, 4 only objective ones (e.g. sound levels), and 30 studies only measured subjective perceptions.
3.6. Indoor air quality and ventilation
Research on the air quality and ventilation element distinguishes six components, which again are mainly related to fatigue, concentration, and productivity (see ). ASHRAE standards for CO2 (1000 ppm) are considered as a baseline and upper acceptable limit (Haghighat and Donnini Citation1993; Wiik Citation2011). Increased levels lead to a loss in productivity of 4–12% for concentrations between 1000 and 1400 ppm and 14–24% for concentrations >1400 ppm, compared to the 1000 ppm baseline scenario (Gupta, Howard, and Zahiri Citation2020a, Citation2020b). In addition, Lu et al. (Citation2015) reported a 16% increase in fatigue and a slight decrease in the ability to concentrate per 100 ppm increase in CO2. Through higher blood pressure, increased stress levels have been measured as well (Kim et al. Citation2018). Similar to CO2 levels, ASHRAE standards are used to study the effects of changes in formaldehyde (limit: 100 μg/m3) and total volatile organic compounds (TVOC) concentrations (Candido et al. Citation2019; Hedge, Erickson, and Rubin Citation1996; Lou and Ou Citation2019; Lu et al. Citation2015). For every 100 ppm increase in TVOC concentrations, fatigue increased by 2% (Lu et al. Citation2015). Similarly, fatigue increases with higher concentrations of formaldehyde (Hedge, Erickson, and Rubin Citation1996; Kim et al. Citation2011).
Table 6. Indoor air quality and ventilation and mental health indicators.
Besides measuring air components, a ventilation rate of at least 8 L/s/person is found to be both optimal in terms of productivity and satisfaction (Candido, Chakraborty, and Tjondronegoro Citation2019; Fassoulis and Alexopoulos Citation2015; Meir et al. Citation2019). According to Meir et al. (Citation2019), productivity increases by 1.7% for each 2-fold increase in ventilation rate when increasing from 1 to 8 L/s/person. The suboptimal air supply is also related to higher levels of fatigue (Bourbeau, Brisson, and Allaire Citation1997; Meir et al. Citation2019) and difficulties concentrating (Meir et al. Citation2019). Similar to thermal conditions, individually controllable ventilation systems show positive relations with mental health, with up to 15% higher productivity levels (Menzies et al. Citation1997), less fatigue, and a higher ability to concentrate (Haghighat and Donnini Citation1999; Menzies et al. Citation1997). Overall satisfaction with the indoor air quality appears positively related to improved sleep quality and a more positive mood (Newsham et al. Citation2013) as well, in addition to the already mentioned mental health indicators. A 12% decrease in productivity is observed when air is rated ‘stuffy’ instead of ‘fresh’ (Gupta, Howard, and Zahiri Citation2020a, Citation2020b). The perceived freshness of air also affects concentration and fatigue (Haghighat and Donnini Citation1999; Hedge, Erickson, and Rubin Citation1996; Reijula and Sundman-Digert Citation2004). Besides such subjective perceptions of the air quality, 25 studies also included objective metrics (e.g., CO2 levels, air speed).
3.7. Light and daylight
The workspace elements light and daylight focus on both artificial and natural lighting conditions in the workspace with nine different components (see ). Light exposure is a key component in an individual’s health as it is the main influencer of circadian rhythm (Aries, Beute, and Fischl Citation2020; Figueiro et al. Citation2019). Disruptions in this biological rhythm due to insufficient light exposure are associated with 30% poorer sleep quality and increased fatigue (Figueiro et al. Citation2019; Zhang et al. Citation2020), negative mood (Figueiro et al. Citation2019), and reduced productivity and concentration (Aries, Beute, and Fischl Citation2020; Figueiro et al. Citation2019). Furthermore, increased scores on circadian stimulus with daylight led to 5–10% stress reductions (Figueiro et al. Citation2017), increased well-being (Borisuit et al. Citation2015; Boubekri et al. Citation2014; Cobaleda Cordero, Babapour, and Karlsson Citation2019) and a 20% reduction in feelings of depression (Figueiro et al. Citation2017). Employees prefer exposure to daylight over artificial light (Borisuit et al. Citation2015; Day et al. Citation2019; Maierova et al. Citation2016), indicating a general preference for daylight in the workspace. It can be expected though that not all workspaces can be spaced within the proximity of windows which results in insufficient daylight exposure. For such workspaces, skylights appear a suitable solution as opposed to conventional electric lighting to improve mood by 10% and decrease stress levels (Canazei et al. Citation2017). A negative effect of direct daylight exposure is the occurrence of glare, which reduces visual comfort and therewith negatively affects mood (Borisuit et al. Citation2015), fatigue, and productivity (Aries, Veitch, and Newsham Citation2010; Fostervold and Nersveen Citation2008). To avoid glare, it is advised to reduce direct sunlight penetration by applying shading to the windows (Boubekri et al. Citation2020). Choi et al. (Citation2019) report an increase in productivity (21.7%), the ability to concentrate (12.7%), mood (25.3%), and a decrease in fatigue (29.4%) after implementation of dynamic glass instead of conventional manual shading (blinds). Additionally, to avoid glare, it is recommended to implement a lighting design that uses both direct and indirect lighting as these lighting systems are also found to positively affect employee well-being (Fostervold and Nersveen Citation2008).
Table 7. Light and daylight and mental health indicators.
Besides daylight, artificial light variations are studied, such as colour and illuminance. High correlated colour temperature (CCT) levels (>6500 K) refer to blue-white, bright, and cool colours and lower levels (<3000 K) to lower light levels and warmer yellow colours (Zhu et al. Citation2019). Studies found a 19.4% increase in productivity, 36.8% increase in concentration, and 26.9% decrease in feelings of fatigue after increasing CCT values from 2900 to 17,000 K (Mills, Tomkins, and Schlangen Citation2007). Furthermore, high levels of CCT lead to improved sleep quality and mood (Borisuit et al. Citation2015; Maierova et al. Citation2016; Partonen and Lönnqvist Citation2000; Tonello et al. Citation2019; Viola et al. Citation2008), reduced stress levels (Maierova et al. Citation2016; Tonello et al. Citation2019) and reduced feelings of depression (Partonen and Lönnqvist Citation2000) compared to dim light environments (<3000 K). Higher workspace illuminance levels (in lux) improve sleep quality (Boubekri et al. Citation2020; Kozaki et al. Citation2012), mood (Aries, Beute, and Fischl Citation2020; Tonello Citation2004; Zhu et al. Citation2019), fatigue (van Duijnhoven et al. Citation2018; Zhu et al. Citation2019) and productivity (Boubekri et al. Citation2020; Candido, Chakraborty, and Tjondronegoro Citation2019; Newsham et al. Citation2005). Standards on illuminance levels differ per country and range between 300 and 500 lx for the lowest acceptable limits (Zhang et al. Citation2020). However, illuminance levels of 500 lx are not fully optimal, as various studies show more positive results for even higher illuminance levels. Regarding sleep quality, Kozaki et al. (Citation2012) indicate that, compared to 500 lx, sleep quality increases with levels of 750 lx. Positive effects of illuminance levels on productivity also do not occur until 750 lx (Boubekri et al. Citation2020; Candido, Chakraborty, and Tjondronegoro Citation2019; Newsham et al. Citation2005). In terms of mood, it is even found that illuminance levels of 800–1200 lx are associated with more positive moods compared to 200–500 lx conditions (Aries, Beute, and Fischl Citation2020; Tonello Citation2004; Zhu et al. Citation2019).
Last, the ability to individually control lighting conditions relates to mood (Newsham et al. Citation2005; Veitch and Newsham Citation2000) and well-being (Veitch et al. Citation2008; Veitch and Newsham Citation2000). It should be noted that, as indicated by Day et al. (Citation2019), the ability to control workspace lighting appears to be more important than actually having to adjust the lighting. Furthermore, the positive effects of this aspect were only significant for situations where lighting conditions are not satisfactory (Veitch and Newsham Citation2000), indicating that personal control is only beneficial when workspace lighting conditions are rated insufficient. Moreover, personal control over the lighting conditions is the main predictor of overall satisfaction with workspace lighting (Day et al. Citation2019; Newsham et al. Citation2005, Citation2013; Veitch, Stokkermans, and Newsham Citation2013; Veitch and Newsham Citation2000), which positively correlates with employee productivity (Day et al. Citation2019; Lou and Ou Citation2019) mood (Veitch et al. Citation2008, Veitch, Stokkermans, and Newsham Citation2013), well-being (Veitch et al. Citation2008) and engagement (Veitch, Stokkermans, and Newsham Citation2013). Lighting research is a well-developed discipline, which is also reflected in the metrics that are used; 42 studies used at least some objective metrics (e.g. luminance, CCT) vs. 33 studies that were purely focussed on subjective metrics.
4. Discussion, implications, and limitations
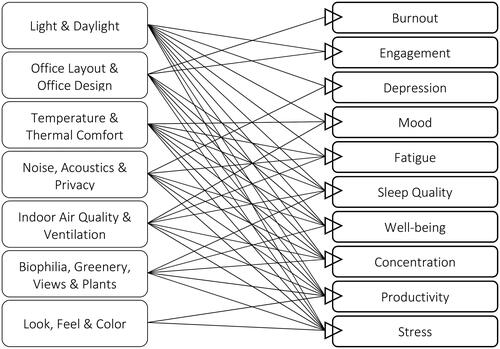
The aim of this paper was to provide a holistic overview of the proven effects of office workspace design on mental health indicators. The 133 scientific studies that are analysed in this paper, differ in location, sample size, and office and organisation type, resulting in a broad selection of workspaces under study. This study is the first in providing such an overview with a pathogenic and salutogenic set of mental health indicators. Its results show that ‘the physical workspace’ relates to all mental health indicators with at least one of the seven physical workspace elements (see ). also makes clear that none of the physical workspace elements have empirically demonstrated relationships with all ten mental health indicators, although (day)light has been related to all except burnout. The detailed tables in the results section show that some workspace elements are related to mental health through different components (e.g., office layout/design, 10 components; (day)light, 9 components), while others seem to have more straightforward relations (e.g., look, feel, and colour, 1 component). This might indicate that the relationships of these latter physical workspace elements are either less complex or that there might just be a lack of research attention for these relationships so far. For example, office lighting has been a field of study for much longer than biophilia or interior design; especially in relation to employee (mental) health.
Figure 2. Overview empirical relationships.
4.1. Implications for research and practice
Especially stress, productivity, and concentration have been proven to relate to the physical workspace in various ways and could thus be taken up in a workspace design intervention business case. Employee productivity research dominates this set of papers on mental health and workplace design, just like organisational outcome measurement is often driven by performance. It still seems to be the holy grail of workplace research and the most sought-after approach to support a business case for investing in the office environment. This is despite the fact that it is hard to measure the individual productivity of knowledge workers and there are no existing validated scales to do so. Future research should focus on the measurement of productivity first, or at least prove that perceived productivity correlates strongly with objective measurements, before using it as a dependent variable. Stress on the other hand is one of the most often reported mental health-related problems in the workplace (Cartwright and Cooper Citation1997; Teasdale Citation2006) and can be assessed with a variety of validated measures. Attention for stress in physical workspace design studies (e.g. Vischer and Wifi Citation2017) and in the workspace management practice has been increasing too. Given the evidence found in this review for a variety of relationships between stress and productivity with elements of the physical workspace, a design intervention would have much potential to increase mental health indicators. Together with fatigue, studies on these indicators have also more often been able to provide percentages of improvements (although there are still differences between studies), which is in line with the often-quantitative approach of business cases in practice. In comparison, very few studies are available on burnout, engagement, and depression in relation to the physical workspace, and so far only links with light, layout, and acoustics have been shown. Therefore, the extent to which these mental health indicators are affected by the physical workspace is still less clear and more research is needed.
Especially improvements in (day)light, layout design, and thermal comfort have been shown to contribute to many different mental health indicators. Previously, Wiik (Citation2011) already found that satisfaction with these workspace elements results in higher levels of productivity. The current study adds that these workspace elements may have an impact beyond mere productivity on a large amount of mental health indicators. Another contribution of this study to the existing literature, are the three identified value categories for each workspace component that can be used to support (identification of) improvement potential in existing buildings and future building designs. These insights can be used by workplace managers to understand how office design could be optimised to improve employees’ mental health. In more traditional IEQ fields, such findings are already incorporated in standards (ISO, ASHRAE on noise, lighting, air, etc.), but for the spatial design and more decorative elements, this is not yet the case. This study can provide valuable input to create such standards. So, as a roadmap for future research, we suggest to first create validated scales to measure some of the ten mental health indicators that currently lack this. Perhaps some of them are so highly intercorrelated, that one general mental health scale could be developed. Next, the relationships in that are not yet present (or only studied a few times) deserve more research attention. In addition, a critical shortcoming of many studies is that they do not map the actual physical space in much detail (in terms of e.g., configuration, how it is used, etc.). This makes it difficult to discover with review studies like this one, whether certain effects might be limited to certain contexts. So, future studies must include more objective descriptions of the research context as well. Barriers to perform such studies are, amongst others, the increasing reluctance of office organisations (and their workers) to participate in extensive surveys, and the tightening of ethical and data protection regulations in universities, especially regarding studies on people’s (mental) health.
4.2. Limitations
The current study has some limitations. First, the magnitudes of effects presented in this study are subject to subjective (e.g., personal preferences) and situational (e.g., local climate) factors and, thus, cannot be fully generalised. Effects can differ per person, for example, effects of light colour temperatures vary due to an individual’s sensitivity to (bright) light (Maierova et al. Citation2016; Tonello et al. Citation2019), and also room colour perception is based on stimulus screening ability (e.g., the ability to block or neglect irrelevant aspects of the environment (Kwallek, Soon, and Lewis Citation2007). On top of that, some effects are expected to decrease over time as a result of familiarity and adapting to the workspace (Kwallek, Soon, and Lewis Citation2007). For some workspace elements, these individual differences are more pronounced than for others, so further research on the working of each workspace element’s mechanism is warranted.
The optimal levels of all the workspace components should also be interpreted with care because of possible interrelations between components and even between elements, which this review has not incorporated. For example, CCT of artificial light can be dominant over daylight exposure (Mills, Tomkins, and Schlangen Citation2007; Zhang et al. Citation2020), light can influence how office temperatures are perceived (Kompier et al. Citation2020), and office layout obviously relates to perceived noise and acoustics (Lee Citation2010). Moreover, current workspace quality levels could become outdated over time due to new research findings or the introduction of new technologies and should thus frequently be re-evaluated. Last, implementation costs of workspace interventions fell beyond the scope of this study but are essential to support decision-making regarding the prioritisation of interventions when optimising the physical workspace.
Since this study is the first in providing a detailed, holistic overview of physical workspace interventions in relation to mental health, its outcomes should be (cross)validated. Case studies are needed in which the identified workspace components are jointly monitored in combination with mental health measurements. Additionally, besides the physical workspace, mental health is also affected by for example organisational culture and leadership within an organisation (Adler et al. Citation2014; Garcia et al. Citation2017). It is therefore important to gain insights into the extent to which mental health can be improved by interventions in the physical workspace in comparison to interventions targeting psychosocial work factors. It would also be valuable for future research to conduct a similar analysis as the one presented in this study, but with a focus on the mental health—organisational performance relationship and combine these findings to substantiate the potential of physical workspace interventions for organisational effectiveness. Hopefully, this will eventually result in a perception of physical workspace interventions as a valuable investment rather than an expense.
Supplemental Material
Download Zip (702.3 KB)Disclosure statement
No potential conflict of interest was reported by the author(s).
References
- Adler, A.B., K.N. Saboe, J. Anderson, M.L. Sipos, and J.L. Thomas. 2014. “Behavioral Health Leadership: new Directions in Occupational Mental Health.” Current Psychiatry Reports 16 (10): 484–487. doi:10.1007/s11920-014-0484-6.
- Al Horr, Y., M. Arif, A. Kaushik, A. Mazroei, M. Katafygiotou, and E. Elsarrag. 2016. “Occupant Productivity and Office Indoor Environment Quality: A Review of the Literature.” Building and Environment 105: 369–389. doi:10.1016/j.buildenv.2016.06.001.
- Amaratunga, D., and D. Baldry. 2003. “A Conceptual Framework to Measure Facilities Management Performance.” Property Management 21 (2): 171–189. doi:10.1108/02637470310478909.
- Appel-Meulenbroek, R., M. Clippard, and A. Pfnür. 2018. “The Effectiveness of Physical Office Environments for Employee Outcomes: An Interdisciplinary Perspective of Research Efforts.” Journal of Corporate Real Estate 20 (1): 56–80. doi:10.1108/JCRE-04-2017-0012.
- Aries, M.B.C., F. Beute, and G. Fischl. 2020. “Assessment Protocol and Effects of Two Dynamic Light Patterns on Human Well-Being and Performance in a Simulated and Operational Office Environment.” Journal of Environmental Psychology 69: 101409. doi:10.1016/j.jenvp.2020.101409.
- Aries, M.B.C., J.A. Veitch, and G.R. Newsham. 2010. “Windows, View, and Office Characteristics Predict Physical and Psychological Discomfort.” Journal of Environmental Psychology 30 (4): 533–541. doi:10.1016/j.jenvp.2009.12.004.
- Baird, K. 2017. “The Effectiveness of Strategic Performance Measurement Systems.” International Journal of Productivity and Performance Management 66 (1): 3–21. doi:10.1108/IJPPM-06-2014-0086.
- Bergefurt, L., M. Weijs-Perrée, R. Appel-Meulenbroek, and T. Arentze. 2022. “The Physical Office Workplace as a Resource for Mental Health – A Systematic Scoping Review.” Building and Environment 207: 108505. doi:10.1016/j.buildenv.2021.108505.
- Bjornstad, S., G.G. Patil, and R.K. Raanaas. 2015. “Nature Contact and Organizational Support during Office Working Hours: Benefits Relating to Stress Reduction, Subjective Health Complaints, and Sick Leave.” Work 53 (1): 9–20. doi:10.3233/WOR-152211.
- Bodin Danielsson, C., and L. Bodin. 2008. “Office Type in Relation to Health, Well-Being, and Job Satisfaction among Employees.” Environment and Behavior 40 (5): 636–668. doi:10.1177/0013916507307459.
- Borisuit, A., F. Linhart, J.L. Scartezzini, and M. Münch. 2015. “Effects of Realistic Office Daylighting and Electric Lighting Conditions on Visual Comfort, Alertness and Mood.” Lighting Research & Technology 47 (2): 192–209. doi:10.1177/1477153514531518.
- Boubekri, M., I.N. Cheung, K.J. Reid, C.H. Wang, and P.C. Zee. 2014. “Impact of Windows and Daylight Exposure on Overall Health and Sleep Quality of Office Workers: A Case-Control Pilot Study.” Journal of Clinical Sleep Medicine 10 (6): 603–611. doi:10.5664/jcsm.3780.
- Boubekri, M., J. Lee, P. Macnaughton, M. Woo, L. Schuyler, B. Tinianov, and U. Satish. 2020. “The Impact of Optimized Daylight and Views on the Sleep Duration and Cognitive Performance of Office Workers.” International Journal of Environmental Research and Public Health 17 (9): 3219. doi:10.3390/ijerph17093219.
- Bourbeau, J., C. Brisson, and S. Allaire. 1997. “Prevalence of the Sick Building Syndrome Symptoms in Office Workers before and Six Months and Three Years after Being Exposed to a Building with an Improved Ventilation System.” Occupational and Environmental Medicine 54 (1): 49–53. doi:10.1136/oem.54.1.49.
- Bringsén, Å., H. I. Andersson, G. Ejlertsson, and M. Troein. 2012. “Exploring Workplace Related Health Resources from a Salutogenic Perspective: Results from a Focus Group Study among Healthcare Workers in Sweden.” Work 42 (3): 403–414. doi:10.3233/WOR-2012-1356.
- Burt, T. 1996. “Sick Building Syndrome: Acoustic Aspects.” Indoor and Built Environment 5 (1): 44–59. doi:10.1177/1420326X9600500107.
- Canazei, M., W. Pohl, H.R. Bliem, M. Martini, and E.M. Weiss. 2017. “Artificial Skylight Effects in a Windowless Office Environment.” Building and Environment 124: 69–77. doi:10.1016/j.buildenv.2017.07.045.
- Candido, C., P. Chakraborty, and D. Tjondronegoro. 2019. “The Rise of Office Design in High-Performance, Open-Plan Environments.” Buildings 9 (4): 100–116. doi:10.3390/buildings9040100.
- Candido, Christhina, Leena Thomas, Shamila Haddad, Fan Zhang, Martin Mackey, and Wei Ye. 2019. “Designing Activity-Based Workspaces: Satisfaction, Productivity and Physical Activity.” Building Research & Information 47 (3): 275–289. doi:10.1080/09613218.2018.1476372.
- Cartwright, S., and C.L. Cooper. 1997. Managing Workplace Stress. Sage Publications.
- CBS 2020. Psychosociale arbeidsbelasting (PSA) werknemers; geslacht en leeftijd.
- Chadburn, A., J. Smith, and J. Milan. 2017. “Productivity Drivers of Knowledge Workers in the Central London Office Environment.” Journal of Corporate Real Estate 19 (2): 66–79. doi:10.1108/JCRE-12-2015-0047.
- Choi, J. H., V. Loftness, D. Nou, B. Tinianov, and D. Yeom. 2019. “Multi-Season Assessment of Occupant Responses to Manual Shading and Dynamic Glass in a Workplace Environment.” Energies 13 (1): 60. doi:10.3390/en13010060.
- Cobaleda Cordero, A., M. Babapour, and M.A. Karlsson. 2019. “Feel Well and Do Well at Work: A Post-Relocation Study on the Relationships between Employee Wellbeing and Office Landscape.” Journal of Corporate Real Estate 22 (2): 113–137. doi:10.1108/JCRE-01-2019-0002.
- Coffeng, J.K., C.R.L. Boot, S.F.A. Duijts, J.W.R. Twisk, W. Van Mechelen, and I.J.M. Hendriksen. 2014. “Effectiveness of a Worksite Social & Physical Environment Intervention on Need for Recovery, Physical Activity and Relaxation; Results of a Randomized Controlled Trial.” PLOS One 9 (12): e114860. doi:10.1371/journal.pone.0114860.
- Colenberg, S., T. Jylhä, and M. Arkesteijn. 2021. “The Relationship between Interior Office Space and Employee Health and Well-Being – A Literature Review.” Building Research & Information 49 (3): 352–366. doi:10.1080/09613218.2019.1710098.
- Cooper, C.L., and P. Dewe. 2008. “Well-being – Absenteeism, Presenteeism, Costs and Challenges.” Occupational Medicine 58 (8): 522–524. doi:10.1093/occmed/kqn124.
- D’Oca, Simona, Anna Laura Pisello, Marilena De Simone, Verena M. Barthelmes, Tianzhen Hong, and Stefano P. Corgnati. 2018. “Human-Building Interaction at Work: Findings from an Interdisciplinary Cross-Country Survey in Italy.” Building and Environment 132: 147–159. doi:10.1016/j.buildenv.2018.01.039.
- Davis, M.C., D.J. Leach, and C.W. Clegg. 2020. “Breaking out of Open-Plan: Extending Social Interference Theory through an Evaluation of Contemporary Offices.” Environment and Behavior 52 (9): 945–978. doi:10.1177/0013916519878211.
- Day, Julia K., Benjamin Futrell, Robert Cox, Shelby N. Ruiz, Armin Amirazar, Amir Hosseinzadeh Zarrabi, and Mona Azarbayjani. 2019. “Blinded by the Light: Occupant Perceptions and Visual Comfort Assessments of Three Dynamic Daylight Control Systems and Shading Strategies.” Building and Environment 154: 107–121. doi:10.1016/j.buildenv.2019.02.037.
- Di Blasio, S., L. Shtrepi, G.E. Puglisi, and A. Astolfi. 2019. “A Cross-Sectional Survey on the Impact of Irrelevant Speech Noise on Annoyance, Mental Health and Well-Being, Performance and Occupants’ Behavior in Shared and Open-Plan Offices.” International Journal of Environmental Research and Public Health 16 (2): 280. doi:10.3390/ijerph16020280.
- Dreyer, B.C., S. Coulombe, S. Whitney, M. Riemer, and D. Labbé. 2018. “Beyond Exposure to Outdoor Nature: Exploration of the Benefits of a Green Building’s Indoor Environment on Wellbeing.” Frontiers in Psychology 9: 1517–1583. doi:10.3389/fpsyg.2018.01583.
- Engelen, L., J. Chau, E. Bohn-Goldbaum, S. Young, D. Hespe, and A. Bauman. 2017. “Is Active Design Changing the Workplace? – A Natural Pre-Post Experiment Looking at Health Behaviour and Workplace Perceptions.” Work 56 (2): 229–237. doi:10.3233/WOR-172483.
- Fassoulis, K., and N. Alexopoulos. 2015. “The Workplace as a Factor of Job Satisfaction and Productivity: A Case Study of Administrative Personnel at the University of Athens.” Journal of Facilities Management 13 (4): 332–349. doi:10.1108/JFM-06-2014-0018.
- Figueiro, M.G., M. Kalsher, B.C. Steverson, J. Heerwagen, K. Kampschroer, and M.S. Rea. 2019. “Circadian-Effective Light and Its Impact on Alertness in Office Workers.” Lighting Research & Technology 51 (2): 171–183. doi:10.1177/1477153517750006.
- Figueiro, M.G., B.C. Steverson, J. Heerwagen, K. Kampschroer, C.M. Hunter, K. Gonzales, B. Plitnick, and M.S. Rea. 2017. “The Impact of Daytime Light Exposures on Sleep and Mood in Office Workers.” Sleep Health 3 (3): 204–215. doi:10.1016/j.sleh.2017.03.005.
- Forooraghi, M., E. Miedema, N. Ryd, and H. Wallbaum. 2020. “Scoping Review of Health in Office Design Approaches.” Journal of Corporate Real Estate 22 (2): 155–180. doi:10.1108/JCRE-08-2019-0036.
- Fostervold, K.I., and J. Nersveen. 2008. “Proportions of Direct and Indirect Indoor lighting – The Effect on Health, Well-Being and Cognitive Performance of Office Workers.” Lighting Research & Technology 40 (3): 175–197. doi:10.1177/1477153508090917.
- Garcia, A.B., F.L.R. Rocha, P.D.S.C. Pissinati, M.H.P. Marziale, S.H.H. Camelo, and M.D.C.F.L. Haddad. 2017. “The Effects of Organisational Culture on Nurses' Perceptions of Their Work.” British Journal of Nursing 26 (14): 806–812. doi:10.12968/bjon.2017.26.14.806.
- Gray, T., and C. Birrell. 2014. “Are Biophilic-Designed Site Office Buildings Linked to Health Benefits and High Performing Occupants?” International Journal of Environmental Research and Public Health 11 (12): 12204–12222. doi:10.3390/ijerph111212204.
- Groen, B., T. van der Voordt, B. Hoekstra, and H. van Sprang. 2019. “Impact of Employee Satisfaction with Facilities on Self-Assessed Productivity Support.” Journal of Facilities Management 17 (5): 442–462. doi:10.1108/JFM-12-2018-0069.
- Gupta, R., A. Howard, and S. Zahiri. 2020a. “Defining the Link between Indoor Environment and Workplace Productivity in a Modern UK Office Building.” Architectural Science Review 63 (3–4): 248–261. doi:10.1080/00038628.2019.1709788.
- Gupta, R., A. Howard, and S. Zahiri. 2020b. “Investigating the Relationship between Indoor Environment and Workplace Productivity in Naturally and Mechanically Ventilated Office Environments.” Building Services Engineering Research and Technology 41 (3): 280–304. doi:10.1177/0143624419891568.
- Haapakangas, A., D.M. Hallman, S.E. Mathiassen, and H. Jahncke. 2018. “Self-Rated Productivity and Employee Well-Being in Activity-Based Offices: The Role of Environmental Perceptions and Workspace Use.” Building and Environment 145: 115–124. doi:10.1016/j.buildenv.2018.09.017.
- Haapakangas, A., V. Hongisto, J. Varjo, and M. Lahtinen. 2018. “Benefits of Quiet Workspaces in Open-Plan Offices – Evidence from Two Office Relocations.” Journal of Environmental Psychology 56: 63–75. doi:10.1016/j.jenvp.2018.03.003.
- Haghighat, F., and G. Donnini. 1993. “Conventional vs CO2 Demand-Controlled Ventilation Systems.” Journal of Thermal Biology 18 (5–6): 519–522. doi:10.1016/0306-4565(93)90085-8.
- Haghighat, F., and G. Donnini. 1999. “Impact of Psycho-Social Factors on Perception of the Indoor Air Environment Studies in 12 Office Buildings.” Building and Environment 34 (4): 479–503. doi:10.1016/S0360-1323(98)00034-1.
- Hähn, N., E. Essah, and T. Blanusa. 2021. “Biophilic Design and Office Planting: A Case Study of Effects on Perceived Health, Well-Being and Performance Metrics in the Workplace.” Intelligent Buildings International 13 (4): 220–241. doi:10.1080/17508975.2020.1732859.
- Hanc, M., C. McAndrew, and M. Ucci. 2019. “Conceptual Approaches to Wellbeing in Buildings: A Scoping Review.” Building Research & Information 47 (6): 767–783. doi:10.1080/09613218.2018.1513695.
- Harvard Health Publishing 2008. Positive psychology in practice. https://www.health.harvard.edu/mind-and-mood/positive_psychology_in_practice
- Haynes, B., L. Suckley, and N. Nunnington. 2017. “Workplace Productivity and Office Type: An Evaluation of Office Occupier Differences Based on Age and Gender.” Journal of Corporate Real Estate 19 (2): 111–138. doi:10.1108/JCRE-11-2016-0037.
- Hedge, A., W.A. Erickson, and G. Rubin. 1996. “Predicting Sick Building Syndrome at the Individual and Aggregate Levels.” Environment International 22 (1): 3–19. doi:10.1016/0160-4120(95)00099-2.
- Herbig, B., A. Schneider, and D. Nowak. 2016. “Does Office Space Occupation Matter? The Role of the Number of Persons per Enclosed Office Space, Psychosocial Work Characteristics, and Environmental Satisfaction in the Physical and Mental Health of Employees.” Indoor Air 26 (5): 755–767. doi:10.1111/ina.12263.
- Hsiao, L., M.C. Hsiao, and Y.L. Wang. 2013. “Effects of Office Space and Colour on Knowledge Sharing and Work Stress.” South African Journal of Economic and Management Sciences 16 (5): 42–53. doi:10.4102/sajems.v16i5.668.
- Isen, A.M. 2001. “An Influence of Positive Affect on Decision Making in Complex Situations: Theoretical Issues with Practical Implications.” Journal of Consumer Psychology 11 (2): 75–85. doi:10.1207/153276601750408311.
- Jensen, P. A, and T. J. van der Voordt. 2019. “Healthy Workplaces: What We Know and What Else We Need to Know.” Journal of Corporate Real Estate 22 (2): 95–112. doi:10.1108/JCRE-11-2018-0045.
- Kaarlela-Tuomaala, A., R. Helenius, E. Keskinen, and V. Hongisto. 2009. “Effects of Acoustic Environment on Work in Private Office Rooms and Open-Plan offices – Longitudinal Study during Relocation.” Ergonomics 52 (11): 1423–1444. doi:10.1080/00140130903154579.
- Kekäläinen, P., R. Niemelä, M. Tuomainen, S. Kemppilä, J. Palonen, H. Riuttala, E. Nykyri, O. Seppänen, and K. Reijula. 2010. “Effect of Reduced Summer Indoor Temperature on Symptoms, Perceived Work Environment and Productivity in Office Work: An Intervention Study.” Intelligent Buildings International 2 (4): 251–266. doi:10.3763/inbi.2010.0051.
- Kim, Jungsoo, Christhina Candido, Leena Thomas, and Richard de Dear. 2016. “Desk Ownership in the Workplace: The Effect of Non-Territorial Working on Employee Workplace Satisfaction, Perceived Productivity and Health.” Building and Environment 103: 203–214. doi:10.1016/j.buildenv.2016.04.015.
- Kim, J., M. Kong, T. Hong, K. Jeong, and M. Lee. 2018. “Physiological Response of Building Occupants Based on Their Activity and the Indoor Environmental Quality Condition Changes.” Building and Environment 145: 96–103. doi:10.1016/j.buildenv.2018.09.018.
- Kim, Ho-Hyun, Jae-Young Lee, Ji-Yeon Yang, Kwang-Jin Kim, Yong-Jin Lee, Dong-Chun Shin, and Young-Wook Lim. 2011. “Evaluation of Indoor Air Quality and Health Related Parameters in Office Buildings with or without Indoor Plants.” Journal of the Japanese Society for Horticultural Science 80 (1): 96–102. doi:10.2503/jjshs1.80.96.
- Kompier, M., K. Smolders, and Y. de Kort. 2020. “Effects of Light and Ambient Temperature on Visual and Thermal Appraisals”. In Routledge Handbook of Resilient Thermal Comfort 347–362. Routledge.
- Kozaki, T., N. Miura, M. Takahashi, and A. Yasukouchi. 2012. “Effect of Reduced Illumination on Insomnia in Office Workers.” Journal of Occupational Health 54 (4): 331–335. doi:10.1539/joh.12-0049-FS.
- Kwallek, Nancy, Kokyung Soon, and Carol M. Lewis. 2007. “Work Week Productivity, Visual Complexity, and Individual Environmental Sensitivity in Three Offices of Different Color Interiors.” Color Research & Application 32 (2): 130–143. doi:10.1002/col.20298.
- Kwallek, N., H. Woodson, C.M. Lewis, and C. Sales. 1997. “Impact of Three Interior Color Schemes on Worker Mood and Performance Relative to Individual Environmental Sensitivity.” Color Research & Application 22 (2): 121–132. doi:10.1002/(SICI)1520-6378(199704)22:2<121::AID-COL7>3.0.CO;2-V.
- Leather, P., D. Beale, and L. Sullivan. 2003. “Noise, Psychosocial Stress and Their Interaction in the Workplace.” Journal of Environmental Psychology 23 (2): 213–222. doi:10.1016/S0272-4944(02)00082-8.
- Lee, Y. S. 2010. “Office Layout Affecting Privacy, Interaction, and Acoustic Quality in LEED-Certified Buildings.” Building and Environment 45 (7): 1594–1600. doi:10.1016/j.buildenv.2010.01.007.
- Lee, M.J., W. Oh, J. Kim, and J.S. Jang. 2018. “LED Colors and Worker Stress Response after a Flower Arrangement Activity.” Horticultural Science and Technology 36 (3): 435–443. doi:10.12972/kjhst.20180043.
- Leiter, M. P, and C. Maslach. 2016. “Latent Burnout Profiles: A New Approach to Understanding the Burnout Experience.” Burnout Research 3 (4): 89–100. doi:10.1016/j.burn.2016.09.001.
- Lindberg, C.M., K. Srinivasan, B. Gilligan, J. Razjouyan, H. Lee, B. Najafi, K.J. Canada, M.R. Mehl, F. Currim, S. Ram, M.M. Lunden, J.H. Heerwagen, K. Kampschroer, and E.M. Sternberg. 2018. “Effects of Office Workstation Type on Physical Activity and Stress.” Occupational and Environmental Medicine 75 (10): 689–695. doi:10.1136/oemed-2018-105077.
- Lindholm, A.L., and K.I. Leväinen. 2006. “A Framework for Identifying and Measuring Value Added by Corporate Real Estate.” Journal of Corporate Real Estate 8 (1): 38–46. doi:10.1108/14630010610664796.
- Linton, M.J., J. Coast, I. Williams, J. Copping, and A. Owen-Smith. 2019. “Developing a Framework of Quality Indicators for Healthcare Business Cases: A Qualitative Document Analysis Consolidating Insight from Expert Guidance and Current Practice.” BMC Health Services Research 19 (1): 1–9. doi:10.1186/s12913-019-4269-9.
- Lou, H., and D. Ou. 2019. “A Comparative Field Study of Indoor Environmental Quality in Two Types of Open-Plan Offices: Open-Plan Administrative Offices and Open-Plan Research Offices.” Building and Environment 148: 394–404. doi:10.1016/j.buildenv.2018.11.022.
- Lu, C.Y., J.M. Lin, Y.Y. Chen, and Y.C. Chen. 2015. “Building-Related Symptoms among Office Employees Associated with Indoor Carbon Dioxide and Total Volatile Organic Compounds.” International Journal of Environmental Research and Public Health 12 (6): 5833–5845. doi:10.3390/ijerph120605833.
- MacHe, S., R. Servaty, and V. Harth. 2020. “Flexible Work Arrangements in Open Workspaces and Relations to Occupational Stress, Need for Recovery and Psychological Detachment from Work.” Journal of Occupational Medicine and Toxicology 15 (1): 5–11. doi:10.1186/s12995-020-00258-z.
- Maierova, L., A. Borisuit, J.L. Scartezzini, S.M. Jaeggi, C. Schmidt, and M. Münch. 2016. “Diurnal Variations of Hormonal Secretion, Alertness and Cognition in Extreme Chronotypes under Different Lighting Conditions.” Scientific Reports 6: 33510–33591. doi:10.1038/srep33591.
- Meir, I.A., M. Schwartz, Y. Davara, and Y. Garb. 2019. “A Window of One’s Own: A Public Office Post-Occupancy Evaluation.” Building Research & Information 47 (4): 437–452. doi:10.1080/09613218.2018.1434366.
- Mendell, M.J., Q. Lei-Gomez, A.G. Mirer, O. Seppnen, and G. Brunner. 2008. “Risk Factors in Heating, Ventilating, and Air-Conditioning Systems for Occupant Symptoms in US Office Buildings: The US EPA BASE Study.” Indoor Air 18 (4): 301–316. doi:10.1111/j.1600-0668.2008.00531.x.
- Menzies, D., J. Pasztor, F. Nunes, J. Leduc, and C.H. Chan. 1997. “Effect of a New Ventilation System on Health and Well-Being of Office Workers.” Archives of Environmental Health: An International Journal 52 (5): 360–367. doi:10.1080/00039899709602212.
- Mills, P.R., S.C. Tomkins, and L.J.M. Schlangen. 2007. “The Effect of High Correlated Colour Temperature Office Lighting on Employee Wellbeing and Work Performance.” Journal of Circadian Rhythms 5: 2. doi:10.1186/1740-3391-5-2.
- Miner, A.G., and T.M. Glomb. 2010. “State Mood, Task Performance, and Behavior at Work: A within-Persons Approach.” Organizational Behavior and Human Decision Processes 112 (1): 43–57. doi:10.1016/j.obhdp.2009.11.009.
- Muldavin, S., C.R. Miers, and K. McMackin. 2017. “Buildings Emerge as Drivers of Health and Profits.” Corporate Real Estate Journal 7 (2): 177–193. https://www.ingentaconnect.com/content/hsp/crej/2017/00000007/00000002/art00009.
- Newsham, G.R., C. Arsenault, J.A. Veitch, A.M. Tosco, and C. Duval. 2005. “Task Lighting Effects on Office Worker Satisfaction and Performance, and Energy Efficiency.” LEUKOS the Journal of the Illuminating Engineering Society of North America 1 (4): 7–26. doi:10.1582/LEUKOS.01.04.001.
- Newsham, G.R., B.J. Birt, C. Arsenault, A.J.L. Thompson, J.A. Veitch, S. Mancini, A.D. Galasiu, B.N. Gover, I.A. MacDonald, and G.J. Burns. 2013. “Do Green Buildings Have Better Indoor Environments? New Evidence.” Building Research & Information 41 (4): 415–434. doi:10.1080/09613218.2013.789951.
- Nieuwenhuis, M., C. Knight, T. Postmes, and S.A. Haslam. 2014. “The Relative Benefits of Green versus Lean Office Space: Three Field Experiments.” Journal of Experimental Psychology. Applied 20 (3): 199–214. doi:10.1037/xap0000024.
- Obuobisa‐Darko, T. 2020. “Ensuring Employee Task Performance: Role of Employee Engagement.” Performance Improvement 59 (8): 12–23. doi:10.1002/pfi.21929.
- Park, S.-B., and S. Gotoh. 1993. “Research on Office Environment Evaluation and Worker Fatigue.” Journal of Thermal Biology 18 (5–6): 565–570. doi:10.1016/0306-4565(93)90093-9.
- Partonen, T., and J. Lönnqvist. 2000. “Bright Light Improves Vitality and Alleviates Distress in Healthy People.” Journal of Affective Disorders 57 (1–3): 55–61. doi:10.1016/S0165-0327(99)00063-4.
- Perrin Jegen, N., and P. Chevret. 2017. “Effect of Noise on Comfort in Open-Plan Offices: application of an Assessment Questionnaire.” Ergonomics 60 (1): 6–17. doi:10.1080/00140139.2016.1172737.
- Poursafar, Z., L.L.R. Rodrigues, and K.V. Sriram. 2019. “Architectural Design Model for Office Interior to Suit Personality Types and to Enhance Productivity.” International Journal of Recent Technology and Engineering 8 (2): 1916–1921. doi:10.35940/ijrte.B1855.078219.
- Rasheed, E.O., M. Khoshbakht, and G. Baird. 2019. “Does the Number of Occupants in an Office Influence Individual Perceptions of Comfort and Productivity?-New Evidence from 5000 Office Workers.” Buildings 9 (3): 73. doi:10.3390/buildings9030073.
- Razjouyan, J., H. Lee, B. Gilligan, C. Lindberg, H. Nguyen, K. Canada, A. Burton, A. Sharafkhaneh, K. Srinivasan, F. Currim, S. Ram, M.R. Mehl, N. Goebel, M. Lunden, S. Bhangar, J. Heerwagen, K. Kampschroer, E.M. Sternberg, and B. Najafi. 2020. “Wellbuilt for Wellbeing: Controlling Relative Humidity in the Workplace Matters for Our Health.” Indoor Air 30 (1): 167–179. doi:10.1111/ina.12618.
- Reijula, K., and C. Sundman-Digert. 2004. “Assessment of Indoor Air Problems at Work with a Questionnaire.” Occupational and Environmental Medicine 61 (1): 33–38.
- Reynolds, S.J., D.W. Black, S.S. Borin, G. Breuer, L.F. Burmeister, L.J. Fuortes, T.F. Smith, M.A. Stein, P. Subramanian, P.S. Thorne, and P. Whitten. 2001. “Indoor Environmental Quality in Six Commercial Office Buildings in the Midwest United States.” Applied Occupational and Environmental Hygiene 16 (11): 1065–1077. doi:10.1080/104732201753214170.
- Riba Sagar, M.B., V. Parikh, and J.F. Greden Editors. 2019. Integrating Psychiatry and Primary Care Mental Health in the Workplace Strategies and Tools to Optimize Outcomes. Springer International Publishing AG. http://www.springer.com/series/13818
- Ruohomäki, V., M. Lahtinen, and K. Reijula. 2015. “Salutogenic and User-Centred Approach for Workplace Design.” Intelligent Buildings International 7 (4): 184–197. doi:10.1080/17508975.2015.1007911.
- Pas, L.V., M.L.M. Busch, and K.I. Proper. 2014. Beleid rondom mentale gezondheid in de werksetting. RIVM report 020022001. www.rivm.nl
- Roskams, M., B. Haynes, P.J. Lee, and S.H. Park. 2019. “Acoustic Comfort in Open-Plan Offices: The Role of Employee Characteristics.” Journal of Corporate Real Estate 21 (3): 254–270. doi:10.1108/JCRE-02-2019-0011.
- Seddigh, Aram, Erik Berntson, Christina Bodin Danielson, and Hugo Westerlund. 2014. “Concentration Requirements Modify the Effect of Office Type on Indicators of Health and Performance.” Journal of Environmental Psychology 38: 167–174. doi:10.1016/j.jenvp.2014.01.009.
- Seddigh, Aram, Erik Berntson, Fredrik Jönsson, Christina Bodin Danielson, and Hugo Westerlund. 2015. “Effect of Variation in Noise Absorption in Open-Plan Office: A Field Study with a Cross-over Design.” Journal of Environmental Psychology 44: 34–44. doi:10.1016/j.jenvp.2015.08.004.
- Seligman, M.E.P. 2008. “Positive Health.” Applied Psychology 57 (s1): 3–18. doi:10.1111/j.1464-0597.2008.00351.x.
- Singer, B.P., B.A.G. Bossink, and H.J.M. Vande Putte. 2007. “Corporate Real Estate and Competitive Strategy.” Journal of Corporate Real Estate 9 (1): 25–38. doi:10.1108/14630010710742464.
- Smith, A., and M. Pitt. 2009. “Sustainable Workplaces: Improving Staff Health and Well-Being Using Plants.” Journal of Corporate Real Estate 11 (1): 52–63. doi:10.1108/14630010910940552.
- Taris, T.W. 2006. “Is There a Relationship between Burnout and Objective Performance? A Critical Review of 16 Studies.” Work & Stress 20 (4): 316–334. doi:10.1080/02678370601065893.
- Teasdale, E.L. 2006. “Workplace Stress.” Psychiatry 5 (7): 251–254. doi:10.1053/j.mppsy.2006.04.006.
- Tesarz, Maria, Anders Kjeilberg, Ulf Landström, and Kjell Holmberg. 1997. “Subjective Response Patterns Related to Low Frequency Noise.” Journal of Low Frequency Noise Vibration and Active Control 16 (2): 145–149. doi:10.1177/026309239701600205.
- Thatcher, A., and K. Milner. 2014. “Changes in Productivity, Psychological Wellbeing and Physical Wellbeing from Working in a “Green” Building.” Work 49 (3): 381–393. doi:10.3233/WOR-141876.
- Thomsen, J.D., H.K.H. Sønderstrup-Andersen, and R. Müller. 2011. “People-Plant Relationships in an Office Workplace: Perceived Benefits for the Workplace and Employees.” HortScience 46 (5): 744–752. doi:10.21273/HORTSCI.46.5.744.
- TNO 2019. Verzuimkosten Door Werkstress Lopen p tot 2,8 Miljard.
- Tonello, G. 2004. “How is Workers’ Mood Affected by Workplace Lighting?” Journal of Light & Visual Environment 28 (3): 139–147. doi:10.2150/jlve.28.139.
- Tonello, G., N. Hernández de Borsetti, H. Borsetti, L. Tereschuk, and S. López Zigarán. 2019. “Perceived Well-Being and Light-Reactive Hormones: An Exploratory Study.” Lighting Research & Technology 51 (2): 184–205. doi:10.1177/1477153517750714.
- Toyoda, M., Y. Yokota, M. Barnes, and M. Kaneko. 2020. “Potential of a Small Indoor Plant on the Desk for Reducing Office Workers’ Stress.” HortTechnology 30 (1): 55–63. doi:10.21273/HORTTECH04427-19.
- Valančius, R., and A. Jurelionis. 2013. “Influence of Indoor Air Temperature Variation on Office Work Performance.” Journal of Environmental Engineering and Landscape Management 21 (1): 19–25. doi:10.3846/16486897.2012.721371.
- van der Voordt, T. 2016. Facilities Management and Corporate Real Estate Management as Value Drivers: How to Manage and Measure Adding Value. Taylor & Francis.
- van Duijnhoven, J., M.P.J. Aarts, A.L.P. Rosemann, and H.S.M. Kort. 2018. “Ambiguities regarding the Relationship between Office Lighting and Subjective Alertness: An Exploratory Field Study in a Dutch Office Landscape.” Building and Environment 142: 130–138. doi:10.1016/j.buildenv.2018.06.011.
- Veitch, J.A., and G.R. Newsham. 2000. “Exercised Control, Lighting Choices, and Energy Use: An Office Simulation Experiment.” Journal of Environmental Psychology 20 (3): 219–237. doi:10.1006/jevp.1999.0169.
- Veitch, J.A., G.R. Newsham, P.R. Boyce, and C.C. Jones. 2008. “Lighting Appraisal, Well-Being and Performance in Open-Plan Offices: A Linked Mechanisms Approach.” Lighting Research & Technology 40 (2): 133–148. doi:10.1177/1477153507086279.
- Veitch, J.A., M.G.M. Stokkermans, and G.R. Newsham. 2013. “Linking Lighting Appraisals to Work Behaviors.” Environment and Behavior 45 (2): 198–214. doi:10.1177/0013916511420560.
- Viola, A.U., L.M. James, L.J.M. Schlangen, and D.J. Dijk. 2008. “Blue-Enriched White Light in the Workplace Improves Self-Reported Alertness, Performance and Sleep Quality.” Scandinavian Journal of Work, Environment & Health 34 (4): 297–306. doi:10.5271/sjweh.1268.
- Vischer, J. C, and M. Wifi. 2017. “The Effect of Workplace Design on Quality of Life at Work.” In Handbook of Environmental Psychology and Quality of Life Research, edited by Ghozlane Fleury-Bahi, Enric Pol, and Oscar Navarro, 387–400. Cham: Springer.
- Watson, K.J. 2018. “Establishing Psychological Wellbeing Metrics for the Built Environment.” Building Services Engineering Research and Technology 39 (2): 232–243. doi:10.1177/0143624418754497.
- WHO 2004. Promiting Mental Health. WHO.
- Wiik, R. 2011. “Indoor Productivity Measured by Common Response Patterns to Physical and Psychosocial Stimuli.” Indoor Air 21 (4): 328–340. doi:10.1111/j.1600-0668.2011.00708.x.
- Zhang, Rongpeng, Carolina Campanella, Sara Aristizabal, Anja Jamrozik, Jie Zhao, Paige Porter, Shaun Ly, and Brent A. Bauer. 2020. “Impacts of Dynamic Led Lighting on the Well-Being and Experience of Office Occupants.” International Journal of Environmental Research and Public Health 17 (19): 7217–7227. doi:10.3390/ijerph17197217.
- Zhang, Mei, Jian Kang, and Fenglei Jiao. 2012. “A Social Survey on the Noise Impact in Open-Plan Working Environments in China.” The Science of the Total Environment 438: 517–526. doi:10.1016/j.scitotenv.2012.08.082.
- Zhu, Y., M. Yang, Y. Yao, X. Xiong, X. Li, G. Zhou, and N. Ma. 2019. “Effects of Illuminance and Correlated Color Temperature on Daytime Cognitive Performance, Subjective Mood, and Alertness in Healthy Adults.” Environment and Behavior 51 (2): 199–230. doi:10.1177/0013916517738077.