
Abstract
The typicality effect suggests typical category members provide a cognitive advantage, such as being quicker and easier to recognise and describe. The reverse effect has not been explored in an applied environment. Non-typical flight safety events appear to pose problems for pilots, leading to delayed recognition and ineffective use of checklists. Fifty-six airline pilots completed an experiment that tested a real-world typicality gradient, comparing pilot performance on a group of four non-typical events against four randomly selected events. Non-typical flight safety events elicited a greater number of response errors and a greater response latency when compared with a random selection of safety events. We specify and measure cognitive disadvantage and suggest innovations in pilot education, such as locating troublesome events and improving recognition guidance. Our new findings can be used to better prepare pilots for event diversity and inform safety in other work systems of interest to ergonomics.
Practitioner summary: Typical safety events in work environments provide a cognitive dividend, supporting effective recognition and response. In this study, we frame and measure the opposite effect, the cognitive disadvantages of non-typical events. Non-typical events pose significant risk in work systems such as air transport, and we suggest innovations in pilot knowledge and training that make use of this approach.
Introduction
Almost everybody can recognise and describe a great white shark. Typical category members provide humans with cognitive advantages, such as being quicker to recognise and easier to describe (Cantor, Mischel, and Schwartz Citation1982; Rosch Citation1973). This is known as the typicality effect (Rosch, Simpson, and Miller Citation1976). In this article we present new findings that capture the cognitive disadvantages of non-typical stimuli and indicate how this could help explain flight crew behaviour seen in recent aircraft accidents and contribute improvements to pilot training.
There is evidence that pilots have encounters with unusual, rare, and puzzling cockpit indications. On 29th December 2010, a Boeing 757, operating American Airlines Flight 2253, overran the runway at Jackson Hole, Wyoming, USA, coming to rest in deep snow approximately 200 metres beyond the end of the runway (NTSB (National Transportation Safety Board) Citation2012). On touchdown the automatic wing spoilers and the thrust reversers failed to deploy normally, degrading the ability of the aircraft to stop. The crew did not notice the spoiler malfunction and it took approximately 18 s to finally deploy the thrust reversers. By this time insufficient runway was left to stop the aircraft (NTSB (National Transportation Safety Board) Citation2012). The pilots were experienced on the Boeing 757 aircraft and had prepared meticulously for their approach to the snow-covered runway at Jackson Hole. The presentation of two unusual abnormalities, failure of the spoilers and reversers, on touchdown is not typical and is unlikely to correspond with simulator training (Clewley and Nixon Citation2019; NTSB (National Transportation Safety Board) Citation2012). Events like this are difficult to recognise and connect to an appropriate response protocol in real-time.
Recognition and response problems are found in other aircraft accidents. In June 2009 the pilots of an Air France Airbus A330 were unable to recognise a loss of reliable airspeed data and an aerodynamic stall, resulting in the loss of the aircraft (BEA (Bureau d’Enquêtes et d’Analyses) Citation2012). Recent accidents involving the Boeing 737-MAX have brought renewed scrutiny of pilot recognition of system failures involving sophisticated technology found on modern aircraft (AIB (Aircraft Accident Investigation Bureau of Ethiopia) Citation2019; JATR (Joint Authorities Technical Review) Citation2019; KNKT Citation2019). Fresh attention on the certification of Boeing 737-MAX indicates that current assumptions about pilot response may be faulty; some response protocols may not be easily retrieved during unanticipated system failures (United States House Committee on Transportation and Infrastructure Citation2020). Furthermore, some events expected to be handled by airline pilots pose significant problems even for test pilots immersed in a test flying programme, with presumably more knowledge and resource available (United States House Committee on Transportation and Infrastructure Citation2020). Pilot actions may be delayed and inappropriate when they experience the cognitive disadvantage of a non-typical event. We think an advanced understanding of the phenomenon offers better explanations of pilot behaviour and new opportunities to improve pilot training and knowledge.
Research in cognitive psychology suggests encounters with typical stimuli provide cognitive advantages that translate to optimal behaviour. In this article we explore the possibility of the reverse effect, cognitive disadvantage, influencing pilots in the cockpit. Here, we define cognitive disadvantage as the extent to which the perceptual environment does not support beneficial and functional cognition in respect to the flight crew task (Rogers et al. Citation2015; Rosch Citation1978; Rosch, Simpson, and Miller Citation1976). The aim is to frame, detect and measure cognitive disadvantage and suggest ways in which this facet of category theory could improve flight safety. Firstly, we review the theoretical foundations of typicality, and explain how variations in typicality can predict cognitive performance. We then discuss how this relates to contemporary issues in flight safety events and pilot response. Finally, we develop two research hypotheses to measure cognitive disadvantage in pilots.
The typicality effect
Humans reduce the world into groups, or categories, that share attributes (Pothos and Wills Citation2011). This allows the cognitive system to treat similar things equivalently, delivering cognitive economy and preserving capacity (Harnad Citation2005; Rosch Citation1978). Categories exhibit internal variations, known as gradients (Barsalou Citation1985; Rosch Citation1978). One robust finding indicates that some category members are reliably judged more typical than others. These are called ‘typicality gradients’ (Barsalou Citation1985; Dry and Storms Citation2010; Rosch Citation1973; Rosch and Mervis Citation1975). For instance, for the category ‘shark’, a great white shark is a better, more typical, category member than a hooded carpetshark. The best, most central cases are known as prototypes, and act as cognitive reference points to judge other cases (Rosch Citation1975).
With typicality comes a variety of cognitive advantages, including superior verification and improved learning. This is known as the typicality effect (Rosch, Simpson, and Miller Citation1976). Behavioural data is supported by electrophysiological and neural imaging evidence, which indicates typical stimuli receive preferential processing over non-typical stimuli (Lei et al. Citation2010; Wang et al. Citation2016) and display different signatures in specific neural structures (Iordan et al. Citation2016). Knowledge of cognitive disadvantage could offer ways of improving human performance, and it is this concept we explore in this article.
Cantor, Mischel, and Schwartz (Citation1982) extended the typicality principle to situations and events. Typical situations are more accessible, richer in knowledge content and easier to describe, so play an important role in planning and regulating behaviour (Cantor Citation1981; Cantor, Mischel, and Schwartz Citation1982). Situation prototypes exhibit structural orderliness, such that features are meaningfully clustered, improving retrieval (Cantor, Mischel, and Schwartz Citation1982). This principle has been applied to real-world work settings, most notably in the naturalistic decision making paradigm (Klein Citation2008). Typical events promote rapid decisions and sensemaking, through efficient use of knowledge structures, known as ‘frames’ (Klein, Calderwood, and Clinton-Cirocco Citation1986; Neisser Citation1976; Weick Citation1995). This approach has been deployed to a variety of safety critical work settings, including firefighting (Klein, Calderwood, and Clinton-Cirocco Citation1986), medicine (Schnittker et al. Citation2017) and aviation (Strauch Citation2016)[see Gore et al. Citation2015; Klein Citation2015, for coverage].
Non-typical flight safety events
Pilots experience a variety of in-flight events. Some involve single, well isolated malfunctions, others are novel, arise with unusual cue combinations and may have no specific response protocol or published procedure (NASA Citation2005). We can expect non-typical events in complex, dynamic systems such as air transport. Technology can be unruly, system components may interact in non-linear ways and may be tightly coupled, leading to unpredictable events (see Hulme et al. Citation2021, for a complete discussion of systems thinking tenets in accident causation).
Clewley and Nixon (Citation2019) proposed a framework that describes pilot recognition of events as a function of overlap between either an event prototype (‘best case’), or a previous encounter (‘exemplar’). As correspondence varies, so does pilot recognition and response capability. Further supporting this approach, (Clewley and Nixon Citation2022a) recently demonstrated typicality gradients for fuel system and approach to land-related flight safety events. Fuel imbalance events were judged significantly more typical than fuel leak events, for example, locating event types where typicality effects may influence pilot cognitive performance. Such real-world typicality gradients also indicate candidate events that may provide useful, readily accessible frames (Weick Citation1995) supporting rapid reframing.
Pilot performance may be harmed by structural problems in airline pilot training, which provides flight crew with relatively predictable, formulaic scenarios in flight simulator tests (Casner, Geven, and Williams Citation2013). Pilot performance can drop below minimum standards when events are presented in unfamiliar ways that do not match normal testing routines. Predictability in tests may create the illusion of learning, yet skills may not be generalisable to support recognition of unfamiliar event presentations (Casner, Geven, and Williams Citation2013). This deficiency is predicted by the typicality effect. Training for typicality may lead to cognitive disadvantages as events encountered in the real-world may poorly match pilots’ previous experience and event knowledge (Clewley and Nixon Citation2019).
Cognitive disadvantage associated with typicality could be an important driver of pilot behaviour, and may be an overlooked, yet accessible, component of recognition and response failures. In this article we demonstrate how a new application of the typicality effect can be used to measure cognitive disadvantage in pilots and suggest ways to improve safety. Typicality can be operationalised through gradients (Clewley and Nixon Citation2022a). Locating and using key typicality gradients can reveal the specific magnitude of cognitive disadvantage and help understand events that pose risk of poor recognition and response, leading to more focussed pilot training and improved response procedures. This leads to our research hypotheses. Using a real-world typicality gradient, the study tested two hypotheses to demonstrate evidence of cognitive disadvantage in pilots. Firstly, we predicted non-typical flight safety events would elicit a greater number of response choice errors when compared to a random sample of flight safety events. Secondly, we predicted non-typical flight safety events would elicit a greater response latency when compared to a random sample of fight safety events. This provides a novel application of category theory in an applied design.
Method
Participants
Fifty-six airline pilots participated in the study. All participants worked at the same European short-haul airline on the same aircraft type. The sample comprised 29 Captains, 27 First Officers, mean age 37.5 years (SD = 8.2), 4 females and 52 males. Median flying experience 4100 h, range = 700–11,100 h. Median flying experience on the aircraft type 2250 h, range = 300–8000 h. For the between-participant component (see design section below), the control condition comprised 14 Captains and 14 First Officers (n = 28) and the non-typical condition comprised 15 Captains and 13 First Officers (n = 28). There were no significant differences between median flying hours between conditions (χ2 (1) = 0.29, p = 0.59).
Design
There were two components to the study. Firstly, we measured cognitive performance across the experimental conditions using a between-participants design. This was chosen to avoid practice effects on the non-target events, which were the same across both conditions. The independent variable was ‘event typicality’. There were two levels, the control condition and the non-typical condition. Each condition had an equal number of participants (n = 28 in each condition; n = 56 in total).
Secondly, we collected rated typicality data for the experimental stimuli, to construct typicality gradients, using a within-participants design (n = 56).
Independent variables
Target events and non-target events were developed as part of the experimental design. Target events reflected the independent variable ‘event typicality’. There were two groups of target events to reflect the two levels of event typicality. All target events feature in the Evidence-based Training Matrix for large public transport aircraft (IATA Citation2013). Wording of each event was derived from the official airline documentation. The non-target events were introduced to add diversity to the experimental task so there was a mix of operational and technical components, to reflect the variety of everyday flight tasks (e.g., operational procedure for converting visibility to runway visual range; implications of touchdown zone runway lights downgraded). Non-target events were unchanged across conditions. We did not measure performance on non-target events.
The control condition was a list of eight events, consisting of four target events and the four non-target events. The control condition target events were selected at random from the aircraft ‘expanded emergency checklist’. We listed each event (n = 169) and used a random number table to select four. Each participant allocated to the control condition viewed the same set of events.
The non-typical condition was a list of eight events, consisting of four target events and the same four non-target events as the control condition. To select events, we consulted a senior management Captain at the host airline to act as a subject matter expert (SME) on flight safety events. The first author (RC) is also an experienced airline Captain with over 10,000 flying hours. Candidate events were selected that met the criteria of non-typical described in the introduction. Key indicators of a non-typical event included: rarely encountered in everyday flight operations, rarely featuring in Safety Management System data capture (e.g. crew safety reports, flight data monitoring) and experience of the events predominantly derived from infrequent simulations during proficiency checks (Clewley and Nixon Citation2019). Following discussion, ‘Flight Control’ and ‘Instruments/Auto-flight’ event categories were identified as key concerns and these categories of non-normal events provided a wide variety of scenarios that were agreed to fulfil the criteria.
The non-typical target events were chosen at random from the ‘Flight Control’ and ‘Instruments/Auto-flight’ sections of the aircraft abnormal and emergency checklist. We listed each event (n = 23 for ‘Flight Control’ and n = 49 for ‘Instruments/Auto-flight) and used a random number table to select four. We consulted the SME to ensure each selected event met the non-typical criteria. Each participant allocated to the non-typical condition viewed the same set of events.
Dependent variables
We measured flight crew performance using two dependent variables.
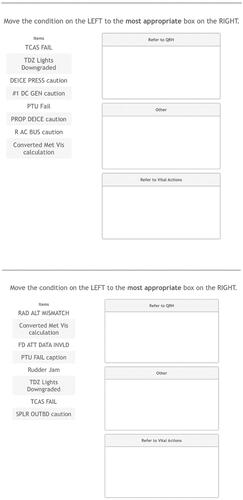
Response choice accuracy was scored according to the total number of target events correctly allocated to the most appropriate response. This is required in flight operations and reflects pilot performance. Three response choices were provided, shown in , above.
Table 1. Options for the response choice accuracy dependent variable.
The correct responses were confirmed by the SME at the host airline. According to the host airline’s official documentation each event had one ‘most appropriate’ response that would be the acceptable to the Flight Operations Department.
Response latency was measured in milliseconds and was defined as the total time taken to complete the task. The task was timed to replicate the temporal constraints seen in flight crew tasks. Participants were given 60 s to complete the task and a countdown timer was displayed in the bottom left-hand corner of the screen.
Rated typicality was measured on a 9-point scale, using the anchors ‘not at all’ (1) and ‘very’ (9), using the question structure ‘Thinking about flight safety events, rate how typical [insert event] is in flight operations?’. This is an established approach to measuring typicality and rated typicality provides the strongest empirical evidence of typicality gradients (Barsalou Citation1987; Rothbart, Sriram, and Davis-Stitt Citation1996. Dry and Storms Citation2010).
Materials and procedure
The research protocol was approved by the University Ethics Committee. Experimental materials were delivered by the Qualtrics survey platform (Qualtrics, Provo, Utah, USA). The order of event items and response choices were randomised. Response latency (time taken to complete the task) was captured by the software. Each respondent was sent a link to the Qualtrics survey platform and completed the research tasks on-line after giving informed consent. Participants were randomly assigned to the control group or the experimental group by the software.
Participants were presented with a list of eight event items, comprising four target events and the four non-target events. The target events varied according to which group the participant was assigned. They were instructed to choose the ‘most appropriate response’ by moving each item to the associated box. , above, shows screenshots of the control and experimental conditions.
Figure 1. Screenshots of the control condition (top) and experimental condition (bottom).
After the experiment we collected rated typicality data for both conditions. We gave an example of typicality rating from a different domain to check participant understanding of the typicality question. The order of events was randomised by the software. We used this typicality data to generate an aggregate typicality gradient for each condition.
Data analysis
Independent samples t-test was used to test for differences between groups for the response accuracy and response latency. The typicality ratings used a within-subjects design, so the paired t-test was used to compare means. Effect size was reported using Cohen’s d, with effect sizes > 0.8 considered large (Cohen Citation1992) . An alpha of <0.05 was considered significant, Bonferroni corrected where applicable.
Results
Typicality gradients
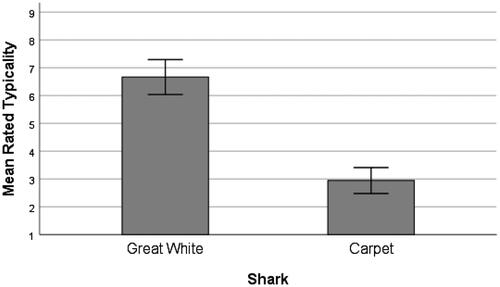
Typicality gradients, illustrating variations in mean rated typicality, were generated to firstly replicate a typicality gradient from literature (n = 56).
shows a replication of the classic typicality gradient from literature. For the concept ‘shark’, the great white (M = 6.7, SD = 2.3) is reliably judged more typical than the hooded carpet (M = 2.9, SD = 1.7) [t (55) = 11.627, p < 0.001, d = 1.88].
Figure 2. Mean rated typicality (with 95% confidence interval) for the concept ‘shark’, comparing two species.
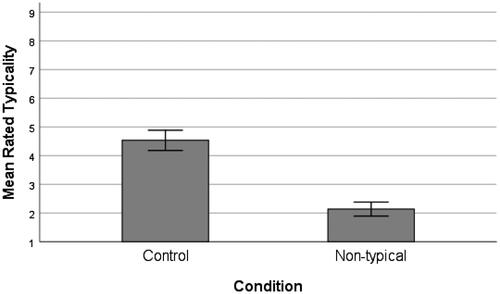
Flight safety events show the same pattern. shows the combined typicality ratings for all control target events, and all non-typical target events. The control events (M = 4.5, SD = 1.3) were judged more typical than the non-typical events (M = 2.1, SD = 0.89) [t (55) = 12.478, p < 0.001, d = 2.15]. This is the typicality gradient we tested.
Figure 3. The mean rated typicality (with 95% confidence interval) of the control events and the non-typical events.
Response accuracy
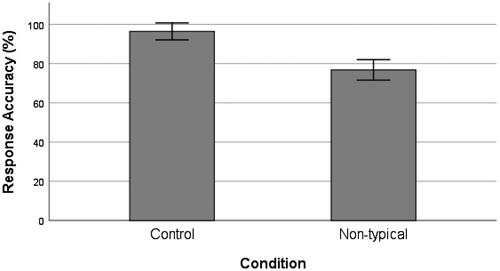
The response accuracy was significantly better in the control condition (M = 96.4%, SD 11.21) than the non-typical condition (M = 76.8%, SD = 13.49) [t (54) = 5.927, p < 0.001, d = 1.58], as shown in .
Figure 4. Mean response accuracy (percentage) for the control condition events and the non-typical events (with 95% confidence interval).
Response latency
The response latency was significantly longer in the non-typical condition (M = 45,276 ms, SD = 9934) than the control condition (M = 35,232 ms, SD = 11,808) [t (54) = 3.444, p < 0.001, d = 0.92], as shown in .
Figure 5. Mean response latency (milliseconds) for the control condition events and the non-typical events (with 95% confidence interval).
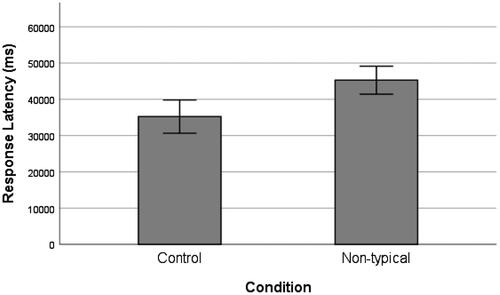
The non-typical experimental events recorded a lower mean rated typicality than the control events, providing a significant typicality gradient to test. Overall, the non-typical events elicited significantly less accurate response and significantly greater response latency, when compared to the control.
Discussion
In this study we tested a real-world typicality gradient and found that pilot response accuracy was reduced for non-typical events when compared to a random selection of events. Furthermore, response latency was greater for non-typical events, indicating that pilots are subject to cognitive disadvantages when encountering non-typical stimuli. This is evidence of the typicality effect (Rosch, Simpson, and Miller Citation1976), and it could be an important cognitive factor in aircraft accidents that involve delayed and inappropriate pilot response. We extend category theory to include the new facet of cognitive disadvantage to explain these results and contribute a new application of the theory in an applied environment.
Pilots experienced cognitive disadvantage when processing the non-typical events. This carries risk in real cockpit scenarios. Returning to the incident described in the opening paragraph, the crew at Jackson Hole encountered two unusual events simultaneously (NTSB (National Transportation Safety Board) Citation2012), and amidst significant temporal constraints, were unable to recognise one event and experienced delays managing the other. Such flight crew behaviour is, perhaps, best viewed as a corollary of the cognitive disadvantages inherent in an unfavourable typicality gradient. Non-typical events appear to take longer to process and have weaker connections to their response protocol. This could be a consequence of the high reliability of aircraft systems, for instance, with pilot knowledge weakening for events that are seldom encountered.
An immediate application of this principle could help understand the pilot response to Boeing 737-MAX flight control system malfunctions, that posed problems for both airline pilots and test pilots (United States House Committee on Transportation and Infrastructure Citation2020). Such non-typical events may warrant different training or education approaches, such as explicitly training event concepts, rather than a single exemplar (Clewley and Nixon Citation2022a), or specifically improving cockpit skills to foster better recognition of obscure, but difficult to manage faults. This could help mitigate the risk of such cognitively disadvantageous, troublesome events that may land in the laps of pilots following decisions taken in design, aircraft certification and training provision
The method used in this work offers rapid measurement of cognitive disadvantage and can locate key gradients that pose risk of decreased pilot performance. This could be used to improve pilot training, in-flight procedures, and checklist provision. Different events, or even groups of events, may have distinct typicality signatures, measurable as a gradient and cognitive disadvantage. In our sample the two ‘Flight Control’ events appeared to be more vulnerable to response error, and overall, the response accuracy dropped from 96.4% for the control events to 76.8% for the non-typical events. In the real-world this could mean a flight crew spend valuable time trying to retrieve an incorrect memory procedure or execute an incorrect checklist.
The temporal characteristics of pilot response should be seen in the context of response accuracy, as measured in this work. It is reasonable for pilots to take longer to process certain events, perhaps not seen for years (or ever), but there is an expectation that pilots will respond accurately without undue delay (see Clewley and Nixon Citation2022b, for recent discussion on the temporal characteristics of events). This longer response latency seen in the non-typical condition here may not always be evident in pilot proficiency tests, as events in training are often anticipated (Casner, Geven, and Williams Citation2013). Pilot response latency is, perhaps, nuanced, and many airline simulator instructors will be familiar with confused crews taking longer to make sub-optimal diagnoses.
Understanding susceptibility to cognitive disadvantage could encourage new approaches to pilot training. For example, training with an event exemplar (a single case), or a prototype (a best case), common in aircraft type ratings, may be insufficient for some event domains. Reporting the crash of an Airbus A330 in June 2009, following unreliable airspeed indications and an aerodynamic stall, the (BEA (Bureau d’Enquêtes et d’Analyses) Citation2012) noted that stall characteristics at high altitude in airliners have little correspondence to typical stalls in flight training. Drawing a comparison with sharks, training the great white shark case, the typical case, may serve well to recognise and respond to similar cognitive experiences, but will be inadequate for the non-typical carpetshark case. Likewise, training for typicality may leave pilots under-prepared for event diversity, and our results reinforce the findings of Casner, Geven, and Williams (Citation2013), that structural problems in airline pilot testing may contribute to narrow event knowledge.
Aircraft manufacturers and airlines could systematically assess pilot recognition and response across the range of events in the aircraft checklist. For example, key diagnostic cues seen in ‘Flight Control’ malfunction events could be presented to pilots with corresponding capture of response accuracy and latency. Events that prove troublesome for pilots (in this research, Rudder and Spoiler malfunctions) will be located, indicating where in-flight cognitive disadvantage is likely. We envisage this providing a heat map of cognitive disadvantage that indicates vulnerable and fragile knowledge and procedures (Clewley and Stupple Citation2015). Once identified, specific training improvements and interventions could be devised, or checklists refined (not necessarily expanded) to mitigate the disadvantage experienced by pilots. This can shed light into the dusty corners of the checklist and provide pilots with more recognition skills and response confidence. Event exotica, such as unusual malfunctions in sophisticated heading, airspeed, navigation and instrument systems, will occur, albeit infrequently, and the cognitive disadvantage is, no doubt, uncomfortable for pilots.
This method is amenable to digital application technology (‘apps’), so rapid, low-cost analysis of pilot knowledge is achievable without costly simulator time. Rated typicality gradients, response accuracy and response latency can be readily captured in portable device apps, for example. This technology could then also be used to build knowledge of non-typical events and cues, by providing accessible descriptions and animations, for example, strengthening conceptual knowledge. Such innovative new tools can supplement and potentially improve on the orthodoxy of simulator training and testing. This approach can be adapted to other safety critical environments of interest to ergonomics, such as firefighting, police and security operations, adverse stadium events, mining and medicine, where non-typical events surely pose significant human, social and economic risk.
Despite regular simulator training, pilots have difficulty connecting some events to the correct protocol or checklist, as evidenced in accident reports (BEA (Bureau d’Enquêtes et d’Analyses) Citation2012). Current models of training and checklist philosophy may not adequately prepare pilots for some events. The relationship between typicality and pilot performance will help expose vulnerable procedures. All events are not equal, pilot knowledge is contoured, and typicality gradients offer a description of this landscape.
There is scope to understand how multiple concurrent events may impact on pilot performance through aggregate gradients, as experienced by the crew at Jackson Hole. One application of this could address the difficulty pilots have recognising unstabilised approach to land events, where the crew fail to manage the aircraft energy and flight path according to safety criteria (Clewley and Stupple Citation2015). For example, certain combinations of factors could generate unfavourable aggregated typicality gradients that present recognition problems to the pilots. This is a possible explanation for the crash of an Asiana Boeing 777-200ER at San Francisco, USA, in 2013, where the crew were executing an approach to land that featured a clutch of uncommon characteristics, diverging significantly from typical approaches (NTSB Citation2014). Cognition may be geared to typicality, and combinations of non-typical factors could cumulatively pose recognition problems for pilots.
This still leaves open the question of why pilot ability to process and respond to non-typical events suffers a decrement. A further application of this work could identify events that are not amenable to prototype effects, such that there is no ‘best case’, or prototype, so are resistant to positive typicality benefits and inherently disadvantageous (for example, the concept of ‘supercomputer’ – see Osherson and Smith Citation1997). Some work environments, like the cockpit, may produce events that are difficult to define, with simulated encounters being either weak, inadequate, or even absent. These resistant event concepts will, perhaps, continue to pose challenges to pilot training and checklist provision. This may also explain difficulties experienced by test pilots in Boeing 737-MAX certification, recognising and responding to Manoeuvring Characteristics Augmentation System (MCAS) activation (United States House Committee on Transportation and Infrastructure Citation2020). Reducing some failures and malfunctions to recognisable, tractable scenarios that support pilot cognition is challenging. Training encounters may not capture the essence of real-world event variability. Some events, enigmatic and obscure, may fundamentally test pilot knowledge and training orthodoxy – a significant subset of flight safety events are non-typical. However, we feel optimistic that the theoretical apparatus we have discussed in this article and the new facet of category theory, ‘cognitive disadvantage’, offer ways to better understand a wider range of event presentation.
Naturally, this work has limitations. We have tested one aggregated typicality gradient here, involving four non-typical events from two checklist domains on one aircraft type. This serves as a platform to extend this work to different applications and domains of pilot knowledge. The events and pilot response profiles are not necessarily generalisable, and we encourage other events to be tested to further validate this approach. We acknowledge that the experimental stimuli were static, but we think this method is now suitable for simulator trials, to better understand how pilot behaviour is more widely influenced in the dynamic cockpit environment. It could also be fruitful to better understand the drivers of cognitive advantage – it may be significant influence of pilot behaviour in everyday flight operations and offer a window into effective cockpit performance.
In this article we have framed and measured cognitive disadvantage associated with the typicality effect. We have provided a method of testing typicality gradients, including aggregated gradients, and measuring related pilot performance. We have added key terms to the ergonomics lexicon, including cognitive disadvantage, aggregate typicality gradients and resistant event concepts. We have suggested innovations in pilot training that make use of this approach.
We conclude that non-typical events do pose problems for pilot cognition and that cognitive disadvantage can explain delayed or inappropriate pilot behaviour. Measuring the magnitude of cognitive disadvantage may allow rapid assessment of pilot knowledge and display event types that risk poor procedure and checklist compliance. This can indicate to manufacturers and airlines where to innovate pilot training, cockpit materials and checklists.
Disclosure statement
No potential conflict of interest was reported by the author(s).
References
- AIB (Aircraft Accident Investigation Bureau of Ethiopia). 2019. Aircraft Accident Investigation Preliminary Report: B737-8 (MAX) Registered ET-AVJ 28 NM South East of Addis Ababa, Bole International Airport. Addis Ababa: Aircraft Accident Investigation Bureau of Ethiopia.
- Barsalou, L.W. 1985. “Ideals, Central Tendency, and Frequency of Instantiation as Determinants of Graded Structure in Categories.” Journal of Experimental Psychology. Learning, Memory, and Cognition 11 (4): 629–654. doi:10.1037/0278-7393.11.1-4.629.
- Barsalou, L.W. 1987. “The Instability of Graded Structure: Implications for the Nature of Concepts.” In Concepts and Conceptual Development: Ecological and Intellectual Factors in Categorization, edited by U. Neisser, 101–140. Cambridge: Cambridge University Press.
- BEA (Bureau d’Enquêtes et d’Analyses). 2012. Final Report on the Accident 1st June 2009 to the Airbus A330-203 Registered F-GZCP Operated by Air France Flight AF447 Rio De Janeiro – Paris. Le Bourget: BEA.
- Cantor, N. 1981. “Perception of Situations: Situation Prototypes and Person-Situation Prototypes.” In Toward a Psychology of Situations, edited by D. Magnusson, 229–244. Mahwah, NJ: Lawrence Erlbaum.
- Cantor, N., W. Mischel, and J.C. Schwartz. 1982. “A Prototype Analysis of Psychological Situations.” Cognitive Psychology 14 (1): 45–77. doi:10.1016/0010-0285(82)90004-4.
- Casner, S.M., R.W. Geven, and K.T. Williams. 2013. “The Effectiveness of Airline Pilot Training for Abnormal Events.” Human Factors 55 (3): 477–485. doi:10.1177/0018720812466893.
- Clewley, R, and J. Nixon. 2019. “Understanding Pilot Response to Flight Safety Events Using Categorisation Theory.” Theoretical Issues in Ergonomics Science 20 (5): 572–589. doi:10.1080/1463922X.2019.1574929.
- Clewley, R, and J. Nixon. 2022a. “Penguins, Birds and Pilot Knowledge: can an Overlooked Attribute of Human Cognition Explain Our Most Puzzling Aircraft Accidents?” Human Factors 64 (4): 662–674. doi:10.1177/0018720820960877.
- Clewley, R, and J. Nixon. 2022b. “Now You See It, Now You Don’t: Dynamism Amplifies the Typicality Effect.” Cognition, Technology & Work 24 (3): 473–481. doi:10.1007/s10111-021-00686-9.
- Clewley, R, and E.J.N. Stupple. 2015. “The Vulnerability of Rules in Complex Work Environments: dynamism and Uncertainty Pose Problems for Cognition.” Ergonomics 58 (6): 935–941. doi:10.1080/00140139.2014.997804.
- Cohen, J. 1992. “A Power Primer.” Psychological Bulletin 112 (1): 155–159. doi:10.1037/0033-2909.112.1.155.
- Dry, M.J, and G. Storms. 2010. “Features of Graded Category Structure: Generalizing the Family Resemblance and Polymorphous Concept Models.” Acta Psychologica 133 (3): 244–255. doi:10.1016/j.actpsy.2009.12.005.
- Gore, J., R. Flin, N. Stanton, and W. Wong. 2015. “Applications for Naturalistic Decision Making.” Journal of Occupational and Organizational Psychology 88 (2): 223–230. doi:10.1111/joop.12121.
- Harnad, S. 2005. “To Cognize is to Categorize: Cognition is Categorization.” In Handbook of Categorization in Cognitive Science, edited by H. Cohen and C. Lefebvre, 19–43. Amsterdam: Elsevier.
- Hulme, A., N.A. Stanton, G.H. Walker, P. Waterson, and P.M. Salmon. 2021. “Complexity Theory in Accident Causation: using AcciMap to Identify the Systems Thinking Tenets in 11 Catastrophes.” Ergonomics 64 (7): 821–838. doi:10.1080/00140139.2020.1869321.
- IATA. 2013. Evidence-Based Training Implementation Guide. Montreal: International Air Transport Association.
- Iordan, M.C., M.R. Greene, D.M. Beck, and L. Fei-Fei. 2016. “Typicality Sharpens Category Representations in Object-Selective Cortex.” NeuroImage 134: 170–179. doi:10.1016/j.neuroimage.2016.04.012.
- JATR (Joint Authorities Technical Review). 2019. “Boeing 737 MAX Flight Control System.” https://www.boeing.com/commercial/737max/737-max-software-updates.page
- Klein, G. 2008. “Naturalistic Decision Making.” Human Factors 50 (3): 456–460. doi:10.1518/001872008X288385.
- Klein, G. 2015. “Reflections on Applications of Naturalistic Decision Making.” Journal of Occupational and Organizational Psychology 88 (2): 382–386. doi:10.1111/joop.12122.
- Klein, G., R. Calderwood, and A. Clinton-Cirocco. 1986. “Rapid Decision Making on the Fire Ground.” Proceedings of the Human Factors Society Annual Meeting 30 (6): 576–580. doi:10.1177/154193128603000616.
- KNKT (Komite Nasional Keselamatan Transportasi). 2019. Final Report: PT. Lion Mentari Airlines Boeing 737-8 (MAX); PK-LQP Tanjung Karawang, West Java, Republic of Indonesia 29 October 2018. Tanjung Karawang: Komite Nasional Keselamatan Transportasi.
- Lei, Y., F. Li, C. Long, P. Li, Q. Chen, Y. Ni, and H. Li. 2010. “How Does Typicality of Category Members Affect the Deductive Reasoning? An ERP Study.” Experimental Brain Research 204: 47–56. doi:10.1007/s00221-010-2292-5.
- NASA. 2005. “The Challenge of Aviation Emergency and Abnormal Situations - NASA/TM—2005–213462.” https://ntrs.nasa.gov/citations/20060023295
- Neisser, U. 1976. Cognition and Reality. London: Freeman.
- NTSB (National Transportation Safety Board). 2012. Runway Overrun American Airlines Flight 2253 Boeing 757-200, N668AA, Jackson Hole, Wyoming, December 29, 2010. Washington, DC: NTSB.
- NTSB (National Transportation Safety Board). 2014. Descent Below Visual Glidepath and Impact with Seawall, Asiana Airlines Flight 214, Boeing 777-200ER, HL7742, San Francisco, California July 6, 2013. Washington, DC: NTSB.
- Osherson, D, and E.E. Smith. 1997. “On Typicality and Vagueness.” Cognition 64 (2): 189–206. doi:10.1016/S0010-0277(97)00025-5.
- Pothos, E.M, and A.J. Wills. 2011. “Introduction.” In Formal Approaches in Categorization, edited by E.M. Pothos and A.J. Wills, 1–17. Cambridge: Cambridge University Press.
- Rogers, T.T., K. Patterson, E. Jefferies, and M.A. Lambon Ralph. 2015. “Disorders of Representation and Control in Semantic Cognition: Effects of Familiarity, Typicality, and Specificity.” Neuropsychologia 76: 220–239. doi:10.1016/j.neuropsychologia.2015.04.015.
- Rosch, E. 1973. “On the Internal Structure of Perceptual and Semantic Categories.” In Cognitive Development and the Acquisition of Language, edited by T.E. Moore, 111–144. New York: Academic Press.
- Rosch, E. 1975. “Cognitive Reference Points.” Cognitive Psychology 7 (4): 532–547. doi:10.1016/0010-0285(75)90021-3.
- Rosch, E. 1978. “Principles of Categorization.” In Cognition and Categorization, edited by E. Rosch & B.B. Lloyd, 27–48. Mahwah, NJ: Erlbaum.
- Rosch, E, and C.B. Mervis. 1975. “Family Resemblances: Studies in the Internal Structure of Categories.” Cognitive Psychology 7 (4): 573–605. doi:10.1016/0010-0285(75)90024-9.
- Rosch, E., C. Simpson, and R.S. Miller. 1976. “Structural Bases of Typicality Effects.” Journal of Experimental Psychology: Human Perception and Performance 2 (4): 491–502. doi:10.1037/0096-1523.2.4.491.
- Rothbart, M., N. Sriram, and C. Davis-Stitt. 1996. “The Retrieval of Typical and Atypical Category Members.” Journal of Experimental Social Psychology 32 (4): 309–336. doi:10.1006/jesp.1996.0015.
- Schnittker, R., S. Marshall, T. Horberry, K. Young, and G. Lintern. 2017. “Exploring Decision Pathways in Challenging Airway Management Episodes.” Journal of Cognitive Engineering and Decision Making 11 (4): 353–370. doi:10.1177/1555343417716843.
- Strauch, B. 2016. “Decision Errors and Accidents: Applying Naturalistic Decision Making to Accident Investigations.” Journal of Cognitive Engineering and Decision Making 10 (3): 281–290. doi:10.1177/1555343416654629.
- United States House Committee on Transportation and Infrastructure. 2020. “Final Committee Report: The Design, Development and Certification of the Boeing 737 MAX.” https://transportation.house.gov/imo/media/doc/2020.09.15%20FINAL%20737%20MAX%20Report%20for%20Public%20Release.pdf
- Wang, X., Y. Tao, T. Tempel, Y. Xu, S. Li, Y. Tian, and H. Li. 2016. “Categorization Method Affects the Typicality Effect: ERP Evidence from a Category-Inference Task.” Frontiers in Psychology 7 (JAN): 111–184. doi:10.3389/fpsyg.2016.00184.
- Weick, K. 1995. Sensemaking in Organizations. Thousand Oaks, CA: Sage.