
 ?Mathematical formulae have been encoded as MathML and are displayed in this HTML version using MathJax in order to improve their display. Uncheck the box to turn MathJax off. This feature requires Javascript. Click on a formula to zoom.
Abstract
For the ergonomic design of workplaces and products, a representative anthropometric dataset of the working-age population is needed. As body proportions are constantly changing and the latest publicly available dataset for Germany was published in 2004 (data collection period 1999–2002), the aim of this study was to create and publish an updated anthropometric dataset of the German working-age population. Within a regional epidemiological health study, 3D body scan data from 2313 subjects were collected and used to create an anthropometric dataset with a total of 39 ISO 7250-1 measures. To approximate the goal of generating representative values for Germany, the collected regional dataset was weighted with an algorithm, using values from a known nationally representative survey. Based on the weighted dataset, a gender stratified percentile table with values for the 5th, 50th, and 95th percentile was calculated.
Practitioner summary: Body proportions are constantly changing and the latest publicly available anthropometric dataset for Germany was published in 2004. A new dataset was created, using 3D body scans from an epidemiological health study and a weighting algorithm. Ultimately, percentile tables with values for the 5th, 50th, and 95th percentile are published.
1. Introduction
In an ergonomic design process, it is necessary to consider the anthropometric characteristics of the user group. Accordingly, in the work environment, a representative anthropometric dataset of the working-age population is needed for the ergonomic design of products (e.g. tools) and workplaces (Dewangan, Owary, and Datta Citation2008; Ghaderi, Maleki, and Dianat Citation2014). Moreover, this anthropometric dataset needs to be up-to-date, because body measures and proportions of humans are constantly changing (Gordon and Bradtmiller Citation2012; Hanson et al. Citation2009). The latest publicly available dataset of the German working-age population was published in 2004 by the Federal Institute for Occupational Safety and Health (BAuA) (Jürgens Citation2004). The data collection period was between 1999 and 2002. The results of this research project served as a basis for the current DIN 33402-2 (DIN Citation2020) and ISO/TR 7250-2 (ISO Citation2013) values. A recent study by Castellucci et al. (Citation2020) recommends the collection of anthropometric data in populations every decade. With this in mind, an update for the German working-age population seems reasonable.
Outdated anthropometric datasets are a common problem in the field of ergonomics (Garneau and Parkinson Citation2016). As mentioned in several studies (Pagano, Parkinson, and Reed Citation2015; Parkinson and Reed Citation2010; Vega et al. Citation2021), the generation and maintenance of accurate and comprehensive anthropometric data is time-consuming and expensive, which makes it difficult to ensure up-to-date data. The traditional method to gather an anthropometric dataset involves a qualified and experienced anthropologist, who uses various tools (e.g. anthropometer or beam caliper) to collect body measures from different subjects (this method is hereafter referred to as ‘manual measurement’). This method, described in ISO 7250-1 (ISO Citation2017), is a time-consuming procedure. The advancing technological development of 3D body scanners allows the collection of high-resolution three-dimensional images of the human body in a short time. Standards for handling and evaluating 3D body scans are documented in ISO 15535 (ISO Citation2012), ISO 15536 (ISO Citation2005, Citation2007), and ISO 20685-1 (ISO Citation2018). The advantages of 3D body scanners have been recognised by anthropometric surveys (Gordon et al. Citation2014; Treleaven Citation2004) and are increasingly used in the medical field (Haleem and Javaid Citation2019).
In 2013 the BAuA started a cooperation with an already existing epidemiological health study in north-east Germany to gather 3D body scan data. This kind of cooperation seems reasonable, as 3D body scan images are relevant for scientists from different research fields. From a medical perspective, the data can be used to identify health-related risk factors (Ng et al. Citation2016; Treleaven and Wells Citation2007). However, the same scan images can be used to generate anthropometric datasets for the utilisation in an ergonomic setting. Another advantage of this cooperation was the possibility to use the already available infrastructure from the epidemiological health study to gather a large amount of anthropometric measures from many subjects with only minor changes in their study design.
Different aspects and constraints which have to be considered in this type of study design have already been described in other publications: Bonin, Radke, and Wischniewski (Citation2019) focussed on the data collection and processing methodology as well as the quality assurance process. The validity of anthropometric measures extracted from 3D body scans was investigated in the study by Bonin et al. (Citation2020). The current publication addresses the fact that the epidemiological health study drew a regional sample. Consequently, the collected anthropometric dataset was not representative of the entire country.
The aim of this publication was to create and publish an updated anthropometric dataset of the German working-age population. Therefore, a weighting algorithm was utilised to approximate the goal of generating representative values for Germany. The weighted dataset was used to calculate a gender stratified percentile table.
2. Methods
2.1. Sampling method and subjects
The 3D body scans were collected within the Study of Health in Pomerania (SHIP). SHIP is a population-based epidemiological health study in north-east Germany, conducted by the University Medicine Greifswald (John et al. Citation2001; Völzke et al. Citation2011, Citation2015, Citation2022). Over the past 25 years, participants were examined in two longitudinal cohorts: SHIP and SHIP-Trend. Inclusion criteria were the reported main residence in the study region, an age between 20 and 79 years, and a German citizenship. The exclusion criterion for SHIP-Trend was the participation in SHIP. To ensure comparability, the quality assurance process, infrastructure, materials, and 3D body scan positions were identical in both cohorts. The SHIP study design was approved by the local ethics committee at the University Medicine Greifswald.
For this study, the body scan data of 1600 subjects from the third SHIP follow-up (SHIP-3, 2014–2016) and 2393 subjects from the first SHIP-Trend follow-up (SHIP-Trend-1, 2016–2019) were available (To avoid misunderstandings, given the discrepancy between the collection period in SHIP and the actuality of the final weighted dataset, readers are reffered to section 2.5.1 at this point). As the scope of the current investigation was the working-age population, only subjects between 18 and 67 years were considered. Due to the follow-up character of both cohorts, the youngest subject was 28 years of age. Overall, 2981 out of the 3993 available subjects from SHIP-3 and SHIP-Trend-1 were within the defined age range.
Further, only subjects with a complete dataset were considered. Hence, an additional 668 subjects were excluded during the quality assurance process due to missing values, irregularities on the scan image, interfering medical aids, or implausible extreme values. Finally, N = 2313 subjects (1152 = women, 1161 = men) within an age range of 28–67 years were eligible for this study (see ).
Table 1. Sample characterisation.
2.2. Procedure
A Vitus Smart XXL Body Scanner (Avalution GmbH, Kaiserslautern, Germany) was used to gather the 3D body scans. The scanner fulfills the conditions of the evaluation protocol from Kouchi et al. (Citation2012), which served as the basis for ISO 20685-2 (ISO Citation2015). A body scale (Seca 635, Seca GmbH & Co. KG, Hamburg, Germany) was integrated into the floor of the 3D scanner to determine body mass. The 3D whole-body scanner was calibrated daily. A precision test with calibrated weights was carried out every day to check the body scale. For the current study, three body scans per subject were necessary, one in a sitting position and two in different standing positions (see ). The subjects’ clothing was ISO 20685-1 compliant.
Figure 1. Anonymized sample scan image of the three different body postures (for better visualisation smoothed 3D scans are shown). Positions (a,b) are based on the recommendations, presented in ISO 20685-1; (c) is the standard scan position from the SHIP methodology.
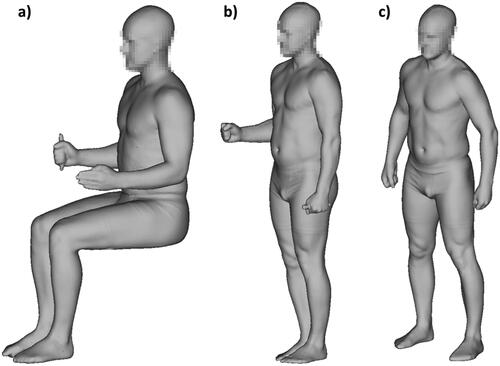
The scan positions (a) and (b) are based on the recommendations, presented in ISO 20685-1. From these scans, the anthropometric measures were extracted in a post-processing procedure by manually identifying landmarks on the scan image, using the proprietary software Anthroscan (version 3.0.7, Avalution GmbH, Kaiserslautern, Germany). This procedure is further referred to as ‘reading’ and the executing employees as ‘reader’. Overall, six readers were certified for SHIP-3, three of them continued in SHIP-Trend-1 in addition to four newly certified readers. A more comprehensive explanation of the reading process can be found in Bonin, Radke, and Wischniewski (Citation2019). Scan position (c) is the standard scan from the SHIP study design, with automatic measure extraction, using the Anthroscan software. A detailed description of all body scan positions can be found in . The employees who carried out the body scan examination on-site are hereafter referred to as ‘examiners’. Five examiners were involved in SHIP-3, and four of them proceeded in SHIP-Trend-1.
Table 2. Detailed description of the different body scan positions.
2.3. Body measures
This study uses a 3D whole-body scanner to collect anthropometric data for ergonomic design processes in the work environment. Therefore, the selection of relevant measures was based on ISO 7250-1 and ISO 20685-1. Besides the demographic parameters of age and gender, 32 anthropometric measures, defined in ISO 7250-1, were extracted from body scan positions (a) and (b). Another seven measures were gathered from position (c). In addition, the measured body mass was included in the dataset. As recommended in ISO 20685-1, detailed measures of the hand, head, and foot were not considered. Three anthropometric measures, which can be collected with a 3D whole-body scanner according to ISO 20685-1, had to be excluded (see ).
Table 3. Excluded anthropometric measures.
In summary, 40 anthropometric measures were considered in this investigation, 39 of them can be allocated to an ISO 7250-1 measure (see ). In line with ISO/TR 7250-2, values from the right side of the body are presented in this paper, whenever it is possible.
Table 4. Anthropometric measures.
2.4. Quality assurance
Standard operating procedures (SOP) were defined to ensure the highest possible degree of standardisation and data quality during the entire data collection, processing, and analysis. Quality assurance involved several tasks, including the evaluation of inter- and intra-reader differences. To minimise errors, examiners and readers were trained and certified on a regular basis and readers had to attend body scan examinations at least during their initial training. Furthermore, time trends in the reading process were monitored. With the help of descriptive statistics, plausibility limits were defined to identify extreme values within the reading process. Values outside the plausibility limits were checked manually using the 3D scan images and subsequently declared as either erroneous and deleted or verified as plausible. In general, irregularities and abnormalities were documented in a standardised form using electronic case report forms. A more detailed description of the reading process and its evaluation can be found in Bonin, Radke, and Wischniewski (Citation2019).
The body scan values were initially compared with values collected via manual measurements in a validation study. For this validation, a subsample of 44 subjects from SHIP-Trend-1 was utilised. The body scans were performed by the trained examiners. To avoid a reader effect, one single reader performed the reading process. The same reader was trained for the manual measurement and performed both examinations for the entire subsample. The manual measurement took place immediately after the body scan examination. A summary of the results can be found in and Bonin et al. (Citation2020).
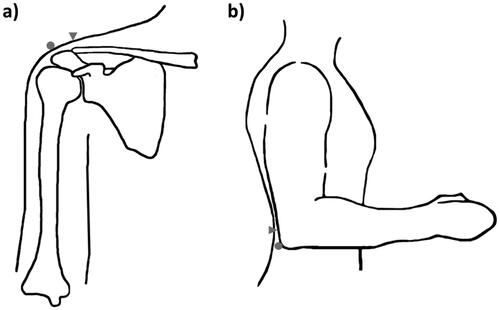
During the validation study, systematic differences in the landmarking methodology between the SHIP SOP and ISO 7250-1 were analysed. In ISO 7250-1 the acromion is described as the most lateral point of the lateral edge of the acromial process and the olecranon as the rearmost point of the 90° flexed elbow. In the SHIP reading procedure, the acromion was identified as the most superior bony point, lateral from the midaxillary line (often the acromioclavicular joint). Olecranon was identified as the rearmost point of the 90° flexed elbow, midline of the forearm, including soft tissue (see ).
Figure 2. Visualisation (not true to scale) of different landmarking methodologies in ISO 7250-1 (dots) and the SHIP reading procedure (triangles) for the (a) acromion and (b) olecranon (own drawing).
Since it was not possible to change the landmark definitions in the SHIP SOP and seven anthropometric measures rely on these landmarks, offsets were calculated to approximate an ISO 7250-1 compliant landmarking (hereafter referred to as ‘landmarking offsets’). In practice, these seven measures were gathered twice from each subject of the subsample: the first time in accordance with the landmark definition of ISO 7250-1, and the second time according to the landmark definition of the SHIP SOP. To account for different body sizes the landmarking offsets were calculated as the relative difference between the two landmark definitions, separately for women and men. To clarify these landmarking offset calculation equations are presented below, using the measure shoulder height as an example. First, the anthropometric measure is collected from a subject , using an anthropometer and the ISO 7250-1 landmark definition. The acquired value is declared as
in this example. Subsequently, the process is repeated, this time using the landmark definition of the SHIP SOP. The acquired value is declared as
The difference between
and
is calculated, relative to
:
This is repeated with subjects of the validation study. Afterwards, the mean
and standard deviation
can be calculated from the
subjects:
The mean defines the landmarking offset value for the corresponding measure and gender. Given a subject from the study sample (N = 2313) with a value
an ISO 7250-1 landmark compliant measure is approximated using the following equation:
This procedure was repeated for each subject (N = 2313), to calculate the percentiles of the offset corrected anthropometric measure afterwards (all corrected measures are marked with suffix ‘_off’ in and ).
In addition to the landmark definitions, there was a systematic difference between SHIP and ISO 7250-1 concerning the measuring rod. In ISO 7250-1 a diameter of 20 mm is defined. In SHIP the measures fist (grip axis) height and elbow-grip length were gathered, using a measuring rod with a diameter of 29 mm. This causes a systematic difference of 4.5 mm between a SHIP and an ISO 7250-1 compliant value. As the aim of this study was to collect ISO 7250-1 conform values, this difference was considered in all calculations and presented percentile values.
2.5. Data weighting
As the SHIP study represents a regional sample, the gathered dataset was weighted with data from a nationally representative survey to compensate for regional variations.
2.5.1. Reference dataset
The Study on the health of adults in Germany (DEGS), carried out by the Robert Koch Institute, provides a representative dataset of the German population (Scheidt-Nave et al. Citation2012). The target population includes adults aged between 18 and 79 years with a permanent residence in Germany according to local population registries. The first survey wave (DEGS1) was conducted between 2008 and 2011 and gathered data from 5626 subjects (2955 = women, 2671 = men) between 18 and 67 years. Accordingly, the actuality of the computed weighted SHIP dataset corresponds to this time period. Within the framework of DEGS1 a two-phase stratified (cluster) sample strategy was chosen and weighting coefficients were calculated to ensure the representativeness of the dataset (Kamtsiuris et al. Citation2013). The anthropometric measures of stature, body mass, hip circumference, and waist circumference were collected. Thus, DEGS1 provides publicly available and nationwide representative data for these four measures and is appropriate for the utilisation as a reference dataset. For the weighting algorithm employed in this study, the measures of stature, body mass, and body mass index (BMI) were considered as weighting parameters.
2.5.2. Weighting algorithm
An iterative proportional fitting (IPF) algorithm was used to determine optimised, cumulative weighting coefficients , based on predefined weighting parameters. The R package survey (Lumley Citation2020) with the rake function was utilised to perform this computation. Three input parameters are required for this function:
survey design object,
sample margins, and
population margins.
In the beginning, an unweighted survey design object was created for the calculations, which initially contained the unweighted SHIP dataset. Afterwards, all associated parameters and calculations were stored in this survey design object. The essential columns used for weighting were defined via the sample margins parameter. In this parameter, the relative frequency of occurrence of all values was determined and stored in a frequency table. The parameter population margins contained the relative frequency of occurrence of the weighting parameters from the reference dataset in the form of a frequency table.
To create reliable weighting coefficients, for each value within the frequency table of the sample margins parameter, there must be a corresponding equivalent within the frequency table of the population margins parameter. To obtain the best matching frequency tables, it was necessary to round the values of both datasets to the nearest integer values (in cm for length, breadth, and circumference measures; in kg for body mass). There is a possibility to activate the option partial = True within the rake function to ignore missing counterparts within the frequency tables. But in this case, those ignored entries would lead to a miscalculation of the weighted percentile tables. Therefore, this option was not used in this analysis. To execute the weighting algorithm despite gaps, the maximum range of corresponding values without gaps in both frequency tables was determined as boundaries for a confidence interval of reliable information. For values below and above these boundaries, a temporary ‘cut-off’ dataset was created, in which the values outside the confidence interval were substituted with the min and max values of the boundaries. It is important to note that due to this modification, the generated dataset and subsequent calculation of percentile values is only meaningful within the determined boundaries. To account for the limited data quality at the edges of the source data, only values between the 5th and 95th percentiles were recognised as reliable within the current study, even if the boundaries would allow a slightly wider percentile range.
The value of an individual weighting coefficient is initially only limited by the condition:
Nevertheless, in case of very high or very low values, it needs to be analysed if
still represents a reasonable value without overcorrecting the individual anthropometric value. Therefore, the survey package provides the trimWeights function for limiting the minimum and maximum value of
If the value exceeds or undercuts the defined thresholds,
is set to the respective limit value. The difference between the limit value and the original calculated value is divided equally among the remaining weighting coefficients. After analysis of the relative distribution frequencies and isolated outliers, the threshold values for the trimWeights function were set to 0.01 and 5
. This corridor is comparable with the values used in DEGS1.
In numerous pre-tests different weighting parameters (stature and BMI or stature and body mass) and configurations (with or without trimWeights function) were evaluated. Weighting with the measures of stature and body mass with activated trimWeights function led to the best results (even distribution of weighting coefficients and lowest number of outliers) and was therefore used for the final weighting procedure (see sections 3.1 and 4.2).
2.6. Statistical analysis
All statistical analyses and plots were performed using R (R Core Team Citation2021). For the unweighted SHIP dataset, the basic function quantile was used to calculate the percentile values. To compute percentile values of the weighted SHIP dataset, the function wtd.quantile from the R package Hmisc (Harrell Citation2020) was used. In accordance with ergonomic and anthropometric standards, the 5th, 50th, and 95th percentiles were calculated for each anthropometric measure.
3. Results
3.1. Data weighting
To approximate the goal of generating a representative dataset for Germany, the regional SHIP dataset was weighted with an algorithm. shows the minima, maxima, means, and sums of the weighting coefficients for different weighting parameters and configurations evaluated in the pre-tests.
Table 5. Descriptive parameters of the weighting coefficients calculated within the algorithm for different weighting parameters and configurations.
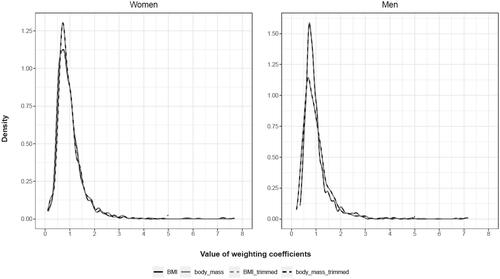
shows the relative frequency distribution of the weighting coefficients for the aforementioned combinations.
Figure 3. Density plots of the weighting coefficients calculated within the algorithm. Comparison between different weighting parameters and configurations. Combination options: BMI = Stature + body mass index without trimmed weights (black solid line); body_mass = Stature + body mass without trimmed weights (grey solid line); BMI_trimmed = Stature + body mass index with trimmed weights (grey dashed line); body_mass_trimmed = Stature + body mass with trimmed weights (black dashed line).
shows the comparison of matching anthropometric measures from DEGS1, the unweighted SHIP dataset, and the weighted SHIP dataset. Thus, this table enables a qualitative evaluation of the weighting algorithm.
Table 6. Comparison of the 5th (P5), 50th (P50), and 95th (P95) percentile values between the DEGS1 dataset (D1), the unweighted SHIP dataset (S), and the weighted (Sw) SHIP dataset (all measures in mm, except for body mass given in kg; all measures rounded to the nearest 10 mm or 1 kg value to ensure comparability with the weighted SHIP dataset).
3.2. Percentile table
3.2.1. Unweighted results
shows the calculated percentile values for the unweighted SHIP dataset, including the measures calculated via landmarking offsets to compensate for systematic methodological differences in landmarking between ISO 7250-1 and SHIP. Consequently, the percentile values presented in this table are based on the measured values from the regional SHIP sample.
Table 7. Percentile table of the unweighted SHIP dataset with values for the 5th (P5), 50th (P50), and 95th (P95) percentile (all measures in mm, except for body mass given in kg; all measures rounded to the nearest 1 mm or 0.1 kg value).
3.2.2. Weighted results
shows the calculated percentile values for the weighted SHIP dataset, including the measures calculated via landmarking offsets to compensate for systematic methodological differences in landmarking between ISO 7250-1 and SHIP. Accordingly, the values presented in this final percentile table aim to approximate nationally representative values.
Table 8. Percentile table of the weighted SHIP dataset with values for the 5th (P5), 50th (P50), and 95th (P95) percentile (all measures in mm, except for body mass given in kg; all measures rounded to the nearest 10 mm or 1 kg value).
4. Discussion
The cooperation with an ongoing regional epidemiological health study and the utilisation of a 3D body scanner provided an efficient way to gather anthropometric data. Using the existing infrastructure, it was possible to acquire data from many subjects with only minor changes in the SHIP study design. In total, the time required for the body scan examination was ∼15 min per subject. An additional 10 min were needed for the manual reading process. Taking into account the number of extracted anthropometric measures, this measurement procedure was most likely less time-consuming than a manual measurement, especially for the subjects, as they did not have to be present during the manual reading process.
The fundamental methodological approach of this study could be transferred to other populations in other countries. Considering the fact that conducting a nationwide anthropometric survey is expensive and time-consuming, the current study provides an alternative approach to generate a comprehensive anthropometric dataset with less cost and less effort. Cooperating with a (regional) public health study is beneficial for both sides, as the 3D scans can be used in the medical field for a variety of research questions (Ng et al. Citation2016; Treleaven and Wells Citation2007). Moreover, many countries conduct some kind of nationwide public health survey (e.g. the ‘National Health and Nutrition Examination Survey’ in the USA), collecting the anthropometric measures of stature and body mass. Such data can be used as a reference within the weighting algorithm and thus, the prerequisites for the methodological approach of this study are reachable in many cases.
4.1. 3D body scan measurement vs. manual measurement
Although the body scanner fulfilled the conditions of the evaluation protocol from Kouchi et al. (Citation2012) and the inter- and intra-reader reliability throughout the digital reading process was on a high level (Bonin, Radke, and Wischniewski Citation2019), the differences in values between 3D body scanner and the manual measurement exceeded the ISO 20685-1 validation tolerances for the vast majority of anthropometric measures (see ). The subject's clothing was ISO 20685-1 compliant and body postures, as well as breathing conditions during the scanning procedure, were based on recommendations from ISO 20685-1.
Besides several other known issues like slightly different posture or compressed hair underneath the bathing cap, the most likely main cause for the results of the validation study is the different identification of anatomical landmarks. Landmarking errors are known to have a large impact on comparability (Kouchi and Mochimaru Citation2011) between measures in general. This is particularly evident in the comparison of manual measures vs. scan-derived measures as the palpation of prominent anatomic landmarks (e.g. spina iliaca anterior superior) is not possible during the landmark identification on a computer. Moreover, the body scanner used in this study was not capable of detecting colourised landmarks on the subject’s skin and the limited timeframe within the SHIP methodology restricted the application of physical markers for each landmark.
Eventually, the calculated differences between the 3D body scan measurement and the manual measurement are comparable with the results from other validation studies (Han, Nam, and Choi Citation2010; Koepke et al. Citation2017).
4.2. Data weighting
In numerous pre-tests, several weighting options with different weighting parameters and configurations were tested to ensure the best possible results (see and ). Evaluating the relative frequency distributions of the calculated weighting coefficients and performing an extreme value analysis led to the final combination. An even distribution of the weighting coefficients paired with the lowest number of outliers was achieved with the weighting parameters stature and body mass with activated trimWeights function. The qualitative evaluation of the weighting algorithm, based on comparable anthropometric measures between DEGS1 data, unweighted SHIP data, and weighted SHIP data (see ), showed plausible changes, indicating an already good composition of the sample structure in SHIP and a reasonable performance of the algorithm.
However, it is remarkable that the weighting coefficients count equally for all measures of a subject. Thereby, the influence of the weighting coefficients on the respective percentile values differs, due to different body compositions. While some measures show a clearly visible effect after the weighting procedure, other parameters only show effects within the range of rounding inaccuracies (see and ).
4.3. Limitations
This study has several limitations that must be taken into account when using the percentile data.
4.3.1. Exclusion of anthropometric measures
ISO 7250-1 defines basic human body measures for technological designs in the ergonomic field. However, in accordance with the recommendations of ISO 20685-1, only body measures suitable for the collection with a 3D whole-body scanner were gathered in this study. Detailed measures of the hand, head, and foot were not calculated. Furthermore, crotch height, thorax depth, and chest circumference had to be excluded from the dataset.
This leads to a limited usability for practitioners whenever these anthropometric measures are required in a design process. Nevertheless, 39 essential measures from ISO 7250-1 could be gathered, which is sufficient for many important use cases [e.g. seated office workstation with visual display terminals (Gordon Citation2002)].
4.3.2. Data collection in an ongoing epidemiological follow-up study
Because SHIP-3 and SHIP-Trend-1 are follow-up examinations, it was not possible to influence the composition of the sample, resulting in the youngest subject being 28 years of age (see section 2.1). Concerning the anthropometric measures, the predefined sample led to gaps at the distribution edges. In addition, due to the follow-up character of SHIP-3 and SHIP-Trend-1, the sample size could not be influenced.
Moreover, inclusion criteria in SHIP could not be changed. Hence, inclusion criteria in SHIP and DEGS1 were not the same and the composition of the populations differed, concerning the inclusion of people from other nations. Overall, 27% of people in Germany have a migration background and approximately half of them have German citizenship (Demographie Portal Citation2020). Only the proportion with a German citizenship was included in SHIP. Therefore, SHIP provides a good basis but since people with other citizenships work in Germany as well, this inclusion criterion was a limitation for the current study. However, persons of other nations are generally considered in the final weighted dataset, as the inclusion criterion in DEGS1 was only a permanent residence in Germany (see section 2.5.1). Consequently, people with a migration background and other citizenship [∼13% of the population in Germany (Statista Citation2021)] were considered within the weighting procedure.
4.3.3. Data weighting
For the used weighting algorithm, the anthropometric measures were rounded to the nearest 10 mm or 1 kg value to enable reliable weighted data. Due to data gaps at the edges of the distribution in the predefined SHIP sample, only data between the 5th and 95th percentile were defined as reliable. This limitation is necessary unless supplementary data are available. Further, DEGS1 was conducted between 2008 and 2011. Therefore, the approximation to the given body proportions of the German working-age population is currently only valid for this time period, unless newer DEGS survey data is available.
4.3.4. Offset calculation
SHIP values of the measured shoulder (biacromial) breadth were systematically lower than expected, due to different landmarking methodologies in SHIP SOP and ISO 7250-1 (see section 2.4 and ). However, even when adding the calculated landmarking offset, the values were still substantially low compared to nearby measures, e.g. shoulder (bideltoid) breadth. Because the measured shoulder (biacromial) breadth showed also quality-relevant abnormalities in the quality assurance process, this measure should not be used and instead be substituted by surrounding measures.
4.4. Percentile table for the German working-age population and comparison with latest dataset
The weighted SHIP dataset, presented as percentile table (see ), aims to provide an approximation of nationally representative values. Despite the limitations mentioned above, the percentile table seems acceptable for the integration in the ergonomic design process of workplaces and products. However, it is necessary to check whether the maximum errors (e.g. the differences from the validation study) could influence the design measures to an extent that would result in safety-relevant deviations. For example, if the calculated safety ranges for arm reach erroneously turn out to be smaller than required in reality. Regarding this topic, special attention must be paid to the seven measures with a landmarking offset calculation (see section 2.4 and ). These measures have two values for each percentile, a SHIP value and an offset value (see and ). If one of those seven measures is used in a safety-relevant context, a worst-case scenario should be considered. For example, for safety ranges the greater value should be used, for the positioning of an emergency stop switch, the smaller value.
The ISO 20685-1 validation tolerances were exceeded for the vast majority of anthropometric measures within the validation study. Thus, a longitudinal comparison with previous anthropometric datasets (e.g. Jürgens Citation2004), which used the manual measuring method described in ISO 7250-1, to investigate time trends for individual anthropometric measures is problematic. Differences could be due to anthropometric changes in the population or due to differences between the measuring methods.
Since a calibrated body scale was used in SHIP (see section 2.2), at least a comparison for body mass is feasible. Compared to the values presented in Jürgens (Citation2004), the changes are mainly located in the upper percentiles starting from the 50th percentile upwards, in both genders. A weight gain of 12 kg for women and men at the 95th percentile can be observed, which corresponds to a relative change of 13.8% for women and 12% for men. Notwithstanding the above-mentioned uncertainty, some changes are discernible, which are in line with the increase in body mass and cannot be based exclusively on deviations between the individual measurement methods. The new data show a noteworthy increase in breadth, depth, and circumference measures (which exceed the maximum observed methodical error from the validation study by far). The values of the 5th percentile show the smallest changes for both genders, followed by moderate changes in the 50th percentiles and an over-proportional increase of the values within the 95th percentiles. This leads to the assumption, that designers should take these changes into account when designing products and workplaces.
From a user perspective, on the one hand, the error values from the validation study and the measures with a landmarking offset calculation hinder the usability of the presented percentile values to a certain degree, as the user needs to consider these aspects in the design process. On the other hand, the newly generated dataset is substantially more up-to-date, and the changes in width, depth, and circumference measures are noticeably increased—even under consideration of possible measuring errors—which promotes the usability in design processes.
5. Conclusion and future directions
This publication provides a percentile table with anthropometric data for the German working-age population. Moreover, the methodology for a weighting algorithm was presented, which allows the approximation of nationally representative values, based on a regional sample. For this study representative values from DEGS1 were used (data collection between 2008 and 2011). While addressing the limitations, the calculated percentile table should be incorporated into the ergonomic design process of products and workplaces.
In a follow-up project, the BAuA continues to collect 3D body scan data, especially to close the gaps at the partially incomplete distribution edges, to be able to weight the data in a meaningful higher level of detail, even below the 5th percentile and above the 95th percentile. Moreover, a new 3D whole-body scanner now offers the possibility to capture colourised landmarks on the subject’s skin, which can be identified in the subsequent manual reading process. Thus, a major source of error (landmarking errors; Kouchi and Mochimaru Citation2011) might be eliminated within the future project.
In addition to the univariate utilisation of datasets via percentile tables, multivariate analyses can be performed using anthropometric datasets with raw data. These analyses are capable of considering several combined anthropometric measures simultaneously (Dianat, Molenbroek, and Castellucci Citation2018; OPEN Design Lab Citation2021). However, the raw data from SHIP cannot be published due to data usage regulations. Therefore, the authors developed an algorithm that allows the synthesis of a virtual dataset (Wischniewski, Bonin, and Grötsch Citation2015; Wischniewski et al. Citation2017). Compared to the original dataset the virtual dataset is statistically almost identical but can be used without any privacy concerns. Hence, another publication is in progress, which will describe the methodology for the synthesis and a subsequent multivariate validation extensively. Furthermore, the virtual raw data will be presented to ensure a more holistic utilisation of the SHIP dataset.
Acknowledgements
We thank all SHIP examiners and readers. Special thanks go to Sabrina Geng from the Institute for Community Medicine-SHIP/KEF, University Medicine Greifswald, Germany, for the implementation of the validation study. We thank the Robert Koch Institute for providing the anthropocentric data from DEGS1.
Disclosure statement
No potential conflict of interest was reported by the author(s).
Correction Statement
This article has been republished with minor changes. These changes do not impact the academic content of the article.
Additional information
Funding
References
- Bonin, D., D. Radke, and S. Wischniewski. 2019. “Gathering 3D Body Surface Scans and Anthropometric Data as Part of an Epidemiological Health Study – Method and Results.” Paper Presented at the Proceedings of the 20th Congress of the International Ergonomics Association (IEA 2018). Volume V: Human Simulation and Virtual Environments, Work With Computing Systems (WWCS), Process Control, Florence, August 26–30. doi:10.1007/978-3-319-96077-7_14.
- Bonin, D., S. Wischniewski, M. Peters, and D. Radke. 2020. “Anthropometric Measure Extraction and Offset Calculation for 3D Body Scan Data, Obtained from an Epidemiological Health Study.” Paper Presented at the Proceedings of the 6th International Digital Human Modeling (DHM) Symposium, Skövde, August 31–September 2. doi:10.3233/ATDE200004.
- Castellucci, H., C. Viviani, P. Arezes, J.F. Molenbroek, M. Martínez, V. Aparici, and I. Dianat. 2020. “Applied Anthropometry for Common Industrial Settings Design: Working and Ideal Manual Handling Heights.” International Journal of Industrial Ergonomics. 78: 102963. doi:10.1016/j.ergon.2020.102963.
- Demographie Portal. 2020. “Bevölkerung mit Migrationshintergrund.” Accessed August 9, 2022. https://www.demografie-portal.de/DE/Fakten/bevoelkerung-migrationshintergrund.html
- Dewangan, K., C. Owary, and R. Datta. 2008. “Anthropometric Data of Female Farm Workers from North Eastern India and Design of Hand Tools of the Hilly Region.” International Journal of Industrial Ergonomics. 38 (1): 90–100. doi:10.1016/j.ergon.2007.09.004.
- Dianat, I., J. Molenbroek, and H.I. Castellucci. 2018. “A Review of the Methodology and Applications of Anthropometry in Ergonomics and Product Design.” Ergonomics 61 (12): 1696–1720. doi:10.1080/00140139.2018.1502817.
- DIN. 2020. 33402-2:2020 Ergonomics – Human Body Dimensions – Part 2: Values. Berlin: Beuth.
- Garneau, C.J., and M.B. Parkinson. 2016. “A Survey of Anthropometry and Physical Accommodation in Ergonomics Curricula.” Ergonomics 59 (1): 143–154. doi:10.1080/00140139.2015.1052853.
- Ghaderi, E., A. Maleki, and I. Dianat. 2014. “Design of Combine Harvester Seat Based on Anthropometric Data of Iranian Operators.” International Journal of Industrial Ergonomics 44 (6): 810–816. doi:10.1016/j.ergon.2014.10.003.
- Gordon, C. 2002. “Multivariate Anthropometric Models for Seated Workstation Design.” In Contemporary Ergonomics, edited by P.T. McCabe, 582–589. Taylor & Francis.
- Gordon, C.C., C.L. Blackwell, B. Bradtmiller, J.L. Parham, P. Barrientos, S.P. Paquette, B. Corner, J. Carson, J. Venezia, B.M. Rockwell, M. Mucher, and S. Kristensen. 2014. “2012 Anthropometric Survey of US Army Personnel: Methods and Summary Statistics.” Accessed March 29, 2021. https://apps.dtic.mil/sti/citations/ADA611869
- Gordon, C.C., and B. Bradtmiller. 2012. “Anthropometric Change: Implications for Office Ergonomics.” Work 41: 4606–4611. doi:10.3233/WOR-2012-0076-4606.
- Haleem, A., and M. Javaid. 2019. “3D Scanning Applications in Medical Field: A Literature-Based Review.” Clinical Epidemiology and Global Health 7 (2): 199–210. doi:10.1016/j.cegh.2018.05.006.
- Han, H., Y. Nam, and K. Choi. 2010. “Comparative Analysis of 3D Body Scan Measurements and Manual Measurements of Size Korea Adult Females.” International Journal of Industrial Ergonomics 40 (5): 530–540. doi:10.1016/j.ergon.2010.06.002.
- Hanson, L., L. Sperling, G. Gard, S. Ipsen, and C.O. Vergara. 2009. “Swedish Anthropometrics for Product and Workplace Design.” Applied Ergonomics 40 (4): 797–806. doi:10.1016/j.apergo.2008.08.007.
- Harrell, F.E. 2020. Hmisc: Harrell Miscellaneous. R package version 4.5-0.
- ISO. 2005. 15536-1:2005 Ergonomics – Computer Manikins and Body Templates – Part 1: General Requirements. Geneva: International Organization for Standardization.
- ISO. 2007. 15536-2:2007 Ergonomics – Computer Manikins and Body Templates – Part 2: Verification of Functions and Validation of Dimensions for Computer Manikin Systems. Geneva: International Organization for Standardization.
- ISO. 2012. 15535:2012 General Requirements for Establishing Anthropometric Databases. Geneva: International Organization for Standardization.
- ISO. 2013. 7250-2:2010 + Amd 1:2013 Basic Human Body Measurements for Technological Design – Part 2: Statistical Summaries of Body Measurements from National Populations. Geneva: International Organization for Standardization.
- ISO. 2015. 20685-2:2015 Ergonomics – 3-D Scanning Methodologies for Internationally Compatible Anthropometric Databases – Part 2: Evaluation Protocol of Surface Shape and Repeatability of Relative Landmark Positions. Geneva: International Organization for Standardization.
- ISO. 2017. 7250-1:2017 Basic Human Body Measurements for Technological Design – Part 1: Body Measurement Definitions and Landmarks. Geneva: International Organization for Standardization.
- ISO. 2018. 20685-1:2018 3-D Scanning Methodologies for Internationally Compatible Anthropometric Databases – Part 1: Evaluation Protocol for Body Dimensions Extracted from 3-D Body Scans. Geneva: International Organization for Standardization.
- John, U., B. Greiner, E. Hensel, J. Lüdemann, M. Piek, S. Sauer, C. Adam, G. Born, D. Alte, E. Greiser, U. Haertel, H.W. Hense, J. Haerting, S. Willich, and C. Kessler. 2001. “Study of Health in Pomerania (SHIP): A Health Examination Survey in an East German Region: Objectives and Design.” Sozial- Und Praventivmedizin 46 (3): 186–194. doi:10.1007/BF01324255.
- Jürgens, H.W. 2004. Erhebung Anthropometrischer Maße Zur Aktualisierung Der DIN 33 402. Teil 2. Bremerhaven: Wirtschaftsverlag NW Verlag für neue Wissenschaft GmbH.
- Kamtsiuris, P., M. Lange, R. Hoffmann, A.S. Rosario, S. Dahm, R. Kuhnert, and B.-M. Kurth. 2013. The First Wave of the German Health Interview and Examination Survey for Adults (DEGS1). Bundesgesundheitsblatt, Gesundheitsforschung, Gesundheitsschutz 56 (5–6): 620–630. doi:10.1007/s00103-012-1650-9.
- Koepke, N., M. Zwahlen, J.C. Wells, N. Bender, M. Henneberg, F.J. Rühli, and K. Staub. 2017. “Comparison of 3D Laser-Based Photonic Scans and Manual Anthropometric Measurements of Body Size and Shape in a Validation Study of 123 Young Swiss Men.” PeerJ 5: e2980. doi:10.7717/peerj.2980.
- Kouchi, M., and M. Mochimaru. 2011. “Errors in Landmarking and the Evaluation of the Accuracy of Traditional and 3D Anthropometry.” Applied Ergonomics 42 (3): 518–527. doi:10.1016/j.apergo.2010.09.011.
- Kouchi, M., M. Mochimaru, B. Bradtmiller, H. Daanen, P. Li, B. Nacher, and Y. Nam. 2012. “A Protocol for Evaluating the Accuracy of 3D Body Scanners.” Work 41 (Supplement): 4010–4017. doi:10.3233/WOR-2012-0064-4010.
- Lumley, T. 2020. Survey: Analysis of Complex Survey Samples. R package version 4.0.
- Ng, B., B. Hinton, B. Fan, A. Kanaya, and J. Shepherd. 2016. “Clinical Anthropometrics and Body Composition from 3D Whole-Body Surface Scans.” European Journal of Clinical Nutrition 70 (11): 1265–1270. doi:10.1038/ejcn.2016.109.
- OPEN Design Lab. 2021. “Multivariate Accommodation Calculator 2.0.” Accessed March 29, 2021. https://www.openlab.psu.edu/
- Pagano, B.T., M.B. Parkinson, and M.P. Reed. 2015. “An Updated Estimate of the Body Dimensions of US Children.” Ergonomics 58 (6): 1045–1057. doi:10.1080/00140139.2014.1000392.
- Parkinson, M.B., and M.P. Reed. 2010. “Creating Virtual User Populations by Analysis of Anthropometric Data.” International Journal of Industrial Ergonomics. 40 (1): 106–111. doi:10.1016/j.ergon.2009.07.003.
- R Core Team. 2021. R: A Language and Environment for Statistical Computing. Vienna: R Foundation for Statistical Computing.
- Scheidt-Nave, Christa, Panagiotis Kamtsiuris, Antje Gößwald, Heike Hölling, Michael Lange, Markus A. Busch, Stefan Dahm, Rüdiger Dölle, Ute Ellert, Judith Fuchs, Ulfert Hapke, Christin Heidemann, Hildtraud Knopf, Detlef Laussmann, Gert B M. Mensink, Hannelore Neuhauser, Almut Richter, Anke-Christine Sass, Angelika Schaffrath Rosario, Heribert Stolzenberg, Michael Thamm, and Bärbel-Maria Kurth. 2012. “German Health Interview and Examination Survey for Adults (DEGS)-Design, Objectives and Implementation of the First Data Collection Wave.” BMC Public Health 12 (1): 730. doi:10.1186/1471-2458-12-730.
- Statista. 2021. “Anteil der ausländischen Bevölkerung an der Gesamtbevölkerung in Deutschland von 1991 bis 2021.” Accessed August 9, 2022. https://de.statista.com/statistik/daten/studie/14271/umfrage/deutschland-anteil-auslaender-an-bevoelkerung/
- Treleaven, P. 2004. “Sizing us up.” IEEE Spectrum 41 (4): 28–31. doi:10.1109/MSPEC.2004.1279190.
- Treleaven, P., and J. Wells. 2007. “3D Body Scanning and Healthcare Applications.” Computer Magazine 40 (7): 28–34. doi:10.1109/MC.2007.225.
- Vega, G.R., U.Z. Colado, X.P.Z. Colado, D.A.R. Vega, and E.J.V. Bustillos. 2021. “Comparison of Univariate and Multivariate Anthropometric Accommodation of the Northwest Mexico Population.” Ergonomics 64 (8): 1018–1034. doi:10.1080/00140139.2021.1892832.
- Völzke, Henry, Dietrich Alte, Carsten Oliver Schmidt, Dörte Radke, Roberto Lorbeer, Nele Friedrich, Nicole Aumann, Katharina Lau, Michael Piontek, Gabriele Born, Christoph Havemann, Till Ittermann, Sabine Schipf, Robin Haring, Sebastian E. Baumeister, Henri Wallaschofski, Matthias Nauck, Stephanie Frick, Andreas Arnold, Michael Jünger, Julia Mayerle, Matthias Kraft, Markus M. Lerch, Marcus Dörr, Thorsten Reffelmann, Klaus Empen, Stephan B. Felix, Anne Obst, Beate Koch, Sven Gläser, Ralf Ewert, Ingo Fietze, Thomas Penzel, Martina Dören, Wolfgang Rathmann, Johannes Haerting, Mario Hannemann, Jürgen Röpcke, Ulf Schminke, Clemens Jürgens, Frank Tost, Rainer Rettig, Jan A. Kors, Saskia Ungerer, Katrin Hegenscheid, Jens-Peter Kühn, Julia Kühn, Norbert Hosten, Ralf Puls, Jörg Henke, Oliver Gloger, Alexander Teumer, Georg Homuth, Uwe Völker, Christian Schwahn, Birte Holtfreter, Ines Polzer, Thomas Kohlmann, Hans J. Grabe, Dieter Rosskopf, Heyo K. Kroemer, Thomas Kocher, Reiner Biffar, Ulrich John, and Wolfgang Hoffmann. 2011. “Cohort Profile: The Study of Health in Pomerania.” International Journal of Epidemiology 40 (2): 294–307. doi:10.1093/ije/dyp394.
- Völzke, H., T. Ittermann, C.O. Schmidt, S.E. Baumeister, S. Schipf, D. Alte, R. Biffer, U. John, and W. Hoffmann. 2015. “Prevalence Trends in Lifestyle-Related Risk Factors: two Cross-Sectional Analyses with a Total of 8728 Participants from the Study of Health in Pomerania from 1997 to 2001 and 2008 to 2012.” Deutsches Arzteblatt International 112 (11): 185–192. doi:10.3238/arztebl.2015.0185.
- Völzke, H., J. Schössow, C.O. Schmidt, C. Jürgens, A. Richter, A. Werner, N. Werner, D. Radke, A. Teumer, T. Ittermann, B. Schauer, V. Henck, N. Friedrich, A. Hannemann, T. Winter, M. Nauck, M. Dörr, M. Bahls, S.B. Felix, B. Stubbe, R. Ewert, F. Frost, M.M. Lerch, H.J. Grabe, R. Bülow, M. Otto, N. Hosten, W. Rathmann, U. Schminke, R. Großjohann, F. Tost, G. Homuth, U. Völker, S. Weiss, S. Holtfreter, B.M. Bröker, K. Zimmermann, L. Kaderali, M. Winnefeld, B. Kristof, K. Berger, S. Samietz, C. Schwahn, B. Holtfreter, R. Biffar, S. Kindler, K. Wittfeld, W. Hoffmann, and T. Kocher. 2022. “Cohort Profile Update: The Study of Health in Pomerania (SHIP).” International Journal of Epidemiology dyac034. doi:10.1093/ije/dyac034.
- Wischniewski, S., D. Bonin, and A. Grötsch. 2015. “Virtual Anthropometry – Synthesis and Visualisation of Virtual Anthropometric Populations for Product and Manufacturing Engineering.” Paper Presented at the Proceedings of the 19th Triennial Congress of the International Ergonomics Association, Melbourne, August 9–14.
- Wischniewski, S., A. Grötsch, D. Bonin, and M. Parkinson. 2017. Synthesis and Validation of a Virtual Anthropometric User Population of German Civilians Based on an up-to-Date Representative Dataset (Series Title: Baua: Focus). Dortmund: BAuA.