
 ?Mathematical formulae have been encoded as MathML and are displayed in this HTML version using MathJax in order to improve their display. Uncheck the box to turn MathJax off. This feature requires Javascript. Click on a formula to zoom.
Abstract
There is a variety of visual human-machine interfaces (HMI) designed across vehicle manufacturers that support drivers while supervising driving automation features, such as adaptive cruise control (ACC). These various designs communicate the same limited amount of information to drivers about their ACC system and it is unclear which HMI designs impact driver distraction the least or how their design could be modified to help drivers develop more accurate mental models of their ACC system. Using a user-centred design (UCD) approach, we designed a speedometer to inform drivers about some of the system’s capabilities and then invited 23 drivers to use ACC in a low-fidelity driving simulator to compare the usability of three HMIs using eye-tracking, response times, and qualitative data. Our attempt at designing an intuitive and more informative speedometer received mixed results, but design recommendations are given regarding the indication of the set target speed, set time gap between vehicles (headway distance), and system mode (conventional or adaptive cruise).
Practitioner summary: Manufacturers’ heterogeneous designs of their visual HMIs for the ACC systems may impact driver distraction in different ways. We used usability testing to compare three HMIs in a driving simulator and make several design recommendations to indicate speed, time gap, and system mode in a more efficient way.
Abbreviations: ACC: adaptive cruise control; ADAS: advanced driving assistance system; HMI: human-machine interface; ISO: international organisation for standardization; OEM: original equipment manufacturer; RSME: rating scale of mental effort; RT: response time; R-TLX: raw task load index; SUS: system usability scale; TGT: total glance time; UCD: user-centred design; UX: user experience; xTGT: extended total glance time
1. Introduction
As advanced driving assistance systems (ADAS) increasingly take over the basic operational aspects of driving, drivers are pivoting to a hybrid role of supervisor and active controller for which all informational needs are not yet fully understood (see Sarter and Woods, Citation1995). Instead of entirely manoeuvring the vehicle themselves, drivers must now ensure that the activated systems operate safely and within their technical boundaries, or operational design domains. Doing so requires at least an understanding of how each system functions and the ability to gather information about a system’s status at any given time. Consequently, there is a need to consider how human-machine interfacesFootnote1 (HMI) should be designed in terms of the type of information necessary for supervision and decision-making, and what information might be redundant (e.g. Beggiato et al., Citation2015). The form in which this information is presented is of particular importance for the users of adaptive cruise controlFootnote2 (ACC), or SAE Level 1 (L1) assisted driving (SAE International, Citation2018), as they find themselves in a position where they need to simultaneously supervise and steer their vehicle. Any interaction with the HMI then becomes a potential distraction to their primary driving task if conducted for too long (Harvey et al., Citation2011), while remaining an essential part of their supervisory role. It is therefore important for drivers to develop accurate mental models of their driving-assisted vehicles to minimise driver distraction, but also for designers to develop HMIs with good usability that help reduce driver distraction and provide appropriate support to drivers in their dual roles. In this paper, we explore the importance of visual HMIs and usability, and how the latter relates to the concepts of driver distraction and mental models. We then report data from a driving simulator study and semi-directed interviews to try and address the issues further developed in the following sections.
1.1. Usability for driver supervision
1.1.1. What is usability?
Usability defines the degree to which a product eases the use of its functionality (Nielsen, Citation1994). The international organisation for standardisation (ISO) decomposes usability into three subcomponents: effectiveness, efficiency, and satisfaction (ISO Citation2010). Respectively, these components refer to how good the outcome of using a product is, how much time and effort is required, and how satisfying it is to use. Usability can be expanded to consider other product attributes such as the aesthetics, emotions, and engagement of the users, as well as individual and social factors (Bevan Citation2009). Altogether these factors form the user experience (or UX), which relates to the users’ perceptions and can be seen as more focussed on the satisfaction of using a product than usability is alone. Although secondary to safety, the satisfaction of using a product may matter very much in some cases. In the case of automated vehicles, these systems have the potential to improve road safety (Kalra and Groves Citation2017). It is therefore essential to propose products that are both very usable and very engaging for drivers when the goal is to have drivers use these technologies (Nordhoff et al. Citation2019).
1.1.2. How does usability relate to driver supervision?
Driving with an assisting or automated system requires redefining the driver’s role. In the case of ACC, drivers retain lateral control but rely on ACC to direct the vehicle’s longitudinal control. Because of system boundaries that the vehicle alone cannot always detect, a supervisory role is passed on to the driver upon activation of ACC. For instance, the sensors may fail to detect a vehicle ahead or not be equipped to detect curves and decelerate in response. Consequently, in this supervisory control paradigm (Sheridan and Parasuraman Citation2005) the driver is required to plan the use of the system, command the system, monitor it to maintain mode awareness, intervene if necessary, and possibly learn from the interaction to update their mental model (i.e. the internal representation of how a driver believes a system works and what they believe the system can or cannot do; Norman Citation1983).
Accurate mental models are a prerequisite at every stage of the supervisory control paradigm, but notably whilst monitoring a system for drivers to appropriately distribute their attention towards and between the different driving tasks. Maintaining mode awareness about a system is fundamental to avoid mode confusion or automation surprise (Carsten and Martens Citation2019; Sarter, Woods, and Billings Citation1997). Nonetheless, monitoring a system via the HMI should not prevent maintaining situation awareness of the external environment and it should be one role of the HMI to convey relevant information about an ADAS in a pleasant but efficient manner. Therefore, it is essential that HMIs have good usability to avoid driver distraction, facilitate the maintenance of situation awareness, and guide the formation of appropriate mental models.
1.2. Driver distraction: What, why, and how
1.2.1. What is driver distraction?
We will hereby define driver distraction as the misallocation of a driver’s attention towards activities preventing the adequate maintenance of situation awareness and vehicle control (but see Regan and Hallett Citation2011). This adequacy is therefore determined by the current automation level of the vehicle, where maintaining situation awareness for users of L3 is not as fundamental as it is for users of L1, for instance. Furthermore, distraction can occur on several channels, including visual, auditory, tactile, cognitive, and/or physical (Regan and Hallett Citation2011; Young and Regan Citation2007). Therefore, forcing drivers to interact with the HMI for too long while using ACC should be avoided given their responsibilities as supervisors and active controllers.
1.2.2. Why is visual distraction important to consider?
Driving is predominantly a visual-spatial-manual task (Sivak Citation1996; Young and Regan Citation2007), and according to a review by Lee (Citation2008, p. 525), road collisions usually happen because one or more parties ‘fail to look at the right thing at the right time’. This failure to attend important information within the environment could be due simply to inattention—like a driver misprioritising their attention—or to distraction, that is, inattention due to a concurrent activity and/or a failure to self-regulate their attention (Regan and Hallett Citation2011). Having a visual HMI that supports drivers in their supervisory role is therefore crucial and regulating the sources of visual distraction in our vehicles an important challenge to tackle for as long as drivers are involved in the driving task. One advantage of visual HMIs over other sensorial channels is the opportunity to communicate information about a system’s status, availability, and capabilities, at any given time and at a low attentional cost—the same information would not be constantly available via the auditory channel and would be much less efficient to gather for instance.
1.2.3. How to measure driver distraction?
Distraction, be it cognitive or visual, can be estimated in numerous ways. Some of these metrics—such as a task’s completion time, user accuracy, human effort (ISO 9241-11:2018), eye fixation duration, total glance time, or the number of glances (ISO 15007-01)—can also be used to evaluate a system’s efficiency. Consequently, the visual efficiency of an HMI used during a monitoring task can directly reflect the level of visual attention allocated at the expense of other driving tasks. Moreover, it is usually considered that, during manual driving, any glance away from the road lasting more than two seconds should be prevented (Klauer et al. Citation2010) and that the cumulative time spent gazing away from the road should never exceed 12 seconds (see ISO 15007-01; NHTSA Citation2013) as these numbers have been associated with higher risks of crashes. Finally, it is also common practice to estimate a driver’s cognitive distraction using subjective assessments of situation awareness or mental workload as a complement to other driver distraction metrics (Abbasi and Li Citation2021).
1.3. Mitigating driver distraction
Preventing driver distraction altogether is unachievable and the most reasonable manner to mitigate it is to reduce its occurrence and duration. Regulations, standards, and guidelines are methods of promoting good design practice across vehicles and ensuring consistency of their many aspects. For example, the way ACC should function and how its symbol should look (ISO 15622), the way symbols should be researched and designed (FHWA-RD-03-065; IEC 80416-1), where to place interface elements considering the driver’s eyes position (SAE J941 2010-03), when to display some of the parameters of ACC on the HMI, such as the set speed, set time gap, and detection of lead vehicles (SAE J2399 2021-10), or again, how to evaluate the distraction engendered by visual-manual secondary tasks (NHTSA Citation2013). But while there are many documents with the potential to help improve our vehicles’ usability, they are often overlapping and sparsely dedicated to the visual design of HMI elements used in our driving-assisted vehicles, leaving designers in the unknow of how to design their ACC-related elements to convey information most efficiently.
Amid the user-related research conducted on ACC, few studies have investigated how to mitigate driver distraction or how to develop appropriate mental models for this system via the HMI. François et al. (Citation2017, Citation2019), for instance, compared the efficiency and usability of different speedometer designs and truck HMIs in the context of CC to inform design choices that would help reduce driver distraction using eye-tracking data, task completion times, and questionnaires—although, not in the context of ACC. Other studies were conducted where authors evaluated the help that would bring an HMI showing the technical limitations of an ACC system (Saffarian, de Winter, and Happee Citation2013; Seppelt and Lee Citation2007), but only one concerned the development of mental models (Seppelt and Lee Citation2019). Moreover, these studies had little repercussion on the development of HMIs for market vehicles. Finally, a research team compared how many eye fixations and how much time was needed by drivers to say whether ACC was activated or not based on the symbol (Monsaingeon et al. Citation2021). They did not find a significant difference. However, the design of the symbols giving this information was the same between the vehicles that they used; the only difference for this task was the HMI layout. Consequently, there are still opportunities for the HMI designs of L1 vehicles to be researched and improved, and for the variety of HMIs on the market to be made more consistent.
1.4. The ACC systems, their HMIs, their issues
Since the regulations, standards, and guidelines on ACC systems are not exhaustive or constraining regarding some of their technical aspects, all systems are not equal: some cars can decelerate down to a full stop while some will require the driver to take over if going below 20 mph (30 km/h), depending on whether a stop-and-go function is available or not. In the first case, the system is called ‘full speed range,’ while in the second, it is termed ‘limited speed range’ (see ISO 15622:2018). In parallel, different cars allow drivers to choose from different ranges of speed to set: one car may allow setting a target speed for ACC between 15 mph and 95 mph, while another car could propose a range starting from 20 mph and up to 90 mph. The issue is that, except for the maximum target speed, none of this is indicated via the HMI and drivers must have done their research beforehand or try and fail to become aware of these system boundaries. ‘Signifiers’ can refer to ‘perceivable indicators that communicate appropriate behaviours to a person’ in the affordance framework (Norman Citation2013). Therefore, this signifier issue could be a hindrance to the development of mental models, and consequently to road safety if this were to lead to mode confusion when drivers use a new system that looks the same but behaves differently.
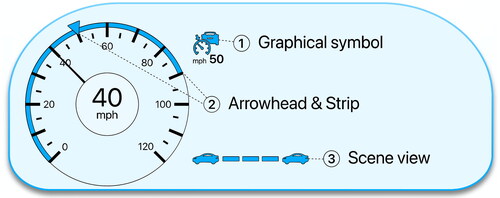
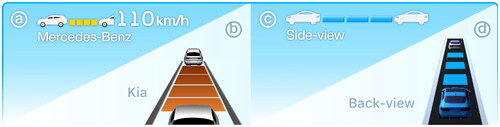
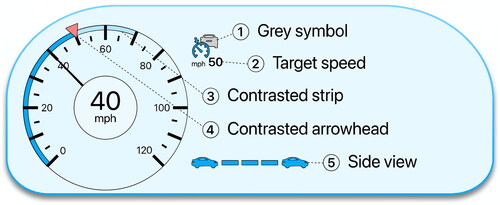
Equally, because of the lack of studies comparing existing HMI designs and, consequently, the lack of relevant information in the guidance available to designers, all visual HMIs are not equal: indicating the ACC system’s target speed can be achieved differently, as well as showing the time gap (or headway distance) to maintain, or again the way of indicating the detection of a lead vehicle. These pieces of information are usually indicated via three graphical elements on the HMI (): a strip and/or an arrowhead on the speedometer, a graphical view of the driving scene, and/or the graphical symbol of the system. Some HMIs will only use an arrowhead, while others will also use a strip, or only indicate the target speed in written, or use a combination of all three options. To set the headway distance, some HMIs will use a side-view of the scene () while others will show a bird’s-eye view of the scene or even use the graphical symbol, which could make it more demanding for drivers in the latter case given the smaller size of symbols compared to scene views (e.g. Lindberg and Näsänen Citation2003; McDougall, de Bruijn, and Curry Citation2000; Schuetz et al. Citation2019; Vertegaal Citation2008). Finally, indicating the absence of a lead vehicle is sometimes indicated by greying the car of the ACC symbol and sometimes by only showing an outline version, which can unpredictably impact the recognition time of the symbol (Arledge Citation2014). Sometimes, this information is instead indicated via a bird’s-eye view of the driving scene by removing the lead vehicle model. Some of these designs could present efficiency issues and therefore exacerbate driver distraction.
Figure 1. Mock HMI showing three common elements supporting the use of ACC: (1) graphical symbol; (2) arrowhead and strip; (3) scene view.
1.5. Solving the design issues
These design issues have not been openly researched despite their potential impact on driver safety and the importance of informing designers about how to conceptualise visual HMIs that support the development of mental models and minimise driver distraction. To examine the efficiency issues mentioned in the previous section, we regrouped different designs available on the market into three HMIs to compare them: simple, advanced, and custom. The simple design mimicked the most minimalistic HMIs and displayed the information in an integrated manner. The advanced design had more visually complex elements than the simple HMI and was more spaced. Lastly, the custom design was approached with both philosophies in mind and integrated a custom speedometer designed to improve the signifier issue mentioned earlier (see section 2.1.2.2). We were interested in which designs were the most efficient to communicate the same information to users of ACC, and whether our custom speedometer helped drivers to develop a more accurate mental model of their ACC system. To summarise, the research questions addressed were:
Does HMI design affect drivers’ efficiency to conduct routine tasks with an ACC system?
Does our custom design communicate the capabilities of the ACC system efficiently?
2. Material and methods
2.1. Experimental design
2.1.1. Participants & design
After approval from the University of Leeds Research Ethics Committee, 24 participants with a valid driving licence issued no less than 3 years prior to the study were recruited via a mailing list. All regularly drove in the UK, had normal vision and hearing, and received £20 as monetary compensation for their participation. One participant who had strabismus (crossed eyes) could not be calibrated to the eye-tracker and was therefore not asked to complete the procedure. Three other participants had to be removed from the eye-tracking data analyses due to technical issues with the eye-tracker: misdetection of the markers, miscalibration over time, or repeated failure to detect the participant’s eyes because of their eyeliner. The final sample was composed of 20 participants (9 females and 11 males) between the ages of 20 and 64 years (x̄ = 42.65, s = 12.7) for the eye-tracking data, 23 participants (10 females and 13 males) for the questionnaires, and 22 participants (10 females and 12 males) for the semi-directed interviews (see section 2.2.4). The experiment had a mixed factorial design with repeated measures with the fixed effects being the HMI (simple | advanced | custom) as a within-subject factor and the System Range (limited range | full range) as a between-subject factor. The order of the conditions was counterbalanced across participant.
2.1.2. Driver-vehicle interfaces
The design differences that we addressed in section 1.4 (p. 6) and used for the design of the three HMIs are summarised in . The next sub-sections provide more details for each element and reference the original equipment manufacturers’ (OEM) designs for comparative and illustrative purposes.
Table 1. Design differences for each ACC parameter between all three HMIs.
2.1.2.1. Symbols & assistance graphics
The two symbols selected for this study received the highest recognisability rates in Perrier et al. (Citation2021) but were not previously tested for usability in situ. The ISO-based symbol () was 10 × 8 mm, with the car being 6 × 4 mm. The Mercedes-based symbol () was 13 × 8 mm with each headway band being 5–9 × ∼1 mm. The headway bands on the side-view graphic () were 7 × 2 mm, while those of the bird’s-eye view graphic () ranged from 9 × 3 mm to 13 × 6 mm.
Figure 2. Left: standard ISO symbol (dark) and reworked version (blue) used for this study. Right: original Mercedes-Benz symbol (dark) and reworked version (blue) used for this study.

Figure 3. Assistance graphics showing the headway distance of an ACC system. (a) Mercedes-Benz side-view graphic showing both headway distance and target speed; (b) Kia bird’s-eye view graphic; (c) side-view and (d) bird’s-eye view graphics produced for this study for the advanced and custom HMIs, respectively. Graphics are reproduced and not on the same scale.
2.1.2.2. Speedometers
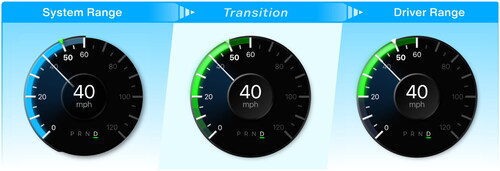
The simple and advanced HMIs (see , p. 9) always displayed the target speed below the ACC symbol. The advanced HMI had a blue arrowhead marker and a blue gauge running along the speedometer from the minimum system speed (i.e. 0 or 20 mph depending on the system speed range condition) to 90 mph. The custom HMI had a green arrowhead marker to increase the contrast with the blue strip, and a custom strip running from the minimum system speed to the posted speed limit to declutter the speedometer. Finally, during drivers’ interaction with the target speed, the strip turned green and ran from the minimum driver speed (i.e. 20 mph) rather than the minimum system speed (i.e. 0 or 20 mph) to communicate the difference between system range and driver range (). This colour change also gave more feedback to attract attention to this element (Carrasco Citation2011; Kim et al. Citation2011).
Figure 4. The custom speedometer momentarily changes appearance when the target speed is being set to reveal the range of speed available to drivers.
2.1.3. Apparatus
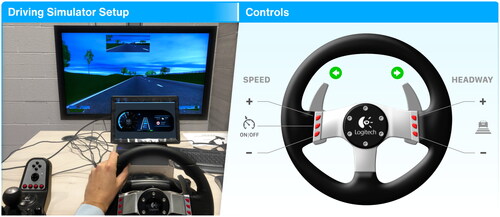
The research employed the University of Leeds fixed-base low-fidelity driving simulator operated on a Stone PC running Windows 10, using custom-made software, Intel Core i7 CPU (3.40 GHz) and 32 GB of RAM. The visual simulation was displayed on a Samsung 40ʺ wide-screen 1920 × 1080 (16:9) LCD monitor, rendered at 60 Hz. An IPS QHD 10ʺ 2560 × 1600 (16:10) LED monitor was used for providing the instrument panel and placed behind the steering wheel. Vehicle control inputs were recorded via Logitech G27 dual-motor force feedback steering wheel and pedals ().
Figure 5. Setup of the University of Leeds fixed-base low-fidelity driving simulator and controls assigned to the buttons of the steering wheel.
A head-mounted Pupil Core eye-tracker by Pupil Labs was used to record participants’ eye gazes at 60 Hz. Calibration was achieved using a single marker displayed at the centre of the 10ʺ monitor and having participants move their heads in both horizontal and vertical axes and then circularly while maintaining their gaze on the marker.
2.1.4. Tasks
Participants performed three routine driving tasks encountered when using an SAE level 1 ACC system. The first driving task was split into two subtasks (1a and 1b), for a total of 4 discrete tasks: (1a) decreasing the system’s target speed from the posted speed limit to a value below that speed limit; (1b) increasing the target speed to the posted speed limit; (2) increasing or decreasing the minimum headway distance; and (3) identifying the system’s mode/state, that is, whether the system was operating as a conventional CC or as an adaptive CC. Tasks 1a, 1b, and 2 were conducted manually by pressing the controls on the steering wheel. Task 3 was answered verbally by indicating ‘yes’ or ‘no’ to whether a lead vehicle was detected. Moreover, during this task only, the Mercedes-based symbol of the simple HMI was replaced by the ISO-based symbol to make the size of the symbol equal to the one used for the advanced HMI.
2.1.5. Procedure
Before the experiment, participants were emailed information about the experiment and safety procedures regarding the pandemic. The experimenter welcomed them to the simulator facility and took them to the experiment room. They were first asked to fill out a consent form, demographics, and experience questionnaires on an iPad.
The participants were then introduced to the driving simulator and were familiarised with the driving controls during a practice drive. During this drive, the experimenter first trained the participant on the four tasks that they needed to conduct by giving them verbal instructions. The experimenter then pressed a key on the keyboard to activate the automated delivery of the pre-recorded verbal instructions for drivers to practice the tasks autonomously, just like they would during the experimental procedure. Each of the four tasks was presented at least once with each HMI. Once they felt comfortable enough to proceed with the experiment, the eye-tracker was installed and calibrated, and the first of the three experimental drives began. Both drives lasted approximately 20 minutes and participants were proposed to have a short break if they needed. The order in which each participant would use the three HMIs and whether they would use the limited- or full-range system was counterbalanced. The order of the tasks was counterbalanced with the speed decrement task 1a always appearing before the speed increment task 1b. The values to be set by participants were also counterbalanced.
The observation of ACC usage began on a UK rural road with a speed limit posted at 60 mph and behind another car. Each participant started by driving manually and was asked to activate ACC as soon as they noticed the grey ACC symbol on the HMI—this symbol appeared once the speed was above 20 mph. The participant then drove through a village with a speed limit of 40 mph, and finally drove through a motorway section with a speed limit of 70 mph. Participants were instructed to adjust their target speed to the posted speed limit when they detected a speed limit sign or when a visual-auditory notification appeared on the interface—the speed limit was always displayed on the HMI. Each task prompt appeared at equally spaced points on the road and was communicated auditorily via the smaller screen speakers. The HMI would disappear for as long as the instructions were heard to prevent participants from responding before receiving all the instructions. After the HMI reappeared, participants had 10 seconds to respond to the task, after which the data collection would stop for this trial. In case they failed to respond correctly, they received the instructions again but the trial was excluded from data analyses. All four tasks appeared four times on each road section in a predetermined order. The target speed was incremented or decremented by 5 mph and could not be asked to be set at more than 20 mph below the speed limit. The headway distance was restricted to between one and three bars.
2.2. Measures
2.2.1. Behavioural & verbal
Unity® Game Engine was used to implement the HMIs and record task-related behavioural measures. For each trial, the system timestamps for drivers’ first and last manual inputs were recorded to compute their response times (RT), the accuracy of their response, and whether any mistake occurred, such as pressing the wrong button or exceeding the target value. Participants’ verbal responses were noted by the experimenter, as were the trials where participants were distracted or not ready for the task (e.g. talking to the experimenter or trying to get back the control of their vehicle after veering off the road).
Because of a bug encountered in Microsoft Excel, the timestamps of 12 participants were overwritten by the scientific notation after opening and closing the original CSV files. These timestamps were then re-estimated using the timestamps registered by the eye-tracker and participants’ RT computed in real-time by the HMI during the experiment (see the next section for details).
2.2.2. Eye-tracking data
For each frame, Pupil Labs’ software recorded the system timestamps, gaze coordinates, and whether eye gazes were estimated to be inside the frame of the HMI. This last measure was defined using six markers appearing for 10 seconds around the edges of the screen at the beginning of each trial and after the instructions had been heard.
To analyse the visual demand (i.e. the efficiency) required by each task we computed the total glance time (TGT) spent looking at the HMI before a correct response was recorded. The available time window was between the HMI onset time and the six markers’ offset time, that is, a time window of 10 seconds. For tasks 1a, 1b, and 2, we also accounted for the fact that drivers’ last input could have occurred between two glances. Therefore, we included the glances that occurred 1300 ms after the last input, as 90% of the peri-response glance intervals (i.e. the intervals between the glances occurring during a participant’s response) occurred before 1306 ms, and the average post-response glance interval was 1646 ms. To avoid confusion with the normal definition of total glance time (TGT; ISO 15007-1) we will refer to this metric as ‘extended total glance time’ (xTGT). Moreover, the trials in which the duration of the xTGT was inferior to 120 ms multiplied by the number of glances were discarded as it is physically impossible to have glances shorter than that (see ISO 15007-1:2014).
2.2.3. Questionnaires
After each drive, participants completed the rating scale of mental effort (RSME; Zijlstra Citation1993), the NASA raw task load index (R-TLX; Hart and Staveland Citation1988), and the system usability scale (SUS; Brooke Citation1986) questionnaires.
The RSME was used to assess subjective workload as it has the advantage of being sensitive (Sauro and Dumas Citation2009) while being easy to administer since it consists only of a vertical line that participants needed to cross with a pen on the tablet to automatise the computation of the score.
The R-TLX was also used to assess subjective workload as it discomposes the variable into 10 items and therefore is more complex than the RSME while remaining easy and quick to administer.
Finally, the SUS was chosen for its short length and wide range of applications with minor adaptation (see Sauro Citation2015).
2.2.4. Semi-directed interviews
After the three drives, participants were interviewed. These post-experimental semi-structured interviews aimed to gather qualitative feedback on the interfaces. Participants were asked to indicate which interface they thought was the most pleasant to use, the easiest to understand and use for the first time (intuitiveness), the easiest to use after not using it for an undefined period of time, the most confusing, the one most preventing errors, and the one allowing the most accurate, correct, and quick responses. Participants were asked to elaborate on each response. Then, they were asked whether they understood the design of the custom speedometer, and finally were asked to choose which version of the different elements of the interfaces they would prefer (i.e. speedometer, written target speed, symbol, and headway). The speedometer and written target speed were considered at first as one ‘speed’ element but were then separated into two distinctive items after six interviews based on participants’ answers. Consequently, the following 15 participants were asked to choose between having a written speed, a marker on the speedometer, or both. One participant had to leave before the interview, which resulted in only 22 participants being considered for this part of the analysis.
2.3. Data Analysis
2.3.1. Behavioural data
2.3.1.1. Extended total glance time (xTGT)
We conducted mixed-effects median regressions for the speed decrement task 1a, speed increment task 1b, and headway task 2 using the lqmm package (Geraci Citation2014) in R (R Core Team Citation2020). This type of regression does not assume a particular data distribution, is robust to outliers, and allows comparisons between groups of data at their medians rather than their means. For the system mode task 3, we conducted a mixed-effects gamma regression—a regression assuming that the data follows a gamma distribution—using the lme4 package (Bates et al. Citation2015) on the TGT for the trials where there was no vehicle detected, which halved the data and consequently prevented the use of a mixed-effect median regression. All significance thresholds were at 95% (ɑ = .05).
For the speed tasks 1a and 1b we used two different statistical models: the first modelled the overall effect of the HMIs whereas the second modelled the effects of the strip size, which only concerned the advanced and custom HMIs. The first model was also used for tasks 2 and 3 (the headway setting and system mode reading).
As random effects, we modelled an intercept for each participant to keep our repeated measures data independent from each other (Judd, Westfall, and Kenny Citation2012).
As fixed effects for the 1st model, given our hypothesis that the custom HMI would be more efficient than the other two HMIs, we used an orthogonal simple coding to compare the custom level of the HMI variable to each of the other levels (HMI Ψ1: simple vs. custom; HMI Ψ2: advanced vs. custom). We also modelled the trial number as a covariate to account for any learning effect and the number of glances needed to respond as a covariate to explain an important part of the variance.
As fixed effects for the 2nd model, we used a dummy coding for the effect of the HMI, with the custom level as 0 and the advanced level as 1, a simple coding for the effect of the system range (System Range Ψ: limited range ACC vs. full-range ACC), a simple coding for the effect of the speed-limit restriction on the custom strip (Driver Range Ψ1: 40 mph vs. 70 mph; Driver Range Ψ2: 60 mph vs. 70 mph), the interaction term between the HMI and system range (HMI Ψ × System Range Ψ), the interaction terms between system range and driver range (System Range × Driver Range Ψ1; System Range × Driver Range Ψ2), and again the trial number and the number of glances as covariates.
Coding the custom level of the HMI variable allowed to model the system range and driver range variables on this level only and ignore the advanced level. The interaction between HMI and system range then would tell us if the shorter or longer lower part of the strip had different effects on the xTGT according to the HMI.
To clean our data and remove unusual values we only kept the trials (1) where no error was committed, (2) where the number of glances to respond did not exceed three as the trials with more than three glances represented less than 2% of the data and popped out as outliers when using visual methods, and finally, (3) where no more than one glance exceeded 2 seconds or where the only glance ported to the HMI did not exceed 2 seconds as this would be considered as a distraction to the primary driving task according to the NHTSA guidelines (NHTSA Citation2014).
2.3.1.2. Response times (RT)
The same procedure conducted for the xTGT was followed for the RT, with the exception that we did not model the number of glances needed to respond. Instead, we modelled as a covariate the difference between the task value and the current speed or headway value to account for higher values being associated with higher RTs—for instance, if ACC were set at 60 mph and the task asked drivers to set it to 55 mph, this would be modelled as −5. This variable will be referred to as ‘speed decrement’ for task 1a and ‘speed increment’ for task 1b. Finally, two extreme values were removed for the regression on the RT of the headway task but are still shown in .
Figure 6. Boxplots with 95% CI (notch) of drivers’ extended total glance times (xTGT; left) and response times (RT; right) for the headway task (2) in the three HMI conditions. Outliers are shown.
2.3.2. Questionnaires
For the questionnaires, all 23 participants that participated in the drives were considered.
2.3.2.1 Rating scale of mental effort (RSME)
We conducted a mixed-effects gamma regression on the RSME scores—ranging from 0 to 150—with a simple coding to compare the custom level of the HMI variable to each of the other levels (HMI Ψ1: simple vs. custom; HMI Ψ2: advanced vs. custom), drivers’ age centred on its mean as a covariate, the years of driving experience, and participants were entered as a random effect. The data not being normally distributed, a gamma distribution was chosen based on the QQ-plots of the regression models generated. The interactions were not modelled due to convergence issues.
2.3.2.2 Raw task load index (R-TLX)
Responses to the TLX items were computed into an overall score ranging from 0 to 100. Because of the limited number of data points and the non-normality of their distribution, we conducted a Friedman test as a non-parametric equivalent to the analysis of variance.
2.3.2.3 System usability scale (SUS)
After considering a mixed-effect censored regression with a censored normal distribution (Hu Citation2019) using the lme4cens package in R (Kuhn Citation2021), diagnostics were not satisfactory and therefore, we conducted a Friedman test as a non-parametric equivalent to the analysis of variance. Responses to the SUS items were computed into an overall score ranging from 0 to 100, resulting in a bounded outcome score. The scores were not normally distributed as is usually observed in other research (see Lewis Citation2018), our scores being skewed towards the upper boundary.
3. Results and analyses
3.1. Efficiency
3.1.1. Setting the target speed
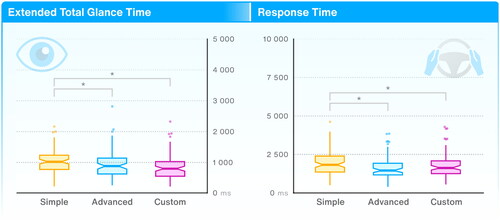
The overall distributions of drivers’ xTGT (see section 2.3.1.1) and RT in the speed decrement task 1a are illustrated by HMI in and . All regression tables are available as Appendices to .
Figure 7. Boxplots with 95% CI (notch) of drivers’ extended total glance times (xTGT; left) and response times (RT; right) for the speed task (1a) depending on the HMI and system speed range used. Outliers are shown.
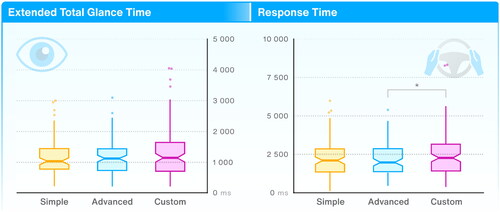
Figure 8. Boxplots of drivers’ response times (RT) for the speed task (1a) depending on the system (i.e. without or with stop and go) and driver speed ranges of the custom strip (i.e. road section). Outliers are shown.
From the first statistical model comparing all three HMIs, we found that drivers were slower (RT) to decrease their target speed while using the custom HMI than when using the advanced HMI (β = 269.06, 95% CI [7.15, 530.96], p = .04). In other words, the custom design degraded the efficiency of the HMI when drivers needed to set the target speed of their ACC system to a value below the posted speed limit. One explanation could be the absence of a written target speed on the HMI, like the simple and advanced HMIs had below the ACC symbol. Due to the imprecision of the eye-tracker, we cannot be certain of exactly when and if drivers opted for this strategy or not, as some had reported doing it and others not. Given that no difference was observed on the xTGTs, the disadvantage of the custom HMI may not have come from locating the current target speed on the speedometer, but from setting the target speed to the instructed value below the speed limit.
Indeed, when drivers had to set the target speed to the posted speed limit (), they looked at their instrument panel for 198 ms longer while using the advanced HMI than when using the custom HMI (β = −136.40, 95% CI [−259.90, −12.90], p = .03) and also took 275 ms longer to set their target speed (β = −227.52, 95% CI [−430.65, −24.38], p = .03). At least two explanations can be raised: (1) the strip used for the advanced HMI troubled drivers during this task since, as denoted before, it could be difficult to determine the speed limit, and/or (2) the contrast of the custom strip helped drivers locate the target speed and speed limit on their speedometer faster compared to the advanced HMI. Drivers also took 275 ms longer to set their target speed while using the simple HMI than when using the custom HMI (β = −263.26, 95% CI [−458.75, −67.78], p < .01). Altogether, these results could suggest that the custom strip helped drivers appreciate the distance between the current target speed and the speed limit and consequently plan the necessary number of presses, either or both by easing the acquisition of the speed limit and the target speed.
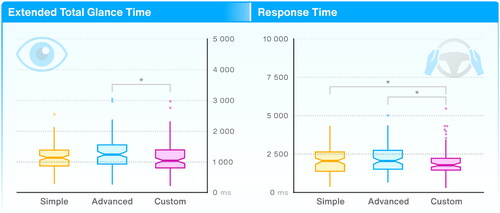
Figure 9. Boxplots with 95% CI (notch) of drivers’ extended total glance times (xTGT; left) and response times (RT; right) for the speed limit task (1b) depending on the HMI and system speed range used. Points out of the boundaries of each boxplot are shown.
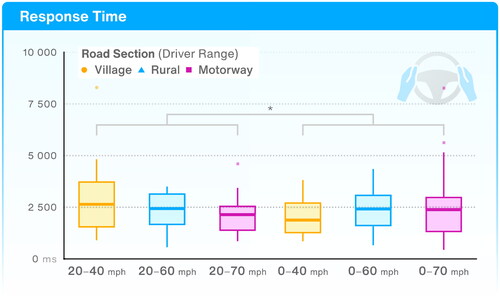
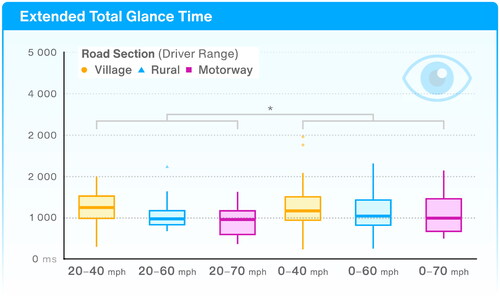
Regarding the results from our second statistical model, designed to compare the influence of the size of the custom strip on the xTGT and RT, the only significant comparison for the speed decrement task 1a was the interaction between system range and driver range on the RT (β = 648.44, 95% CI [2.28, 1294.59], p = .05), shown on . This interaction suggests that the difference between the village and motorway sections (limited to 40 and 70 mph respectively) was different between the limited-range and full-range ACC conditions (i.e. without and with stop and go respectively). While increasing the range of the strip from 20–40 mph to 20–70 mph helped drivers execute the task faster (median: 2640 ms to 2124 ms respectively), increasing it from 0–40 mph to 0–70 mph of range impaired drivers’ performance (median: 1866 ms to 2361 ms) when drivers needed to decrease the target speed previously set at the speed limit.
Finally, during the speed increment task 1b, there was an effect of the strip size on the xTGTs, with a significant difference between the village and motorway sections (limited to 40 and 70 mph respectively). Surprisingly, drivers looked at the HMI for 291 ms longer during the village section, at a lower speed (β = −150.36, 95% CI [−276.35, −24.38], p = .02). Given that no differences were observed in the RTs, we can hypothesise a behavioural adaptation (e.g. Carsten Citation2013) where drivers looked at their HMI for shorter periods on the highway because they were simply going faster () and that this was not an effect of the strip itself. However, a second possibility is that the current set speed on the custom strip might have been more difficult to find in the village section given that the light-blue part of the strip was smaller and consequently less attractive for the eyes.
Figure 10. Boxplots of drivers’ extended total glance times (xTGT) for the speed limit task (1b) depending on the system (i.e. without or with stop and go) and driver speed ranges of the custom strip (i.e. road section). Outliers are shown.
To summarise the results observed during the two speed tasks (1a and 1b), it seems that the custom strip improved some of the aspects for which it was designed, while overall, it presents some limitations compared to the other two HMIs. For instance, the strip could be efficient in quickly communicating the current speed limit and, potentially, planning the necessary actions to match this speed, while being as much or less efficient as the other HMIs when drivers needed to reach a specific target speed below the speed limit. As we suggested previously, this could be due to the lack of a written speed on the custom HMI but does not confirm whether, alone, the custom strip could be more efficient than a simple arrowhead or the advanced strip for this particular task. The reason we included both tasks 1a and 1b was that we suspected that drivers could opt for different strategies while performing them but also because the amount of visual support provided by the speedometers differs between these two tasks. A good design therefore for drivers to set the target speed of an ACC system would seem to be a strip like the one used for the custom HMI while having the target speed written on an accessible location of the interface like the simple or advanced HMIs. Accordingly, and only based on behavioural data, we would suggest avoiding strips like the one used for the advanced HMI.
3.1.2. Setting the headway distance
illustrates the distribution of drivers’ xTGT and RT in this task.
When setting their headway distance, drivers spent more time looking at the simple HMI than at the advanced HMI (β = 87.10, 95% CI [1.44, 172.76], p = .05) or than at the custom HMI (β = 178.20, 95% CI [87.96, 268.42], p = < .001). Drivers also took the most time to set the said headway distance when using the simple HMI than when using the advanced HMI (β = 349.86, 95% CI [136.55, 563.16], p = .001) or the custom HMI (β = 203.14, 95% CI [6.26, 400.00], p < .05). However, while the difference in time spent looking at the HMI between simple and custom was bigger than between simple and advanced, the opposite was observed when comparing the response times: drivers were able to set their headway distance more efficiently while using the advanced HMI than when using the other two. It seems the bigger vertical design used for the custom HMI was good for drivers to quickly grasp the current set headway distance, but that the horizontal design used for the advanced HMI was associated with faster manual interactions. This could be in line with what (François et al. Citation2019) observed when comparing the efficiency of different designs of strip-shaped speedometers. The authors found that horizontal strips (linear or curved) were more efficient overall than vertical ones for absolute speed reading (e.g. ‘the current speed is 23 mph’) and relative speed reading, as they termed it, that is indicating in which quarter of the strip the current speed was in (e.g. ‘the first quarter’, ‘the second’, et caetera). This could be due to how reading is almost exclusively carried horizontally from left to right across languages. Therefore, this effect might be mitigated among Japanese readers for instance who are used to downwards reading as well as rightwards reading (Obana Citation1997), while the observed visual advantage of the custom HMI could be due to the size of the graphical elements. In summary, bigger visuals (to a reasonable extent) are more usable than smaller ones, and the more visuals may be consistent with how drivers are used to reading, the more usable it might be; more research on the topic would be necessary. Therefore, our recommendation would be to not use the symbol as a way of setting an ACC system’s set headway.
3.1.3. Identifying the system’s mode
Participants’ answers were verbal, and consequently, the efficiency of each design was only evaluated by the time spent looking at the HMI. shows the TGT in all three conditions when no lead vehicle was detected by the system (i.e. conventional CC). The first author manually coded from the video recordings that drivers, in 92% of cases, responded in only one isolated glance, 6% in two consecutive glances, and 2% in three consecutive glances.
Figure 11. Boxplots with 95% CI (notch) of drivers’ total glance times (TGT) for the mode awareness task (3) in the three HMI conditions. Outliers are shown.
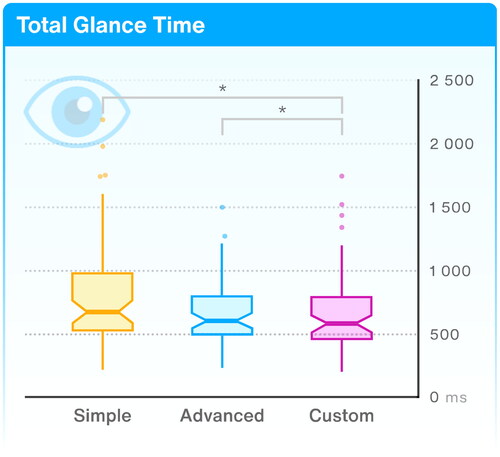
We compared the simple HMI (i.e. hollow symbol) to the other two HMIs (i.e. a grey symbol for the advanced and an absent lead vehicle on the assistance graphic for the custom). We only found that the hollow symbol (Simple: x˜ = 672 ms) was less efficient than the other two options (Advanced: x˜ = 600 ms; Custom: x˜ = 580 ms) to symbolise the absence of a lead car (HMI Ψ1: β = 110.71, p < .01; HMI Ψ2: β = 131.63, p < .001).
3.1.4. Mental effort and overall demand
A mixed-effects gamma regression on the rating scales of mental effort (RSME) scores revealed a slight advantage of the custom HMI (x̄ = 37.6) over the simple (x̄ = 43.3; β = −8.4, p = .003) and advanced HMIs (x̄ = 41.4; β = −9.64, p < .001). The participants thus rated the custom HMI as slightly less mentally demanding than the other two HMIs. No differences were found after performing a non-parametric Friedman test on the raw task load index (R-TLX) scores, χ2 (2, N = 24) = 1.3, p = .52. In short, the differences between the design choices appeared to have only a minor impact on the subjective mental workload of drivers, therefore, we will not discuss it further.
3.2. Overall usability
3.2.1. System usability scale (SUS)
A non-parametric Friedman test showed no differences between the three HMIs in terms of their SUS scores, χ2 (2, N = 24) = 0.6, p = .74.
3.2.2. Semi-directed interviews
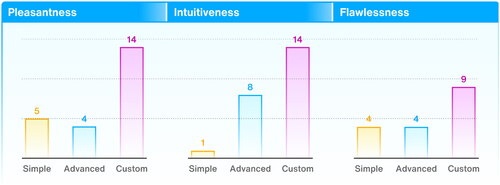
Overall, the custom HMI was preferred by drivers for its pleasantness, intuitiveness, and flawlessness, that is, preventing them from making errors (). However, five drivers could not decide between each HMI for this last aspect and were not forced to choose. All three HMIs were considered memorable enough to remember how to use them after an undefined period of non-use, although, asking drivers to judge this aspect after using each HMI for and within such a short amount of time was perhaps unrealistic. Then, all three HMIs had elements that could confuse drivers if they had to use them regularly, especially the way of indicating system mode. Although, some drivers suggested that this could be especially relevant while learning how to use an HMI. All questions considered, seven out of 22 drivers preferred some aspects of the simple HMI over the other HMIs, 10 preferred some aspects of the advanced HMI, and 21 drivers preferred some aspects of the custom HMI.
Figure 12. Number of drivers who elected each HMI as the most pleasant, intuitive, or flawless during the interviews.
3.2.2.1. Feedback on the ‘simple HMI’
The five drivers who preferred the simple HMI did because of its minimalistic visuals (n = 2), its symbol integrating the headway distance, system mode, and target speed in a single place (n = 4), the way it showed system mode (i.e. lead vehicle detection) via a hollow car symbol (n = 4), and because it could be simpler to use for experienced users who already know how to use ACC (n = 2).
Among the other 18 drivers interviewed, however, some indicated their disliking being due to its smaller visuals (n = 5), its lack of intuitiveness (n = 1), lack of distinctiveness from a conventional CC mode (n = 1), its mental demand on the driver (n = 3), and its lack of visual saliency (n = 2).
3.2.2.2. Feedback on the ‘advanced HMI’
Among the positive comments gathered about the advanced HMI, some drivers said they liked it for its clear visuals (n = 2), the information being easy to find (n = 1), its readability (n = 2), its dynamic headway graphic where one car was moving away or towards the other one as the bars filled or emptied the space between the two cars (n = 6), the target speed being written next to the symbol (n = 1), and one driver pointed out that they preferred the maximum speed not to be limited as the custom speedometer did. This driver commented that they liked feeling in control of their vehicle, which would be challenged by such speed restrictions.
Some drivers disliked this HMI due to the poor contrast of the speed information on the speedometer (i.e. blue arrowhead on blue strip; n = 1), the strip range being too large and confusing as to what the target speed is (n = 1), the information being too dispersed across the interface (n = 1), and the lead vehicle on the symbol turning grey was potentially confusing for some drivers (n = 3). One driver also expressed being bothered by the vehicles on the headway graphic being oriented leftwards rather than rightwards.
3.2.2.3. Feedback on the ‘custom HMI’
Finally, the custom HMI was preferred by most drivers for being more readable than the other options, notably in peripheral vision (n = 11), for its more prominent (n = 3) and more contrasted visuals overall (n = 4), the presence of ‘more feedback’ because of the strip turning green when the target speed is being set (n = 2), for the bird’s-eye view headway graphic being driver-centred (n = 1), and for the maximum speed being limited to the posted speed limit (n = 6).
Other drivers, however, disliked this interface for its visuals being too big (n = 2), too cluttered (n = 3), too distracting (n = 2), the target speed not being written (n = 2), the lead car on the bird’s-eye view graphic being grey rather than a more salient colour (n = 3), and for the headway graphic not being as dynamic as the advanced HMI (n = 1). Indeed, only the bars between the two cars were removed dynamically, while the lead car did not move.
3.2.2.4. Preference for single HMI elements
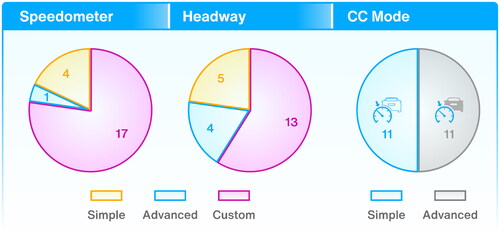
The custom strip was preferred by 17 drivers out of 22 (see ), and 14 drivers out of 15 reported they would prefer to have the speed indicated both on the speedometer and next to the ACC symbol. Thirteen (13) drivers preferred the bird’s-eye view headway graphic of the custom HMI, while 5 drivers and 4 drivers preferred the headway being displayed on the symbol itself or a side-view graphic, respectively. Finally, the preference for the symbol’s appearance was split, with 11 drivers preferring the hollow symbol and 11 drivers preferring the grey variant.
Figure 13. HMI elements preferred by participants during the interviews.
4. Discussion
Automakers have proposed various designs for a handful of visual HMI elements intended to assist users of ACC systems in their hybrid role as supervisor and controller of the driving task. We argued that some of these designs, such as the graphical symbol being used to indicate the gap distance to maintain, could present efficiency issues and exacerbate driver distraction. We also argued about a general signifier issue, as visual HMIs often do not communicate to drivers some of the capabilities and limitations of their system, such as whether a stop-and-go function is available or not. In response, we proposed a custom speedometer that would communicate additional capabilities about the system intuitively and improve mental models of the system. We hypothesised that different HMI designs would modulate differently the time necessary for drivers to conduct routine tasks with an ACC system involving looking at their HMI. Demonstrating the impact of HMI designs on drivers’ behaviour and perception would help designers of these HMIs understand how to reduce driver distraction and mode confusion. In the present driving simulator study, drivers tested and commented on three HMIs (simple, advanced, and custom) that were designed for the ACC system (, p. 9). To compare the efficiency of the aforementioned HMIs we analysed the total glance times (TGT; but see section 2.3.1.1.) and response times (RT) gathered during four routine tasks: speed setting below the speed limit, speed setting to the speed limit, headway distance setting, and system mode reading.
4.1. Did HMI design affect drivers’ efficiency with the system?
We observed that when setting the speed of their ACC system from the speed limit to a value below this latter, some drivers opted to rely more on the written speed below the symbol than on the graphical elements of the speedometer. Indeed, when using the custom speedometer—which did not present the target speed in written—drivers were longer to respond than when using the advanced HMI. On the other hand, when drivers increased the target speed to the speed limit, the custom speedometer was more efficient than the other two HMIs, possibly by being better at orienting drivers’ attention towards the speed limit and the target speed and at emphasising the difference between these two values. The higher contrast introduced between the two parts of the strip and the arrowhead increased the saliency and readability of these elements and should have helped drivers orient their gaze (Carrasco Citation2011; Kim et al. Citation2011).
Then, the smaller the visual information about the headway distance, the longer it probably took drivers to glance at it (Schuetz et al. Citation2019; Vertegaal Citation2008) and extract it (Lindberg and Näsänen Citation2003; McDougall, de Bruijn, and Curry Citation2000): using the graphical symbol for setting the ACC system’s headway distance was the least usable option tested, both in terms of efficiency (TGT and RT) and preference. A side-view or bird’s-eye view of the road scene on other hand, as seen on the advanced and custom HMI respectively, resulted in the shortest interactions. However, drivers largely preferred the bird’s-eye view over the symbol or side-view scene.
Finally, the way of showing ACC’s mode—conventional cruise control or adaptive—also influenced how efficiently this information was conveyed: using a hollow symbol was the most distractive option tested, whereas a grey symbol or an absent car on the bird’s-eye view scene were both better designs. When asked for their preference between a hollow or a grey symbol, half of the drivers would rather use the first option while the other half preferred the second option. Ultimately, drivers’ preferences, in this case, could not have allowed us to predict which design would be the most efficient.
In summary, this study shows that design decisions on single graphical elements, that could appear trivial at first, can improve or worsen the usability of a visual HMI, and that designers cannot rely solely on drivers’ preferences or aesthetic choices.
4.2. Did our custom design improve drivers’ mental models?
To try and make it intuitive, the custom speedometer was designed drawing inspiration from common user interface (UI) examples and the concept of affordance (Gibson Citation1979; Norman Citation1999) to communicate the difference between what the vehicle could do and what the driver could do. A system range changes depending on whether a stop-and-go function is equipped, which decelerates the vehicle down to a full stop in reaction to a halting lead vehicle. The strip on the speedometer, when lit blue, showed the speed range at which the system would remain active. However, when drivers were setting a new target speed for ACC, the strip would turn green and its range shrink to reflect the speed that the driver could choose to set (, p.11).
Only four out of 12 drivers in the stop-and-go condition were able to understand that the custom speedometer was showing both a system and a driver speed range. Expectedly, none of the drivers in the other group could understand that this was the case since both strips’ ranges were identical in size; they only saw the change of colour as feedback to their action. Seemingly, it remained unintuitive however for at least two drivers within each group to have a driving-assisted system not being able to come to halt automatically if the situation required as these drivers immediately assumed the vehicle would be full range. Nonetheless, we cannot firmly posit that the custom speedometer design intuitively communicated the system’s capabilities and limitations, although a third of the drivers concerned were able to verbalise their mental model. Exposing drivers to a traffic jam, or a lead vehicle decelerating below the minimum driver speed, would have allowed us to assess how the design could have changed drivers’ behaviour or not. We would expect drivers in the no-stop-and-go condition to react earlier and more often than the drivers in the stop-and-go condition.
4.3. Limitations
The present research was conducted with limited time available during the COVID-19 pandemic, potentially discouraging a part of the population to partake and preventing the recruitment of more participants due to lockdown measures. The resulting sample of 23 drivers may be considered relatively small when compared to other simulator studies. Nonetheless, the conditions’ order was balanced. multilevel analysis normally reduces Type I and II errors (Arregle et al. Citation2006; Matuschek et al. Citation2017; Preacher, Zhang, and Zyphu Citation2011), and median regression, as mentioned previously, is more robust to outliers than other types of linear regressions (John Citation2015). Although one would consider the results to be not generalisable, we believe that our results are still important as they show that design differences can have observable repercussions on usability, notably in terms of visual attention. This should encourage the production of more research on the topic and encourage designers to be mindful of their design choices.
Secondly, the eye-tracker was often tedious to calibrate or keep calibrated depending on participants, which resulted in many trials being excluded from the analyses. Additionally, the lack of precision prevented us from looking back at the data to see in which trials exactly drivers used the written target speed or not.
Finally, interviewing demands training and experience that the present researcher did not have. Because of this, we cannot rule out the possibility that biased questions or body language cues were unconsciously presented to the drivers during the interviews (Dumas and Salzman Citation2006).
4.4. Future research
In our previous research, we invited drivers to design and evaluate graphical symbols for the lane-centring control (LCC) and ACC systems (Perrier et al. Citation2019, Citation2021). The results showed a great confusion between the symbols for lane departure prevention (LDP) and LCC, and we hypothesised that this was due to the design of the LDP symbol. We also found that the ACC symbol used with the simple HMI in the present research was the best for drivers to deduct or recognise an ACC system.
However, we hereby observed that this symbol was not a good option to set the time gap to maintain between one’s own vehicle and the leading one. Finally, vehicles equipped with L3 automated lane-keeping systems (ALKS) are expected to enter the market in 2022 and no standard symbol has been advocated yet. This arrival expands furthermore the number of systems and symbols available in our vehicles, and we should ask ourselves how this will impact drivers.
In our next research, we will investigate in a driving simulator how the graphical symbols associated with ADASs of different levels of automation can help or hinder drivers’ understanding and familiarisation with these systems.
5. Conclusion
The objectives of this research were to demonstrate how small design decisions could promote driver distraction and to call for more research on the topic to help the development of design guidelines that apply to driving-assisted vehicles. It is important to accommodate first and regular users in their familiarisation with a new vehicle, as well as guarantying a safe and satisfying experience to all drivers throughout their use. Increasing consistency across vehicles through standardisation is an essential step towards this end, and the UCD approach has proven to be a reliable tool for researchers. Although drivers’ preferences should not prevail over safety, they can still guide design by complementing quantitative data.
5.1. Design recommendations
We hope that the design recommendations summarised below () will help users of ACC in their supervisory and controller roles, by improving HMIs’ usability and reducing driver distraction.
Figure 14. Recommended graphical HMI elements for SAE L1 assisted driving vehicles.
ACC’s conventional mode should be indicated by a symbol readable enough for all sights; avoid poor contrasts and too fine details for the naked eye (e.g. prefer a plain green and grey symbol to a monochrome hollow symbol).
ACC’s target speed should always be at least written.
If a pointer is used to indicate ACC’s target speed on the speedometer, consider joining it with a coloured strip.
If a strip and pointer are used on the speedometer to indicate the target speed, consider having two strip sections, with…
the section below the target speed ranging from the minimum system’s speed to the target speed,
the section above the target speed ranging from the target speed to the speed limit,
both sections contrasting to show how much of the system’s potential is at use and how much is left for drivers to manipulate with,
the pointer indicating the target speed and being in contrast with the strip (e.g. red on green).
ACC’s headway distance should not be set via the system’s graphical symbol.
Ethics approval
This research was approved by the Social Sciences, Environment and LUBS (AREA) Faculty Research Ethics Committee of the University of Leeds under the reference LTTRAN-122.
Consent to participate
Respondents gave consent to participate.
Consent for publication
Respondents gave consent for publication.
Authors’ contributions
Mickaël Perrier, the doctoral student, designed the study, developed the HMI and iPad application, analysed the data, and wrote the article.
Tyron Louw and Oliver Carsten, the doctoral supervisors, assisted throughout the conduction of this study and the writing of this article.
Availability of data, material, and code
The datasets, custom codes, and materials generated and analysed during the current study are available in the Open Framework repository: https://osf.io/9wnq8/?view_only=5b47cd7cf6434dc6bcc7fda13dea5f0a.
Acknowledgements
The authors would like to thank Michael Daly for his contribution to implementing our HMI with the University of Leeds Driving Simulator.
Disclosure statement
No potential conflict of interest was reported by the author(s).
Additional information
Funding
Notes
1 Interface: any physical means of translating and transmitting a signal intelligible by one party into a signal intelligible by another party, in either direction.
2 Adaptive cruise control (ACC) accelerates the vehicle up to a chosen target speed and decelerates to slower lead vehicles to maintain a set headway time.
References
- Abbasi, E, and Y. Li. 2021. “A Comprehensive Review of Driver’s Attention and the Evaluation Methods.” Computational Research Progress in Applied Science & ENGINEERING 7 (3): 1–4. doi:10.52547/crpase.7.3.2392.
- Arledge, C. P. 2014. “Filled-in vs. Outline Icons: The Impact of Icon Style on Usability.” Masters’ Thesis., University of North Carolina at Chapel Hill. doi:10.17615/jqx8-3d26.
- Arregle, J.-L., L. Hébert, and P. W. Beamish. 2006. “Mode of International Entry: The Advantages of Multilevel Methods.” Management International Review 46 (5): 597–618.
- Bates, D., M. Mächler, B. Bolker, and S. Walker. 2015. “Fitting Linear Mixed-Effects Models Using lme4.” Journal of Statistical Software 67 (1): . 67.i01 doi:10.18637/jss.v067.i01.
- Beggiato, M., F. Hartwich, K. Schleinitz, J. Krems, I. Othersen, and I. Petermann-Stock. 2015. “What Would Drivers like to Know during Automated Driving? Information Needs at Different Levels of Automation.” Proceedings of the 7th Conference on Driver Assistance. doi:10.13140/RG.2.1.2462.6007.
- Bevan, N. 2009. “What is the Difference between the Purpose of Usability and User Experience Evaluation Methods ?.” Proceedings of the Workshop UXEM, 9(1), 1–4.
- Brooke, J. 1986. “SUS – A Quick and Dirty Usability Scale.” In Usability Evaluation in Industry, edited by P. W. Jordan, B. Thomas, B. A. Weerdmeester, and I. L. McClelland, 189–194. Milton Park: Taylor & Francis Ltd. https://cui.unige.ch/isi/icle-wiki/_media/ipm:test-suschapt.pdf.
- Carrasco, M. 2011. “Visual Attention: The past 25 Years.” Vision Research 51 (13): 1484–1525. doi:10.1016/j.visres.2011.04.012.
- Carsten, O. M. J. 2013. “Early Theories of Behavioural Adaptation.” In Behavioural Adaptation and Road Safety: Theory, Evidence and Action, edited by C. Rudin-Brown and S. L. Jamson, 23–35 Milton Park: Taylor & Francis Ltd. doi:10.1201/b14931.
- Carsten, O. M. J, and M. H. Martens. 2019. “How Can Humans Understand Their Automated Cars? HMI Principles, Problems and Solutions.” Cognition, Technology & Work 21 (1): 3–20. doi:10.1007/s10111-018-0484-0.
- Dumas, J. S, and M. C. Salzman. 2006. “Usability Assessment Methods.” Reviews of Human Factors and Ergonomics 2 (1): 109–140. doi:10.1177/1557234X0600200105.
- François, M., P. Crave, F. Osiurak, A. Fort, and J. Navarro. 2017. “Digital, Analogue, or Redundant Speedometers for Truck Driving: Impact on Visual Distraction, Efficiency and Usability.” Applied Ergonomics 65: 12–22. doi:10.1016/j.apergo.2017.05.013.
- François, M., A. Fort, P. Crave, F. Osiurak, and J. Navarro. 2019. “Gauges Design for a Digital Instrument Cluster: Efficiency, Visual Capture, and Satisfaction Assessment for Truck Driving.” International Journal of Industrial Ergonomics 72 (January): 290–297. doi:10.1016/j.ergon.2019.06.004.
- Geraci, M. 2014. “Linear Quantile Mixed Models: The Lqmm Package for Laplace Quantile Regression.” Journal of Statistical Software 57 (13): 1–29. doi:10.18637/jss.v057.i13.
- Gibson, J. J. 1979. “The Ecological Approach to Visual Perception.” In The Ecological Approach to Visual Perception. New York, NY: Psychology Press. doi:10.4324/9781315740218.
- Hart, S. G, and L. E. Staveland. 1988. “Development of NASA-TLX (Task Load Index): Results of Empirical and Theoretical Research.” In Advances in Psychology 52 (C): 139–183. doi:10.1016/S0166-4115(08)62386-9.
- Harvey, C., N. A. Stanton, C. A. Pickering, M. McDonald, and P. Zheng. 2011. “Context of Use as a Factor in Determining the Usability of in-Vehicle Devices.” Theoretical Issues in Ergonomics Science 12 (4): 318–338. doi:10.1080/14639221003717024.
- Hu, C. 2019. “On the Comparison of Methods in Analyzing Bounded Outcome Score Data.” The AAPS Journal 21 (6): 102. doi:10.1208/s12248-019-0370-6.
- ISO. 2010. “Part 210: Human-Centred Design for Interactive Systems.” In Ergonomics of Human–System Interaction — ISO 9241-210,1–40. doi:10.5100/jje.30.1.
- John, O. O. 2015. “Robustness of Quantile Regression to Outliers.” American Journal of Applied Mathematics and Statistics 3 (2): 86–88. doi:10.12691/ajams-3-2-8.
- Judd, C. M., J. Westfall, and D. A. Kenny. 2012. “Treating Stimuli as a Random Factor in Social Psychology: A New and Comprehensive Solution to a Pervasive but Largely Ignored Problem.” Journal of Personality and Social Psychology 103 (1): 54–69. doi:10.1037/a0028347.
- Kalra, N, and D. G. Groves. 2017. “RAND Model of Automated Vehicle Safety (MAVS).” RAND Corporation. 2017:57. doi:10.7249/RR1902.
- Kim, S., A. K. Dey, J. Lee, and J. Forlizzi. 2011. “Usability of Car Dashboard Displays for Elder Drivers.” Proceedings of the 2011 Annual Conference on Human Factors in Computing Systems – CHI ’11, 493. doi:10.1145/1978942.1979011.
- Klauer, S. G., F. Guo, J. D. Sudweeks, and T. a Dingus. 2010. An Analysis of Driver Inattention Using a Case-Crossover Approach on 100-Car Data : Final Report. U.S. Department of Transportation: National Highway Traffic Safety Administration, May 148.
- Kuhn, M. 2021. lme4cens: Simple Linear Mixed Effect Models for Censored Data (R package version 0.1.13), Dresden, Germany.
- Lee, J. D. 2008. “Fifty Years of Driving Safety Research.” Human Factors 50 (3): 521–528. doi:10.1518/001872008X288376.
- Lewis, J. R. 2018. “The System Usability Scale: Past, Present, and Future.” International Journal of Human–Computer Interaction 34 (7): 577–590. doi:10.1080/10447318.2018.1455307.
- Lindberg, T, and R. Näsänen. 2003. “The Effect of Icon Spacing and Size on the Speed of Icon Processing in the Human Visual System.” Displays 24 (3): 111–120. doi:10.1016/S0141-9382(03)00035-0.
- Matuschek, H., R. Kliegl, S. Vasishth, H. Baayen, and D. Bates. 2017. “Balancing Type I Error and Power in Linear Mixed Models.” Journal of Memory and Language 94: 305–315. doi:10.1016/j.jml.2017.01.001.
- McDougall, S. J. P., O. de Bruijn, and M. B. Curry. 2000. “Exploring the Effects of Icon Characteristics on User Performance: The Role of Icon Concreteness, Complexity, and Distinctiveness.” Journal of Experimental Psychology 6 (4): 291–306. doi:10.1037/1076-898X.6.4.291.
- Monsaingeon, N., L. Caroux, A. Mouginé, S. Langlois, and C. Lemercier. 2021. “Impact of Interface Design on Drivers’ Behavior in Partially Automated Cars: An on-Road Study.” Transportation Research Part F 81: 508–521. doi:10.1016/j.trf.2021.06.019.
- NHTSA. 2013. “Visual-Manual NHTSA Driver Distraction Guidelines for in-Vehicle Electronic Devices.” In Docket No. NHTSA-2010-0053 http://awsassets.wwfnz.panda.org/downloads/earth_summit_2012_v3.pdf%0Ahttp://hdl.handle.net/10239/131%0Ahttps://www.uam.es/gruposinv/meva/publicacionesjesus/capitulos_espanyol_jesus/2005_motivacionparaelaprendizajePerspectivaalumnos.pdf%0Ahttps://ww.
- NHTSA. 2014. “Visual-Manual NHTSA Driver Distraction Guidelines for in-Vehicle Electronic Devices.” Docket No. NHTSA-2014–0088 79:179. ( https://www.regulations.gov/document/NHTSA-2014-0088-0001.
- Nielsen, J. 1994. “Usability Engineering.” In Journal of Chemical Information and Modeling. San Francisco: Morgan Kaufmann Publishers Inc.
- Nordhoff, S., M. Kyriakidis, B. van Arem, and R. Happee. 2019. “A Multi-Level Model on Automated Vehicle Acceptance (MAVA): A Review-Based Study.” Theoretical Issues in Ergonomics Science 20 (6): 682–710. doi:10.1080/1463922X.2019.1621406.
- Norman, D. A. 1983. “Some Observations on Mental Methods.” In Mental Models, edited by D. Gentner & A. L. Stevens, 1st ed., 7–14. New York, NY: Psychology Press.
- Norman, D. A. 1999. “Affordance, Conventions, and Design.” Interactions 6 (3): 38–43. doi:10.1145/301153.301168.
- Norman, D. A. 2013. The Design of Everyday Things: Revised and Expanded Edition (Revised). New York: Basic Books.
- Obana, Y. 1997. “Vertical or Horizontal ? Reading Directions in Japanese.” Bulletin of the School of Oriental and African Studies 60 (1): 86–94. doi:10.1017/S0041977X0002958X.
- Perrier, M. J. R., Louw, T. L. and Carsten, O. M. J. 2021. “User-Centred Design Evaluation of Symbols for Adaptive Cruise Control (ACC) and Lane-Keeping Assistance (LKA).” Cognition, Technology & Work 23 (4): 685–703. doi:10.1007/s10111-021-00673-0.
- Perrier, M. J. R., T. L. Louw, R. C. Gonçalves, and O. M. J. Carsten. 2019. “How Do Drivers Design Symbols for ACC & LCA? A Participatory Design Workshop.” AutomotiveUI ’19 Adjunct, September 21–25, 2019, Utrecht, Netherlands. doi:10.13140/RG.2.2.32273.79201/1.
- Preacher, K. J., Z. Zhang, and M. J. Zyphu. 2011. “Alternative Methods for Assessing Mediation in Multilevel Data: The Advantages of Multilevel Sem.” Structural Equation Modeling: A Multidisciplinary Journal 18 (2): 161–182. doi:10.1080/10705511.2011.557329.
- R Core Team. 2020. R: A Language and Environment for Statistical Computing. https://www.r-project.org/.
- Regan, M. A., and C. Hallett. 2011. “Driver Distraction: Definition, Mechanisms, Effects, and Mitigation.” In Handbook of Traffic Psychology, edited by B. E. Porter, First Edit, 275–286. Amsterdam: Elsevier.
- SAE International. 2018. J3016 Taxonomy and Definitions for Terms Related to Driving Automation Systems for on-Road Motor Vehicles. Warrendale: SAE.
- Saffarian, M., J. C. F. de Winter, and R. Happee. 2013. “Enhancing Driver Car-Following Performance with a Distance and Acceleration Display.” IEEE Transactions on Human-Machine Systems 43 (1): 8–16. doi:10.1109/TSMCA.2012.2207105.
- Sarter, N. B, and D. D. Woods. 1995. “How in the World Did we Ever Get into That Mode? Mode Error and Awareness in Supervisory Control.” Human Factors: The Journal of the Human Factors and Ergonomics Society 37 (1): 5–19. doi:10.1518/001872095779049516.
- Sarter, N. B., D. D. Woods, and C. E. Billings. 1997. “Automation Surprises.” In Handbook of Human Factors & Ergonomics, edited by G. Salvendy, 2nd ed., 1926–1943. New York: John Wiley & Sons Ltd.
- Sauro, J. 2015. “SUPR-Q: A Comprehensive Measure of the Quality of the Website User Experience.” Journal of Usability Studies 10 (2): 68–86. http://www.upassoc.org.
- Sauro, J, and J. S. Dumas. 2009. “Comparison of Three One-Question, Post-Task Usability Questionnaires.” Proceedings of the 27th International Conference on Human Factors in Computing Systems – CHI 09, 1599–1608. doi:10.1145/1518701.1518946.
- Schuetz, I., T. S. Murdison, K. J. MacKenzie, and M. Zannoli. 2019. “An Explanation of Fitts’ Law-like Performance in Gaze-Based Selection Tasks Using a Psychophysics Approach.” Proceedings of the 2019 CHI Conference on Human Factors in Computing Systems, 1–13. doi:10.1145/3290605.3300765.
- Seppelt, B. D, and J. D. Lee. 2007. “Making Adaptive Cruise Control (ACC) Limits Visible.” International Journal of Human-Computer Studies 65 (3): 192–205. doi:10.1016/j.ijhcs.2006.10.001.
- Seppelt, B. D, and J. D. Lee. 2019. “Keeping the Driver in the Loop: Dynamic Feedback to Support Appropriate Use of Imperfect Vehicle Control Automation.” International Journal of Human-Computer Studies 125: 66–80. doi:10.1016/j.ijhcs.2018.12.009.
- Sheridan, T. B, and R. Parasuraman. 2005. “Human-Automation Interaction.” Reviews of Human Factors and Ergonomics 1 (1): 89–129. doi:10.1518/155723405783703082.
- Sivak, M. 1996. “The Information That Drivers Use: Is It Indeed 90% Visual?” Perception 25 (9): 1081–1089. doi:10.1068/p251081.
- Vertegaal, R. 2008. “A Fitts Law Comparison of Eye-Tracking and Manual Input in the Selection of Visual Targets.” Proceedings of the 10th International Conference on Multimodal Interfaces – IMCI ’08, 241. doi:10.1145/1452392.1452443.
- Young, K. L, and M. A. Regan. 2007. “Driver Distraction : A Review of the Literature.” In Distracted Driving, edited by I. J. Faulks, M. A. Regan, M. Stevenson, J. Brown, A. Porter, & J. D. Irwin, 379–405. Sydney, NSW: Australasian College of Road Safety.
- Zijlstra, F. R. 1993. Efficiency in Work Behaviour: A Design Approach for Modern Tools.” Ph.D. Thesis [Ph.D. Thesis]., Delft University Press. Delft University of Technology.
Appendix
Regression tables
Setting the target speed
Table A1. Fixed effects from the first mixed-effect median regression model on the results of the speed task (1a). Symbols: ‘•’ for p ≤ .1’ and ‘*’ for p ≤ .05.
Table A2. Fixed effects from the second mixed-effect median regression model on the results of the speed task (1a). Symbols: ‘•’ for p ≤ .1’ and ‘*’ for p ≤ .05.
Table A3. Fixed effects from the first mixed-effect median regression model on the results of the speed limit task (1b). Symbols: ‘•’ for p ≤ .1’ and ‘*’ for p ≤ .05.
Table A4. Fixed effects from the second mixed-effect median regression model on the results of the speed limit task (1b). Symbols: ‘•’ for p ≤ .1’ and ‘*’ for p ≤ .05.
Setting the headway distance
Table A5. Fixed effects from the mixed-effect median regression model on the results of the headway task (2). Symbols: ‘•’ for p ≤ .1’ and ‘*’ for p ≤ .05.
Setting the system’s mode
Table A6. Fixed effects from the mixed-effect gamma regression model on the results of the mode awareness task (3). Symbol: ‘*’ for p ≤ .05.