
Abstract
The forefoot is the foot part most affected by ill-fitting shoes. Footwear fitting considers the measurements of length, width, and arch length. Toe shape has not yet been used in sizing feet and fitting shoes. This study aims to investigate the variation in toe shape, as measured by the hallux valgus angle. An automatic and reproducible hallux valgus angle measuring method using 3D foot scans with no palpation markers is proposed and applied to about half a million samples collected across North America, Europe, and Asia. The measuring method is robust and can detect the medial contour along the proximal phalanx even in extreme cases. The hallux valgus angle has a normal distribution with long tails on both sides in the general population. Large dispersions of HVA values were observed for both genders and in all three geographical regions.
Practitioner summary: The hallux valgus angle has a broad distribution in the general population. Females have larger hallux valgus angles than males, and people from Asia have larger hallux valgus angles than people from North America and Europe. Shoe toe boxes should be designed to fit the actual shapes of shoppers’ toes. The proposed method for measuring HVA opens a new opportunity to study the causal relationship between shoe wearing habits and HVA on a large scale.
Introduction
Human foot morphology is affected by wearing footwear (D’AoÛt et al. Citation2009). The hallux valgus angle (HVA), also called the first metatarsophalangeal angle, first toe angle, or toe #1 angle, is the most significantly different measurement between the habitually shod and barefoot populations (Mei et al. Citation2020).
HVA larger than 15° is an indicator of hallux valgus (HV), the most common forefoot deformity, which causes foot pain and can alter foot function (Ferreyra et al. Citation2020). Hallux valgus has a multifactorial etiopathogenesis and is a progressive deformity.
Whether inadequate footwear is one of the initial causes of HV or it is more of a factor that causes the progression of the HV deformity is still under debate (Ferreyra et al. Citation2020; Menz et al. Citation2021). Previous studies have analysed HVA variation in different groups of subjects. Some of the studies have focussed on groups of subjects with extremely different shoe wearing habits, and have revealed that the habitually shod population has significantly larger HVA than the barefoot population (Mei et al. Citation2020; Shu et al. Citation2015). Females in the shod group have significantly larger HVA than males (Barnicot and Hardy Citation1955; Kouchi Citation1998). Shoe toe box shape (Branthwaite, Chockalingam, and Greenhalgh Citation2013), opened-toed vs. closed-toed shoes (Martin-Casado et al. Citation2021), and shoe fitting (McRitchie, Branthwaite, and Chockalingam Citation2018) are essential factors influencing the increase of HVA. Women wearing shoes with a narrow toe box between the ages of 20 and 39 are more likely to undergo hallux valgus in later life (Menz et al. Citation2016).
In some cases, HV is diagnosed as an occupational disease. The mean HVA of miners’ feet is significantly smaller than the corresponding angle of their work boots (Dobson et al. Citation2018). The fit of underground coal mining work boots in the toe #1 area plays an important role in predicting the occurrence of lower limb pain (Dobson et al. Citation2018). 42% of female workers and 36% of male workers from various industries reported their work boots to be uncomfortable in the toe area (Janson, Newman, and Dhokia Citation2021). The incidence of HV is higher among female sales associates who wear high heel shoes than flat shoes (Soemarko et al. Citation2019). Practicing some sports (for example sport climbing) is also associated with HV (Cobos-Moreno, Astasio-Picado, and Gómez-Martín Citation2022).
Many methods are being used to treat HV. Based on responses of 210 Australian podiatrists to an online survey, the most common non-surgical treatments of HV are footwear advice or modification, custom and prefabricated orthotic devices, addition of padding, and muscle strengthening/retraining exercises (Hurn, Vicenzino, and Smith Citation2016). Advice regarding different footwear was the most common treatment for adult, older adult, and juvenile patients. A wide range of orthoses are being used for the treatment of HV. Orthosis with a toe separator has the best effect of correcting the HVA (Kwan et al. Citation2021). In case HV symptoms are not removed by non-surgical methods, more than 100 different surgical treatments are being used to resolve pain in the bunion region or under the second metatarophalangeal joint (Fournier, Saxena, and Maffulli Citation2019)
Footwear design should consider flexibility and support in the forefoot area of a shoe. A toe box and a sole should allow normal metatarsal phalangeal joint movement (Davies, Branthwaite, and Chockalingam Citation2015), and offer forefoot support (Mei et al. Citation2020). Dynamic values of HVA exceed static values. Therefore, static values should be considered for the shoe last design (Barisch-Fritz et al. Citation2014). Footwear design should also consider anatomical variation across different geographies. Kusumoto et al. (Citation1996) compared Filipino and Japanese females, Lee et al. (Citation2015) compared Taiwanese and Japanese females. Both studies found significant differences in HVA between the two groups. To date, to the best of the authors’ knowledge, there have not been any documented large-scale studies analysing HVA values of subjects from multiple continents.
Radiography during weight-bearing is the gold standard to measure HVA (Menz and Munteanu Citation2005). It measures the angle formed between a longitudinal bisection of the first metatarsal and a longitudinal bisection of the base of the proximal phalanx. This procedure is invasive and not suggested for healthy people.
Measurement by goniometer is a commonly used non-invasive method (Kilmartin and Bishop Citation1988; Kilmartin Citation1994; Janssen et al. Citation2014; Zhou et al. Citation2013; Choung et al. Citation2013). The measurement is applied to a barefoot person with weight equally distributed on both feet. One arm of the goniometer is brought against the midline of the medial surface of the hallux. The hinge of the goniometer is located over the first metatarsophalangeal joint, while the other arm is brought against the midline of the medial surface of the first metatarsal (Kilmartin and Bishop Citation1988). An agreement between the goniometer and radiographic measurement of 0.81 intraclass correlation coefficient (ICC) (95% confidence interval 0.76–0.86; p < 0.001) has been observed (Janssen et al. Citation2014). The measurement is operator-dependent and requires expert and special training.
With the development of 3D scanning and CAD tools, efforts have been made to utilise these technologies in foot morphology studies and footwear design. Previous studies that have quantitatively evaluated HVA either need palpation landmarks of feet before scanning (Martin-Casado et al. Citation2021; Janssen et al. Citation2014; Mits et al. Citation2010; Mickle et al. Citation2010), or manual adjustments of tangent lines on 3D scans (Shu et al. Citation2015; Zhou et al. Citation2013; Saghazadeh, Kitano, and Okura Citation2015). These processes require the measurer to be well trained and have limited the reproducibility and scale of the mentioned studies, which consisted of no more than 1662 subjects.
Large-scale surveys have utilised interviews or questionnaires to gather self-report data on HV (Nix, Smith, and Vicenzino Citation2010; Wilder Citation1980; Adams and Benson Citation1991). The largest sample involved 197,422 participants in a US national health survey (Wilder Citation1980). The quality of self-assessment is hard to control. The surveys focussed on the prevalence and severity of hallux valgus deformity. No numerical angular data was collected.
The aim of this study is to propose a novel HVA measuring method that uses 3D foot scans with no palpation landmarks and can be easily scaled up to a large number of participants. Using this method, we analyse the HVA variation of about half a million 3D foot scans, and compare HVA values between male and female subjects, as well as across geographical regions (continents).
Method
Data collection
This study was conducted in compliance with the Helsinki Declaration and has been approved by the Swedish Ethics Review Authority (reference No. 2019-03243). The study was conducted on 3D foot scans collected by Volumental AB prior to the study (Jurca, Žabkar, and Džeroski Citation2019). The subjects in the study are customers of 447 brick and mortar stores of sports footwear brands and retailers that are using a Volumental foot scanning solution. Each customer visited one of the 447 stores to buy shoes. Their feet were scanned with a 3D foot scanner as a part of a standardised shoe buying process. The first step was to take off their shoes and pull up their pant legs. The second step was to step on the scanner with both feet positioned slightly apart from one another, and body weight equally distributed between both feet. The customer had to stand still for 5 s while 3D scans of both feet were taken. Since the foot scans were collected in a retail environment, the process had to be quick and simple; therefore, there were no markers added on the feet, and possibilities of collecting detailed information about the customers were limited. The only demographic information collected for each customer included sex and age group (adult or child). All scans included in this study were scans of adult customers that originated from North America, Europe, and Asia. They were classified into one of these three geographical regions based on the location of the store where each customer was scanned, and not based on their ethnicity. 3D foot scans were taken during the time interval between October 2018 and December 2019.
Female scans were within the length classes between 200 and 280 mm and male scans between 220 and 300 mm (with intervals of 5 mm as in the Mondopoint shoe size system). Foot scans with instep height lower than 30 mm or higher than 90 mm were excluded from the analysis to remove scans of hands, feet with shoes, or with pant legs not rolled up. Foot scans that were outliers were visually investigated, and abnormal scans were excluded from the analysis. Excluded were, for example, scans of objects other than human feet, unfinished scans, scans of feet with missing toes, scans of feet standing on toes or the lateral side, and scans of left and right feet in touch with each other. The unit of analysis in this study is a 3D foot scan. As the data was collected in a retail environment, the 3D scans were collected with or without socks. Approximately 7% of the scans are from bare feet, while the others are scans of feet with socks. shows the total number of scanned feet in each group.
Table 1. Number of 3D foot scans used in this study per region and sex.
Hallux valgus angle measurement
In this study, we propose a new method to extract HVA from 3D foot meshes. In addition, the foot dimensions of foot length, width, heel width, and instep height are extracted. The foot orientation, foot outline extraction, and measurement extraction algorithms were the same as used by Jurca, Žabkar, and Džeroski (Citation2019). The hallux valgus angle was measured as the angle between a baseline parallel to the first metatarsal, and a hallux medial line parallel to the hallux proximal phalanx, similar to the arms in goniometer measurement (Kilmartin and Bishop Citation1988).
The baseline was defined by the calculated markers used in foot width and heel width measurements (points P and H as presented in ). P is the extreme point of the medial part of the foot outline in the region between 65 and 80% of the foot length, i.e. the medial marker defining foot width (Jurca, Žabkar, and Džeroski Citation2019). H is the medial point on the foot outline cross section perpendicular to the main foot axis (y), located at 15% of the foot length, i.e. the medial marker defining heel width. The baseline (shown in blue) is the line connecting P and H.
Figure 1. The measurement of hallux valgus angle (HVA) from a 3D foot scan outline. The gray curve is the hallux convex curve, with cross markers being the vertices on the convex curve. The baseline is shown in blue, while the hallux medial line is shown in red. HVA is measured as the angle between these two lines.
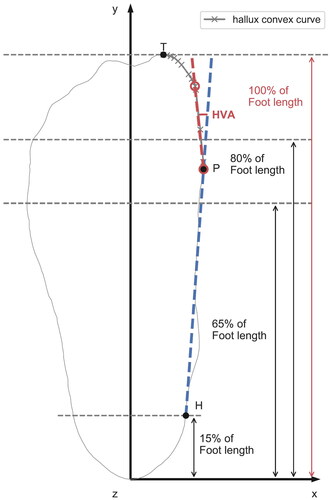
The hallux medial line is the line parallel to the longest line segment on the hallux convex curve. As shown in is the extreme point of the anterior part of the foot outline. First, we generate a convex hull of the outline between points P and T. We then approximate the convex curve by connected line segments with endpoints chosen among the convex curve vertices. The approximation error of each segment from the hallux convex curve is under a given error bound (Imai and Iri Citation1986). We adopt the optimal method described by Chan and Chin (Citation1996). to find all line segments on the convex curve, that satisfy the error criterion, then pick the longest one (shown in red in ) to represent the line parallel to the proximal phalanx.
The angle between this (red) hallux medial line and the (blue) baseline is then recorded as the HVA. This method was developed empirically based on a large number of observations. It is based on 3D shape only, without any anatomical palpation or manual post-processing.
Reliability of the measurement methods
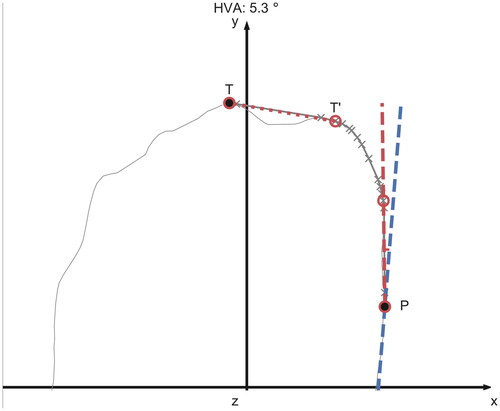
We investigated the outliers having HVA larger than 60°. They correspond to feet with a longer second toe, where the longest segment is the line connecting the tips of the first and the second toe, representing <1% of all the feet. We repeated the process of HVA calculation for these outliers, after removing the curve between the first and the second toe (TT′ in ) from the hallux convex curve.
Figure 2. An example of the longest line segment between P, T (dotted line) connecting the first and the second toes. Since its angle (84.8°) to the baseline is larger than the angular criterion of 60°, the longest line segment between P, T′ is chosen to represent the line parallel to the first proximal phalanx. The blue dashed line is the baseline and the HVA (between the two dashed lines) is 5.3°.
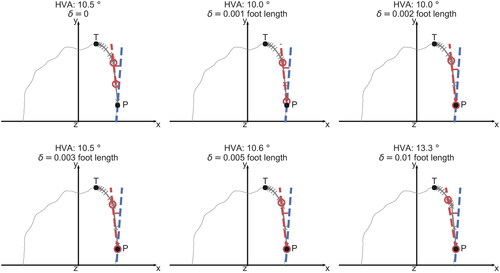
The segment error criterion for the hallux convex curve was chosen as 0.2% foot length. In the majority of cases, by using this parameter value, the method accurately locates the medial contour of the proximal phalanx. If we vary this parameter value from 0 to 1% of foot length, the calculated HVA changes by <5° for 93% of the feet.
is an example of constructing the hallux medial line with an error tolerance from 0 to 1% foot length. We can clearly see that the error tolerance of 1% foot length is too large. There is a clear deviation from the line segment to the hallux convex curve.
Figure 3. Hallux valgus angle values for a given foot as measured by using a line segment error tolerance from 0 to 1% foot length. The red circles are the line segment endpoints on the convex hull. The red line connecting the circles is the hallux medial line. The blue line is the baseline.
Visualisation of HVA
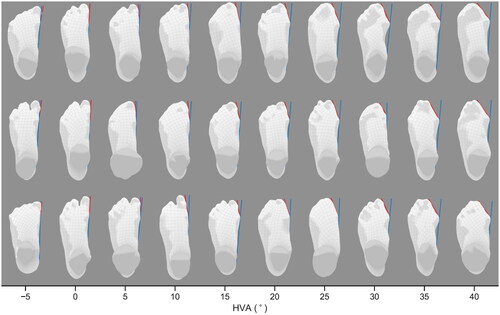
To visualise the results of the measuring method, we randomly sampled left foot scans with HVA increasing in 5° steps (). The baselines and the hallux medial lines are shown with blue and red lines. All the plots are obtained by following the method described above, without any manual modification. The measured angles represent the real in HVA well, even in extreme cases of negative HVA values or values of HVA in excess of 40°.
Figure 4. Randomly sampled left foot scans with hallux valgus angles growing in 5° steps. The red and blue lines are the hallux medial line and the baseline used to calculate the HVA.
Data analysis
HVA values were grouped by the three geographical regions, by sex, and by foot width (narrow, medium, wide). Violin plots were used to visualise distributions of HVA values for each region and gender. Box plots were used to compare distributions of HVA angles between three width groups.
Cohen’s d effect size (Cohen Citation1988) was used when comparing HVA values between groups of customers, i.e. regions, sexes and foot widths, to estimate how substantially different they are. Differences between mean HVA values for regions, sexes, and foot widths were quantified using an independent Student’s t-test (α = 0.05/0.001).
Results
Dispersion of HVA in the general population
The HVA values in the general population follow a normal distribution with a significant skew and kurtosis. shows the HVA of males and females in North America, Europe, and Asia. The standard deviations for each of the three regions are ∼6° in males and 7° in females (). The HVA values are positively skewed with skew parameters in the range of 0.5–0.8. They have extended tails on both sides, with positive kurtosis parameters in ranges of 1–3. In the following analysis, foot scans are divided into groups by region and sex.
Figure 5. The dependence of hallux valgus angle (HVA) on region and sex. Hallux valgus angle values for females are larger as compared to males. People from Asia have larger HVA values than people from North America and Europe.
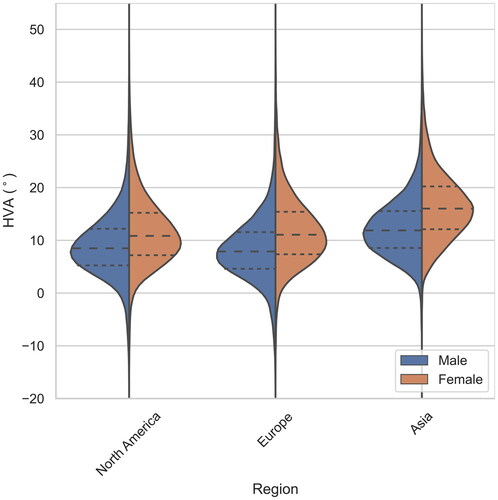
Table 2. Differences among HVA values between the sexes for the three regions. Groups (effect size) for all three regions as measured by Cohen’s d (Cohen Citation1988).
Females had larger HVA values than males. The difference in mean HVA values between females and males was the smallest in North America and the largest in Asia. The differences in mean HVA values between genders were statistically significant (α = 0.001) in all three regions. The values of Cohen’s d and the effect size are given in .
People from Asia have larger HVA than people from North America and Europe. The differences in HVA between North America and Europe were trivial for both genders. The differences for both genders in HVA of North America and Europe to Asia had a medium effect size (). All the differences in mean HVA values between the three regions were statistically significant (α = 0.001) for both genders.
Table 3. Pairwise differences of HVA values between regions.
A substantial part of the Asian customers (57% of females and 28% of males) have HVA larger than 15°, which is an indication of hallux valgus (HV). The share of customers with HV is lower in North America (26% of females and 13% of males) and Europe (27% of females and 11% of males)
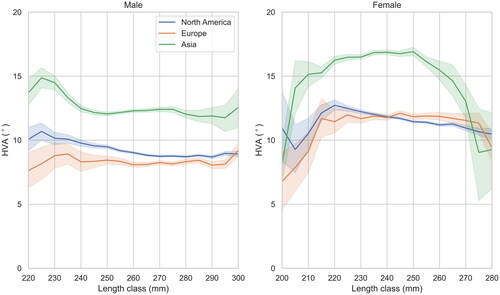
Hallux valgus angle did not exhibit a strong correlation with foot length (). We divided the feet into foot length classes with a 5 mm increment (according to the Mondopoint sizing system). Feet were classified into the length classes closest to their length. Male feet classified to length classes 220–300 mm and female feet classified to length classes 200–280 mm were included in this study. The foot length in each region and sex group has a normal probability distribution. The most frequently occurring length classes for male customers were 270 mm for scans in North America and Europe, and 255 mm for scans in Asia. For female customers (Jurca, Žabkar, and Džeroski Citation2019), the most common length classes were 245 mm for scans in North America and Europe, and 235 mm in Asia. Only a small number of feet were classified into the extreme length classes at both ends, causing the wide confidence intervals for HVA values in these classes. The mean HVA values of females from North America decrease with foot length when the latter is in the range 220–280 mm.
Figure 6. Mean hallux valgus angle (HVA) of each length class with the corresponding 95% confidence interval.
We further investigated the correlation of HVA with foot width (). The foot width standard deviations in the most frequently occurring length classes were 4.66, 4.46, and 4.13 mm for males in North America, Europe, and Asia. The corresponding values for females were 4.36, 4.23, and 4.14 mm. These deviations are close to the width step increment of 4.76 mm defined by the American standard shoe sizing system (Ales, Zabkar, and Dzeroski Citation2019). We divided feet in each length class into three foot width sub-classes: narrow, medium, and wide. The medium sub-class was defined to have the same median as the entire length subgroup, and a 4.76 mm width range. The wide and narrow foot width sub-classes were defined to include feet with width above and under the medium sub-class, respectively. The medium width sub-class contains 40% of the foot scans.
Figure 7. The distribution of hallux valgus angle (HVA) values in each width group for males and females in each of the three regions.
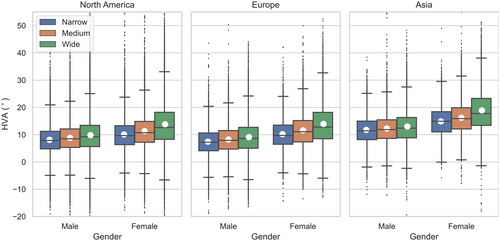
The mean HVA values and standard deviations for each width group are presented in . The differences between the mean HVA values of width groups are statistically significant (α = 0.001) for every geography and both genders. However, the dispersion within each width group is much larger than the differences between mean HVA values of width groups () Consequently, the effect size of the difference in HVA among foot width sub-classes was trivial in males, and small in females ().
Table 4. The mean and standard deviations of HVA values in each foot width group for males and females in each of the three regions.
Table 5. Differences in mean HVA values among the narrow-medium and medium-wide width groups, for males and females in each of the three regions, as measured by Cohen’s d (Cohen Citation1988).
The association of HVA with instep height was evaluated using Pearson’s correlation coefficients (r). Instep height was first normalised by foot length. HVA was negatively weakly correlated with normalised instep height (r = −.15).
Discussion
The aim of this study was to develop a novel method of measuring HVA that could be used on large datasets of 3D foot scans and to analyze HVA using a dataset of about half a million male and female 3D foot scans collected in a retail environment. Compared to existing methods of measuring HVA (radiographic or goniometer), this method is noninvasive and faster. It is completely automatic; it does not require any manual placing of markers on specific parts of the foot, and it does not require any manual positioning of markers or lines on a 3D foot scan. Therefore, no specific training of measurers is required.
The main finding of this study is the large dispersion of HVA values for both genders and in all three geographical regions. The ranges of HVA values between the 5th and the 95th percentile in North America, Europe, and Asia are 21.6, 21.4, and 21.9 degrees for female customers, and 19.3, 19.0, and 17.6 degrees for male customers. It is not clear how the difference between the HVA of a foot and the forefoot medial shape of a shoe impacts the perceived fit of footwear. However, it is very likely that a specific forefoot shape of a shoe does not fit to the wide range of HVA values observed in this study. Shoes that have extra space in the medial area of the first toe are most likely more comfortable than shoes that are pressing on the medial side of the first toe. Therefore, shoes with a wide toe box are more likely to fit a large part of the population in the area of the first toe compared to shoes with a narrow and pointed toe box. Footwear brands should be designing shoes with different forefoot shapes to provide a perfect fit in the first toe area to the majority of their customers. This applies especially to work boots, which are worn by workers for most of their working days. Results of Dobson et al. (Citation2018) showed that moulds of two different miners’ work boots had significantly higher first toe angle compared to miners’ feet, which indicates that miner’s first toes had to be compressed to fit the boots. Further studies are needed to increase the understanding of the optimal forefoot shape of a shoe for a specific HVA value.
Unfortunately, due to the fact that foot scans were collected in footwear retail stores, the dataset used in this study does not contain the age of the subjects, their body height, weight, and fit preference. Therefore, we were unable to study the relationship between HVA and other subject characteristics. However, previous studies have reported that the development of hallux valgus is related to age (Menz et al. Citation2021; Nix, Smith, and Vicenzino Citation2010; Scott, Menz, and Newcombe Citation2007; Roddy, Zhang, and Doherty Citation2008). Some retailers are collecting the age of shoe shoppers in their customer relationship management (CRM) systems. Joining the age data from CRM systems with 3D foot scan data would enable a large-scale analysis of the relationship between HVA and age in the future.
Another limitation of collecting foot scans in a sports retail environment is that customers of these stores most likely run or practice other sports more often than the general population. They wear specific footwear for their sports, which could have an impact on their HVA. The results of this study are specific to this population, and may not be representative of the general population. However, many customers of sports stores use running footwear for their everyday activities, so the results of this study could be very similar to the results of the general population.
Substantial differences between HVA values of male and female feet have been reported by previous studies (Barnicot and Hardy Citation1955; Kouchi Citation1998). This study confirms that female customers have significantly larger HVA values than male customers in all three geographical regions. The largest difference between male and female customers has been observed in Asia, where gender had a medium effect on HVA. The smallest difference was observed in North America, where gender had a small effect on HVA. Analysis of the toe #1 angle of Japanese subjects (Kouchi Citation1998) indicates that there was no significant difference between boys and girls in the age groups from 3 to 6 years of age, while for the large majority of age groups of children above 6 years of age and adults, female subjects had significantly higher HVA values as compared to male subjects. Several studies (Kinz, Groll-Knapp, and Kundi Citation2021; González-Elena et al. Citation2021) concluded that children with larger HVA values are associated with wearing shoes of insufficient length. One possible explanation for larger HVA values in female customers observed in this and previous studies could be that girls and women are more likely to wear too small shoes, and shoes with a very narrow toe box. However, additional research is needed to confirm this theory.
The results of this study have demonstrated significantly higher mean HVA values of Asian customers compared to North American and European customers in both genders. The geographical region had a trivial effect on HVA when comparing scans from Europe and North America. However, it had a medium effect on HVA when comparing Asia to North America and Europe. The reason for this is not clear. It could be related to cultural differences in the perception of how shoes should fit between Asia on one side, and North America and Europe on the other side, especially since the foot scans were classified based on the location of where they were captured, and not based on the ethnicity of the customers.
Hallux valgus angle is an important quantitative measurement of toe shape and an indicator of foot health. More than half of the Asian female customers have HVA larger than 15°, which is an indication of hallux valgus (HV). The share of HV is above 25% for Asian males and for European and North American females. The share of females that have HVA larger than 15° is substantially higher than the share of males in all three geographical regions. These results are in line with a systematic review of 78 papers reporting results of 76 surveys, which concluded that the prevalence of HV was higher in females (Nix, Smith, and Vicenzino Citation2010). All these numbers indicate that customers should pay more attention to wearing the proper size of footwear. They should also make sure that the toe box matches their first toe angle. Footwear producers should pay attention to designing anatomically shaped footwear to reduce the impact of poorly fitting shoes on feet.
Most feet in with HVA values 30° or higher look like subjects with medical conditions (HV). These examples demonstrate that the proposed method accurately measures HVA both on healthy feet as well as on feet with HV. The proposed method doesn’t automatically classify feet based on medical conditions; therefore, the results of his study provide an overview of HVA across healthy feet and feet with possible medical conditions. However, adding automatic classification based on the medical condition of a foot is a possibility for further improvements of the method.
Feet length and HVA values were not strongly correlated. On the other hand, wider feet have larger mean HVA values in all regions and in both genders. However, the differences between the width sub-groups are trivial or small for all groups.
A major limitation of this work is the lack of a comparison to the existing HVA measurement methods. We were only able to qualitatively evaluate the accuracy of the measured HVA values by visually inspecting a large number of images as presented in and . To quantitatively compare our method with the existing gold standard of HVA measurement, we would need to obtain a dataset of HVA measurements of a group of subjects based on both x-ray images and 3D foot scans. However, collecting x-ray images was beyond the scope of this research.
Another limitation of the proposed method is the step of fine-tuning the error tolerance parameter, which impacts the determination of the hallux medial line. This parameter was set to 0.2% of foot length by visually inspecting the results of the method using several values of the parameter. We chose the value of the parameter that calculated hallux medial lines similar to how an arm of a goniometer would be placed against the first toe. To evaluate the impact of the error tolerance parameter on the results, we calculated the mean HVA values for every group of subjects using each of the following parameter values: 0.1, 0.2, 0.3, and 0.5% of foot length. For female groups in length classes 220–280 mm, and male groups in length classes 245–300 mm, the mean HVA values varied by <1.5°. This indicates that the chosen value of the error tolerance parameter does not have a substantial impact on the mean HVA values. Having a dataset of HVA measurements using both the gold standard method and our method would allow us to fine-tune this parameter so that we would achieve the highest possible agreement between the results of both methods.
Regardless of the above-mentioned limitations of the proposed method, the possibility of using it on large datasets of 3D foot scans enables research of HVA at a much larger scale, as compared to using existing methods. The number of subjects used for this study was orders of magnitude larger than any previous study of HVA measurements.
The results of this study may assist footwear brands in developing shoes that better-fit customers’ feet in the first toe area. Further research is needed to analyse forefoot shapes of existing shoes on the market to evaluate how well they fit to customers’ feet. However, many shoes seem to have forefoot shapes that match large HVA values. Many types of footwear, in particular, fashion shoes often have pointy forefoot shapes, which may cause the progression of the HV deformity.
Continuous scanning of the feet of a large number of shoe shoppers every time they purchase shoes, combined with their purchase information, opens a new opportunity to study how different shoes cause changes in HVA values over time.
Conclusion
In this study, we propose a new method of measuring HVA and apply the method to a large dataset of 3D foot scans. The results of the study reveal the large dispersion of HVA values across all three geographical regions and both genders. Customers in Asia have higher HVA values than customers in North America and Europe. Females have higher HVA values than males in all three regions. The proposed method for measuring HVA opens a new opportunity in studying the causal relationship between shoe wearing habits and HVA on a large scale. Using this method with 3D scanning devices in footwear retail could increase the awareness of customers about their toe shapes. This could further lead to an increase in the number of properly fitted shoes.
Ethical approval
This study was conducted in compliance with the Helsinki Declaration and has been approved by the Swedish Ethics Review Authority (reference No. 2019-03243).
Consent for publication
Participants’ consent to publish was granted.
Author contributions
YJ developed the method, performed the data analysis, interpreted the results, and prepared the manuscript. SD helped with the interpretation of the results and the preparation of the manuscript. AJ designed the study and helped with the interpretation of the results and the preparation of the manuscript.
Disclosure statement
AJ acknowledges financial interest in Volumental AB, which offers a 3D foot scanner as one of its products. However, the results of this study are independent of the particular 3D scanning technology and device used to collect the raw foot scan data.
Data availability statement
The raw foot scan data used in this study are not publicly available, because the data are owned by third parties. The processed data are, however, available from the corresponding author upon reasonable request.
Additional information
Funding
References
- Adams, P.F., and V. Benson. 1991. “Current Estimates from the National Health Interview Survey, 1990.” Vital and Health Statistics 181: 1–212.
- Ales, J., J. Zabkar, and S. Dzeroski. 2019. “Foot Width Dispersion of Male Customers in the US and Canada.” Footwear Science 11 (sup1): 163–165. doi:10.1080/19424280.2019.1606307.
- Barisch-Fritz, B., T. Schmeltzpfenning, C. Plank, and S. Grau. 2014. “Foot Deformation during Walking: Differences between Static and Dynamic 3D Foot Morphology in Developing Feet.” Ergonomics 57 (6): 921–933. doi:10.1080/00140139.2014.899629.
- Barnicot, N.A., and R.H. Hardy. 1955. “The Position of the Hallux in West Africans.” Journal of Anatomy 89 (3): 355–361.
- Branthwaite, H., N. Chockalingam, and A. Greenhalgh. 2013. “The Effect of Shoe Toe Box Shape and Volume on Forefoot Interdigital and Plantar Pressures in Healthy Females.” Journal of Foot and Ankle Research 6 (1): 28. doi:10.1186/1757-1146-6-28
- Chan, W.S., and F. Chin. 1996. “Approximation of Polygonal Curves with Minimum Number of Line Segments or Minimum Error.” International Journal of Computational Geometry & Applications 6 (1): 59–77. doi:10.1142/S0218195996000058.
- Choung, S.-D., S.-Y. Kang, M.-H. Kim, and J.-H. Weon. 2013. “Reliability and Validity of the Goniometer for Hallux Valgus Angle Measurement.” Physical Therapy Korea 20 (2): 46–51. doi:10.12674/ptk.2013.20.2.046.
- Cobos-Moreno, Paula, Álvaro Astasio-Picado, and Beatriz Gómez-Martín. 2022. “Epidemiological Study of Foot Injuries in the Practice of Sport Climbing.” International Journal of Environmental Research and Public Health 19 (7): 4302. doi:10.3390/ijerph19074302.
- Cohen, J. 1988. Statistical Power Analysis for the Behavioral Sciences. 2nd ed. Routledge.
- D’AoÛt, K., T.C. Pataky, D. De Clercq, and P. Aerts. 2009. “The Effects of Habitual Footwear Use: foot Shape and Function in Native Barefoot Walkers.” Footwear Science 1 (2): 81–94. doi:10.1080/19424280903386411.
- Davies, N., H. Branthwaite, and N. Chockalingam. 2015. “Where Should a School Shoe Provide Flexibility and Support for the Asymptomatic 6- to 10-Year-Olds and on What Information is This Based? A Delphi Yielded Consensus.” Prosthetics and Orthotics International 39 (3): 213–218. doi:10.1177/0309364614522684.
- Dewi SS, Rahmasari F, Kamal AF, Cahayadi SD, and Herqutanto . 2019. “Hallux Valgus among Sales Promotion Women Wearing High Heels in a Department Store.” Journal of Orthopaedic Surgery 27 (1): 2309499019828456. doi:10.1177/2309499019828456.
- Dobson, J.A., D.L. Riddiford-Harland, A.F. Bell, and J.R. Steele. 2018. “The Three-Dimensional Shapes of Underground Coal Miners’ Feet Do Not Match the Internal Dimensions of Their Work Boots.” Ergonomics 61 (4): 588–602. doi:10.1080/00140139.2017.1397201.
- Dobson, J.A., D.L. Riddiford-Harland, A.F. Bell, and J.R. Steele. 2018. “How Do we Fit Underground Coal Mining Work Boots?” Ergonomics 61 (11): 1496–1506. doi:10.1080/00140139.2018.1489069.
- Ferreyra, Martín, Mariano Núñez-Samper, Ramón Viladot, Javier Ruiz, Albert Isidro, and Luis Ibañez. 2020. “What Do we Know about Hallux Valgus Pathogenesis?: Review of the Different Theories.” Journal of the Foot & Ankle 14 (3): 223–230. doi:10.30795/jfootankle.2020.v14.1202.
- Fournier, M., A. Saxena, and N. Maffulli. 2019. “Hallux Valgus Surgery in the Athlete: Current Evidence.” The Journal of Foot and Ankle Surgery 58 (4): 641–643. doi:10.1053/j.jfas.2018.04.003.
- González-Elena, M.L., A. Castro-Méndez, M. Coheña-Jiménez, and A. Córdoba-Fernández. 2021. “Relationship of the Use of Short Footwear with the Development of Hallux Valgus in a Sample of Andalusian Schoolchildren.” International Journal of Environmental Research and Public Health 18 (21): 11244. doi:10.3390/ijerph182111244.
- Hurn, S.E., B.T. Vicenzino, and M.D. Smith. 2016. “Non-Surgical Treatment of Hallux Valgus: A Current Practice Survey of Australian Podiatrists.” Journal of Foot and Ankle Research 9 (16): 16. doi:10.1186/s13047-016-0146-5.
- Imai, H., and M. Iri. 1986. “Computational-Geometric Methods for Polygonal Approximations of a Curve.” Computer Vision Graphics and Image Processing. 36 (1): 31–41. doi:10.1016/S0734-189X(86)80027-5.
- Janson, D., S.T. Newman, and V. Dhokia. 2021. “Safety Footwear: A Survey of End-Users.” Applied Ergonomics 92: 103333. doi:10.1016/j.apergo.2020.103333.
- Janssen, D.M., A.P. Sanders, N.A. Guldemond, J. Hermus, G.H. Walenkamp, and L.W. van Rhijn. 2014. “A Comparison of Hallux Valgus Angles Assessed with Computerised Plantar Pressure Measurements, Clinical Examination and Radiography in Patients with Diabetes.” Journal of Foot and Ankle Research 7 (1): 33. doi:10.1186/1757-1146-7-33.
- Jurca, Ales, Jure Žabkar, and Sašo Džeroski. 2019. “Analysis of 1.2 Million Foot Scans from North America.” Scientific Reports 9 (1): 19155. doi:10.1038/s41598-019-55432-z.
- Kilmartin, T.E., and A. Bishop. 1988. “Hallux Abductus Measurement: Repeatability Trials of a Clinical Measuring Instrument.” Chiropodist 43: 185–187.
- Kilmartin, T.E. 1994. “The Orthotic Treatment of Juvenile Hallux Valgus.” PhD thesis, University of Nottingham.
- Kinz, W., E. Groll-Knapp, and M. Kundi. 2021. “Hallux Valgus in Pre-School-Aged Children: The Effects of Too-Short Shoes on the Hallux Angle and the Effects of Going Barefoot on Podiatric Health.” Footwear Science 13 (1): 29–42. doi:10.1080/19424280.2020.1853826.
- Kouchi, M. 1998. “Foot Dimensions and Foot Shape: Differences Due to Growth, Generation and Ethnic Origin.” Anthropological Science 106 (Supplement): 161–188. doi:10.1537/ase.106.Supplement_161.
- Kusumoto, A., T. Suzuki, C. Kumakura, and K. Ashizawa. 1996. “A Comparative Study of Foot Morphology between Filipino and Japanese Women, with Reference to the Significance of a Deformity like Hallux Valgus as a Normal Variation.” Annals of Human Biology 23 (5): 373–385. doi:10.1080/03014469600004622.
- Kwan, M.-Y., K.-L. Yick, J. Yip, and C.-Y. Tse. 2021. “Hallux Valgus Orthosis Characteristics and Effectiveness: A Systematic Review with Meta-Analysis.” BMJ Open 11 (8): e047273. doi:10.1136/bmjopen-2020-047273.
- Lee, Y.-C., M. Kouchi, M. Mochimaru, and M.-J. Wang. 2015. “Comparing 3D Foot Shape Models between Taiwanese and Japanese Females.” Journal of Human Ergology 44 (1): 11–20.
- Martin-Casado, Laura, Christian Barquín, Alberto Aldana-Caballero, Felix Marcos-Tejedor, and Xavier Aguado. 2021. “Environmental Factors as a Cause of Differences in the Feet of Ecuadorian Children and Its Relation to Their Footwear.” Children 8 (6): 459. doi:10.3390/children8060459.
- McRitchie, M., H. Branthwaite, and N. Chockalingam. 2018. “Footwear Choices for Painful Feet – An Observational Study Exploring Footwear and Foot Problems in Women.” Journal of Foot and Ankle Research 11 (1): 23.doi:10.1186/s13047-018-0265-2.
- Mei, Q., Y. Gu, L. Xiang, P. Yu, Z. Gao, V. Shim, and J. Fernandez. 2020. “Foot Shape and Plantar Pressure Relationships in Shod and Barefoot Populations.” Biomechanics and Modeling in Mechanobiology 19 (4): 1211–1224. doi:10.1007/s10237-019-01255-w.
- Menz, H.B., and S.E. Munteanu. 2005. “Radiographic Validation of the Manchester Scale for the Classification of Hallux Valgus Deformity.” Rheumatology 44 (8): 1061–1066. doi:10.1093/rheumatology/keh687.
- Menz, H.B., E. Roddy, M. Marshall, M.J. Thomas, T. Rathod, G.M. Peat, and P.R. Croft. 2016. “Epidemiology of Shoe Wearing Patterns over Time in Older Women: Associations with Foot Pain and Hallux Valgus.” The Journals of Gerontology. Series A, Biological Sciences and Medical Sciences 71 (12): 1682–1687. doi:10.1093/gerona/glw004.
- Menz, H.B., M. Marshall, M.J. Thomas, T. Rathod-Mistry, G.M. Peat, and E. Roddy. 2021. “Incidence and Progression of Hallux Valgus: A Prospective Cohort Study.” Arthritis Care & Research. doi:10.1002/acr.24754.
- Mickle, K.J., B.J. Munro, S.R. Lord, H.B. Menz, and J.R. Steele. 2010. “Foot Shape of Older People: Implications for Shoe Design.” Footwear Science 2 (3): 131–139. doi:10.1080/19424280.2010.487053.
- Mits, S.D., P. Coorevits, D.D. Clercq, D. Elewaut, J.J. Woodburn, and P. Roosen. 2010. “Reliability and Validity of the Infoot 3D Foot Digitizer for Normal Healthy Adults.” Footwear Science 2 (2): 65–75. doi:10.1080/19424281003685694.
- Nix, S., M. Smith, and B. Vicenzino. 2010. “Prevalence of Hallux Valgus in the General Population: A Systematic Review and Meta-Analysis.” Journal of Foot and Ankle Research 3 (1): 21. doi:10.1186/1757-1146-3-21.
- Roddy, E., W. Zhang, and M. Doherty. 2008. “Prevalence and Associations of Hallux Valgus in a Primary Care Population.” Arthritis and Rheumatism 59 (6): 857–862. doi:10.1002/art.23709.
- Saghazadeh, M., N. Kitano, and T. Okura. 2015. “Gender Differences of Foot Characteristics in Older Japanese Adults Using a 3D Foot Scanner.” Journal of Foot and Ankle Research 8 (1): 29. doi:10.1186/s13047-015-0087-4.
- Scott, G., H.B. Menz, and L. Newcombe. 2007. “Age-Related Differences in Foot Structure and Function.” Gait & Posture 26 (1): 68–75. doi:10.1016/j.gaitpost.2006.07.009.
- Shu, Y., Q. Mei, J. Fernandez, Z. Li, N. Feng, and Y. Gu. 2015. “Foot Morphological Difference between Habitually Shod and Unshod Runners.” PLOS One 10 (7): e0131385. doi:10.1371/journal.pone.0131385.
- Wilder, M.H. 1980. “Prevalence of Chronic Skin and Musculoskeletal Conditions, United States, 1969.” Vital and Health Statistics 10 (92): 1–65.
- Zhou, J., P. Hlavacek, B. Xu, and W. Chen. 2013. “Approach for Measuring the Angle of Hallux Valgus.” Indian Journal of Orthopaedics 47 (3): 278–282. doi:10.4103/0019-5413.109875.