
Abstract
The clothing fabric and skin interact continuously across the many regions of users′ bodies during wear, which can lead to both physical skin damage and discomfort. Therefore, this investigation aimed to explore the regional differences in skin friction, tactile perception, and sensitivity in both females and males during the skin-textile interaction. The static and dynamic friction coefficient and textile perception (texture, stickiness, pleasantness, and discomfort) were measured across the 36 selected testing body areas by using a friction measurement device. The results revealed there was a significant difference in skin friction, tactile perceptions, and sensitivity across the various body regions. The anterior neck had the highest skin friction in both females and males, and participants generally rated higher texture perception in their anterior aspects compared to posterior and lateral regions. There was no significant difference in skin friction, tactile perception ratings, and sensitivity between females and males.
Practitioner summary: This study sought to examine regional variations in skin friction, tactile perception, and sensitivity during the skin-textile interaction. There was a significant difference in skin friction, tactile perceptions, and sensitivity across the various body regions and no significant sex effect on skin friction, tactile perception ratings, and sensitivity.
1. Introduction
Friction at the skin-textile interface is a crucial component in the occurrence of dermatitis (irritations, abrasions, and blisters). In working activities friction is more of an issue if there are periodic high mechanical loads, and shear forces, for example wearing protective equipment, such as body armour (Derler, Schrade, and Gerhardt Citation2007; Duncan, Mclellan, and Dickson Citation2011; Moncrieff Citation2008). Recent attempts have been made to refocus the fundamental design of such protective garments using novel design methods, manufacturing technologies, and hybrid materials, which aim to assist in lowering the coefficient of friction between clothing and skin (Johnson, Bingham, and Wimpenny Citation2013; Klosterman et al. Citation1999; Gong, Qian, and Yuan Citation2019). While research has focussed on design solutions for future generation protective garments, the behaviour of the skin itself has been neglected. In addition to the physical skin disorders caused by wearing loaded protective equipment, the comfort arising from the tactile sensation of fabrics in contact with the skin is also important for users. An officer’s uniform, for example, may feel smooth or rough against the skin, and as such, this sensation could potentially be described as comfortable or uncomfortable depending on the degree of smoothness or roughness being perceived by the wearer.
Prior research has a body-mapped temperature (Liu et al. Citation2013; Fournet et al. Citation2013), sweat production (Smith and Havenith Citation2011; Raccuglia et al. Citation2019), thermal (Gerrett et al. Citation2015; Gerrett Citation2019; Ouzzahra, Havenith, and Redortier Citation2012), and wetness sensation (Filingeri et al. Citation2014). These have been used to inform the design of protective equipment that meets thermal and tactile comfort levels, each of which has been shown to have a considerable impact an individual’s physical and cognitive performance. However, the body mapping of skin friction and tactile perception have yet to be thoroughly investigated, which is an important research area related to skin behaviour and the design of clothing. Although preliminary results for regional differences in skin friction coefficient and tactile perception have previously been undertaken (Temel, Johnson, and Lloyd Citation2022), a thorough evaluation of body regions is required to establish a detailed body map of skin friction and tactile perception. Previous research on skin has investigated that there were no biological sex differences in skin friction coefficient (Cua, Wilhelm, and Maibach Citation1990; Sivamani et al. Citation2003; Derler et al. Citation2009; Veijgen, Masen, et al. Citation2013). However, there is a gap in the literature surrounding sex differences in friction coefficient and tactile perception during the skin and textile interaction across a wider range of body regions.
According to our knowledge, the assumption that progressive increases in friction evoke similar increases in tactile perception during the application of textile on the skin has not been researched yet. For example, it is not yet clear whether any increment in skin friction by shifting the body regions (e.g. because of changes in skin characteristics) would elicit a corresponding change in tactile perception; or whether the tactile sensitivity differences between body regions occur due solely to a combination of physiological or psychological features, such as mechano-receptors innervations patterns or learned previous experience. To fill this research gap, the tactile sensitivity across the various body regions was investigated in this study.
Therefore, this investigation aims to explore the regional differences in skin friction and tactile perception in both females and males during the skin-textile interaction. To do this, four hypothesises were examined: (1) the measured skin friction coefficient to textile would vary across the numerous human body regions, (2) the associated tactile perception to textiles would vary across the numerous human body regions, (3) the tactile sensitivity to skin friction would vary across the numerous human body regions, (4) there would be a significant sex difference in the skin friction, tactile perception, and sensitivity across the various tested body regions.
2. Method
2.1. Overview of the study
To investigate the regional differences and the sex effect on skin friction coefficient and tactile perception, a protocol was developed in which the static and dynamic friction coefficient and textile perception (texture, stickiness, pleasantness, and discomfort) were measured. A textile was applied on the 36 selected testing body areas by using a friction measurement device following a mixed counterbalanced order. The illustration and description of tested body regions are given in .
Table 1. The names and visual descriptions of test regions.
2.2. Equipment
This experiment utilises the portable handheld device previously introduced (Temel, Lloyd, et al. Citation2021). This device measures the friction coefficient between the skin and a textile (e.g. cotton, polyester, silk), as well as supports the process of objectively assessing regional perception using the localised sensory texting methods (Temel, Johnson, et al. Citation2021). The device is equipped with cantilever 100 g straight bar mini-load cells (±0.1%) (Digi-Key Electronics, UK), which were used to measure both normal and friction forces independently. As the device is pressed onto the test body region, the probe reciprocally moves vertically at a fixed rate of 0.04 m/s. Once initiated, the spring is stretched, and the load cell measures the applied normal force perpendicular to the skin. When the probe and contact surface interact, a friction force occurs, at which point the load cell measures this friction force. The normal load (Fnormal) and friction force (Ffriction) are registered in real-time by the load cells. The forces measured by the developed software were calibrated using a Class M2 calibration weight set (Temel, Lloyd, et al. Citation2021).
2.3. Contact textile
In this study, knitted—single jersey contact material was a pre-shrunk 100% cotton sample. The thickness, weights, and surface roughness, were measured using the Kawabata Evaluation System, where samples measured 0.62 mm, 140 g/m2, and 3.7 µm, respectively (Raccuglia et al. Citation2018). Each textile sample measured 80 × 80 mm in length and width, with a virgin textile sample used every three applications.
2.4. Participants
Twenty university students, eleven females and nine males (24.6 ± 3.6 years, 66.8 ± 13.6 kg, 170.6 ± 8.7 cm, 22.3 ± 7.5% body fat) of Western European origin participated voluntarily in the study. Exclusion criteria included being a smoker, having cardiovascular, musculoskeletal, cutaneous, and metabolic disease, or a sensory-related disorder. For a period of 24 h before each trial, participants were asked not to consume caffeine or alcohol, along with refraining from consuming food for 2 h before the trial. Loughborough University Ethics Committee (ECC/AJ2) approved the study design and was conducted within the confines of the World Medical Association Declaration of Helsinki for medical research using human participants, except for registration in a database.
2.5. Test protocol
All experimental procedures were fully explained to the participants verbally and through a participant information sheet upon arrival at the laboratory before obtaining written informed consent and completing a health screening questionnaire. During the trials, female participants were required to wear a bra and shorts, whereas male participants were only required to wear shorts. Height, body mass (Mettler Toledo Kcc150, Mettler Toledo, Leicester, UK), and body fat % were all measured before the test (Tanita Corporation, Tokyo, Japan). Participants entered an environmental control room at 25 °C and 50% RH after completing body composition measurements. Participants were asked to lay supine on a medical bed and were unable to see the application of the friction device to prevent any bias. A 10-min baseline period was used to familiarise participants with all experimental equipment and subjective scales.
To evaluate the perception of the applied fabric texture, i.e. roughness and smoothness, an adapted ordinal bipolar balanced scale was used (Raccuglia et al. Citation2018); while to assess user perception of fabric stickiness, i.e. slipperiness and stickiness, a seven-point modified bipolar scale was used by appropriately adapting the scales used in Hollins et al. (Hollins et al. Citation1993). A three-anchor visual analogue scale was used to measure participant confidence in their texture perception response, and an adapted bipolar, balanced ordinal scale was used to assess the pleasantness sensation of the tested fabric samples (Raccuglia et al. Citation2018). A five-anchor visual scale was used to indicate discomfort, which ranged from ‘Extremely Uncomfortable’ to ‘Comfortable’ (Griffiths and Boyce Citation1971). Each scale was adapted such that numerical values were removed, therefore allowing participants to note their exact rating on the scale by placing a mark on the scale (i.e. between descriptor anchors). A pen was used to indicate where on the line the ratings were perceived. The scales used in the experiment were shown in .
Figure 1. Texture, stickiness, pleasantness, discomfort, and the confidence of texture perception scales.
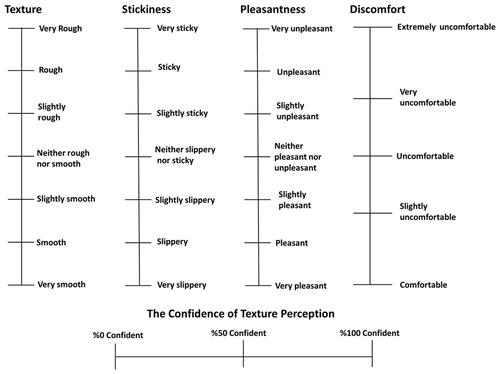
The participants′ ratings were measured by using a steel ruler. The length of each scale was 200 mm starting from the bottom anchor (0 mm) to the top anchor (200 mm), and the distance between the anchors was equal. Participants were informed about reference points equating to very rough (such as feeling like dry wool) and very smooth (such as feeling like dry silk); very sticky (where the probe does not move on the skin at all), very slippery (where the probe moves on the skin without any resistance).
The local skin temperature was measured using a single spot infra-red thermometer (FLUKE 566, Fluke Corporation, USA), while cutaneous moisture content in epidermal and stratum corneum skin layers was measured using a dielectric moisture metre (MoistureMeterEpid and MoistureMETESC Compact, Delfin Technologies) before each application to participants. The skin was not treated or cleaned in a specific way, as cleaning or treating the skin just before taking a measurement would likely influence the skin friction results. Following gathering these measurements, the friction probe with the attached 100% cotton textile was applied with a normal force of 2 ± 0.5 N along with a fixed velocity of 0.04 m/s to each of the 36 selected testing body areas, as illustrated and given visual descriptions of them in , using a mixed counterbalanced order. For all applications, the probe was applied to the skin for a period of 10-s. At the end of each episode, the coefficient of skin friction to textile was taken, and participants were asked to rate their tactile perception starting with texture, then the confidence of texture perception rating, stickiness, pleasantness, and lastly discomfort. In addition, the internal body temperature of each participant was taken every 10 min during the study using an aural thermometer (Braun Thermo Scan® PRO 6000, Helen of Troy, USA).
2.6. Data analysis
The normal force and friction force were measured and exported into Microsoft Excel. After completing all tests, data were processed with MATLAB (version R2011b; The MathWorks Inc., MA, USA). Custom made MATLAB programme was used to calculate the peak and stable points for each cycle. The average of given peak points was used as a value of superior and inferior static skin friction coefficient, and stable points were used as a value of superior and inferior dynamic skin friction coefficient.
Statistical analysis was performed using Prism, version 9.0 (GraphPad SoftwareInc., La Jolla, CA, USA). Data are presented as means ± SD or median (25–75% quartile). The normality of all data distributions was confirmed by using the Kolmogorov Smirnov test, following which parametric statistics were applied. Independent sample t-tests were conducted on individual characteristics (age, mass, height, and BF) to investigate the difference between two independent groups (females and males). Paired-sample t-tests were performed on the mean skin temperature and aural temperature to assess the difference between the start and the end of each session.
To investigate sex and regional differences in local skin temperature (°C), hydration-stratum corneum, epidermal level (%), the coefficient of skin friction, and tactile perception, a two-way ANOVA analysis (regions × sex; 36 × 2) with post-hoc comparison was used. Many locations increase the risk of increasing type I errors when doing multiple post hoc zone comparisons, therefore Tukey corrections were applied. However, this also risked inflating type II errors, therefore corrected and uncorrected data for multiple comparisons are presented (Havenith et al. Citation2008; Lloyd, Hodder, and Havenith Citation2015) to allow the reader to judge these issues. All statistical differences between regions are provided in Supplementary Tables (Appendix, Tables A4–A7).
The static and dynamic skin friction coefficients had a strong correlation (r2 = 0.82 and r2 = 0.87 for superior and inferior direction, respectively). Both data produced mostly similar maps and findings. Therefore, instead of presenting similar results, superior, and inferior static skin friction data were used for analysing data and creating maps in this study.
The texture sensitivity was analysed using the ratio of the texture perception to the coefficient of the dynamic skin friction. The stickiness sensitivity was similarly analysed using the ratio of the stickiness perception to the coefficient of the static skin friction.
3. Results
3.1. Participant characteristics
No significant difference was found in age between females and males (25.18 ± 3.56 vs. 23.78 ± 3.39 years, p = 0.407), while males were taller and heavier than females (stature, 176.6 ± 4.79 vs. 165.8 ± 8.09 cm, p = 0.004; body mass, 73.61 ± 13.60 vs. 61.26 ± 11.66 kg, p = 0.045), and females had higher body fat percentage than males (26.18 ± 6.30 vs. 17.63 ± 6.13%, p = 0.009).
3.2. Body temperature, skin temperature, and skin hydration
The hydration and skin temperature data are provided in Supplementary Materials (Appendix 1, Table A1) for female and male participants. The mean skin temperature and aural body temperature did not significantly change throughout the study (31.5 ± 0.3 °C; 36.9 ± 0.1 °C, p = 0.45, respectively). Local skin temperature, hydration-stratum corneum, and epidermal level (%) measurements were significantly different across the 36 testing body areas (p < 0.001). No significant difference was found in the local skin temperature and hydration-stratum corneum between females and males (p = 0.098, p = 0.160, respectively), but there was a significant effect of sex on hydration-epidermal level (%) (p = 0.032).
3.3. Static skin friction coefficient—regional variation and sex differences
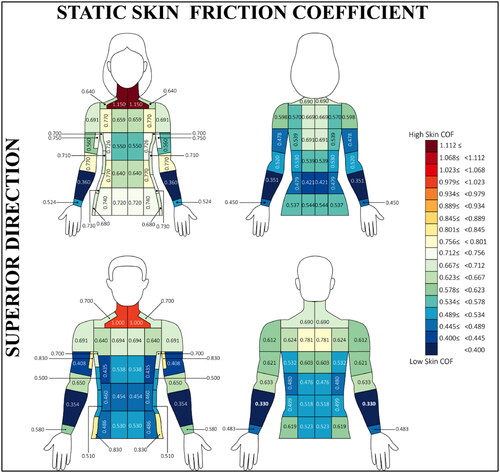
The regional values of superior and inferior static skin COF for both female and male participants are presented in Supplementary Materials (Appendix 2, Tables A2 and A3). Two-way ANOVA revealed that there was a significant main effect of regions on the superior and inferior-static skin COF (p < 0.001). The distribution of superior-static skin COF for females and males are illustrated in . The anterior neck had the highest superior-skin COF in both females and males, of 1.15 (1.15–1.44) and 1.00 (0.74–1.11), respectively. The posterior forearm had the lowest superior-skin COF, of 0.35 (0.31–0.48) and (0.33 (0.32–0.41), respectively. Moreover, two-way ANOVA showed that there were no significant effects of sex on superior static skin COF (p = 0.681).
Figure 2. The females (n = 11) and males (n = 9) of superior static skin COF distribution across the 36 tested regions. All measurements were taken from the left-hand side of the body assuming symmetry (Claus et al. Citation1987; Meh and Denišlič Citation1994).
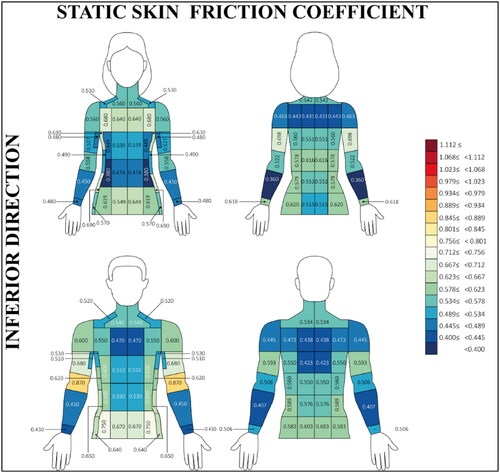
The distribution of inferior-static skin COF in males and females is illustrated in . The upper lateral chest showed the highest inferior-static skin COF of 0.68 (0.57–0.86) in females whilst the posterior forearm had the lowest inferior-static skin COF of 0.53 (0.42–0.72). However, the cubital fossa had the highest inferior-static skin COF of 0.87 (0.71–0.97) in males and the posterior forearm had the lowest inferior-static skin COF of 0.41 (0.37–0.63).
Figure 3. The females (n = 11) and males (n = 9) of inferior static skin COF distribution across the 36-testing location. All measurements were taken from the left-hand side of the body assuming asymmetry (Claus et al. Citation1987; Meh and Denišlič Citation1994).
Post-hoc region comparisons with and without Tukey correction for females and males were provided in Supplementary Materials (Appendix 3, Tables A4–A7).
3.4. Tactile perception—regional variation and sex differences
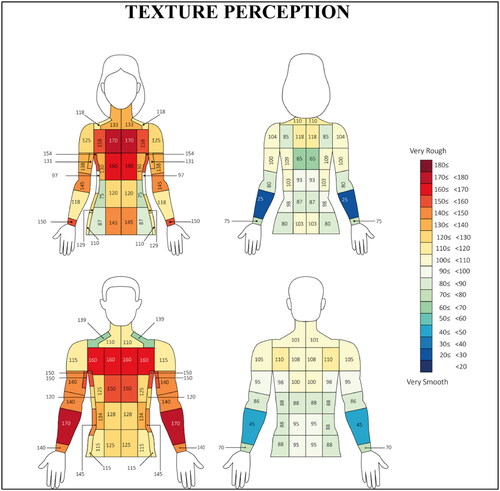
The maps of texture perception for males and females are shown in . A significant difference in texture perception was found across body locations (p < 0.001). Participants generally rated higher texture perception in their anterior aspects compared to posterior and lateral regions. Indeed, the highest texture perception was on the upper medial chest of female participants at 170 (138–182), while upper medial chest of male participants was second highest, with the anterior forearm of male participants also rated as 170 (114–171.5).
Figure 4. The females (n = 11) and males (n = 9) of texture perception distribution across the 36-testing location. All measurements were taken from the left-hand side of the body assuming asymmetry (Claus et al. Citation1987; Meh and Denišlič Citation1994).
shows the distribution of stickiness scores for male and female participants. There were significant differences in stickiness perception across the tested body regions (p < 0.001). Participants perceived greater stickiness in their anterior and lateral aspects, in comparison to posterior regions. Female participants demonstrated the highest stickiness perception scores of 130 (103–150) on their anterior neck, whereas males had the highest stickiness perception scores of 133 (81.5–164.5) on their lateral torso. The results did not reveal a significant overall effect of sex on stickiness perception (p = 0.637).
Figure 5. The females (n = 11) and males (n = 9) of stickiness perception distribution across the 36-testing location. All measurements were taken from the left-hand side of the body assuming asymmetry (Claus et al. Citation1987; Meh and Denišlič Citation1994).
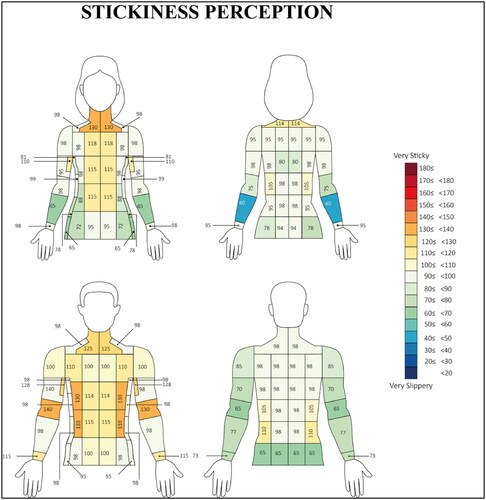
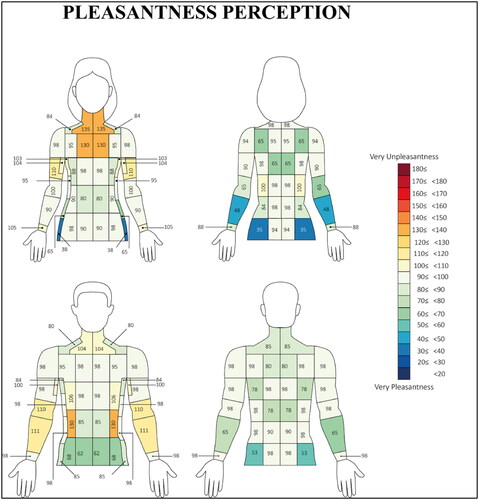
presents the distribution of the pleasantness perception for male and female participants. A two-way ANOVA revealed that there was a significant difference across the body regions (p < 0.001). Female participants perceived the anterior neck test site as the most unpleasant with a rating of 135 (125–150), while male participants ranked the anterior forearm as the most unpleasant test site with a rating of 111 (84–159).
Figure 6. The females (n = 11) and males (n = 9) of pleasantness perception distribution across the 36-testing location. All measurements were taken from the left-hand side of the body assuming asymmetry (Claus et al. Citation1987; Meh and Denišlič Citation1994).
Due to many comparisons, the data was checked with and without Tukey correction. These comparisons are presented in Supplementary Materials (Appendix 4, Tables A8–A13).
There was no significant difference in the scores of discomfort perception across the body regions (p = 0.131), and no significant difference was found between the score of discomfort perception of female and male participants (p = 0.061).
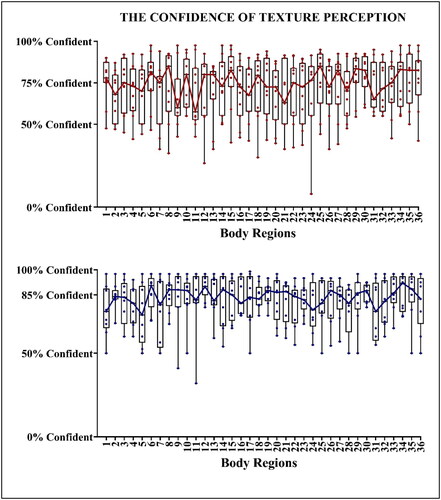
No significant correlation was found between the confidence of texture perception and the body test regions in both male and female participants as shown in (p = 0.275). However, there was a significant difference in confidence level in texture perception across female and male participants (p = 0.037). Males rated their texture perception at a higher level of confidence in comparison to the ratings of female participants (mean difference: 10%).
Figure 7. Individual data and box and whiskers with median connection line of the confidence of texture sensation ratings for forearm (above) and male (below).
3.5. The tactile sensitivity to skin friction—regional variation and sex differences
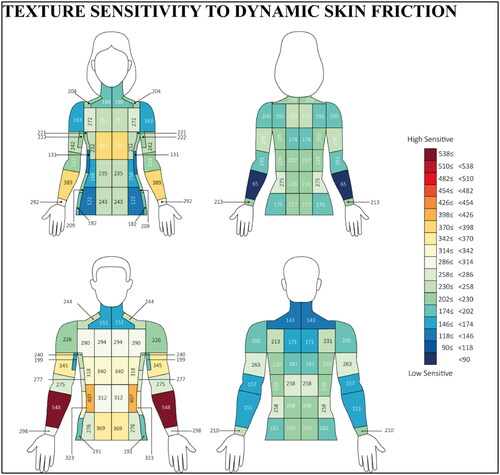
To understand mechanoreceptor behaviour, the tactile perceptions were normalised to the skin friction coefficient using the ratio of texture perception to the coefficient of the dynamic skin friction. We termed this tactile sensitivity. There was a significant difference in the texture sensitivity across the tested body regions (p < 0.001). The distribution of texture sensitivity is shown in . The anterior forearm had the highest texture sensitivity in both females and males, 389 (243–519) and 548 (361–666), respectively. The posterior forearm of female and posterior neck of male had the lowest texture sensitivity of 65 (49–188) and 143 (99–422), respectively. No significant sex effect was found with regard to the texture sensitivity (p = 0.09).
Figure 8. The body mapping of texture sensitivity to dynamic skin friction.
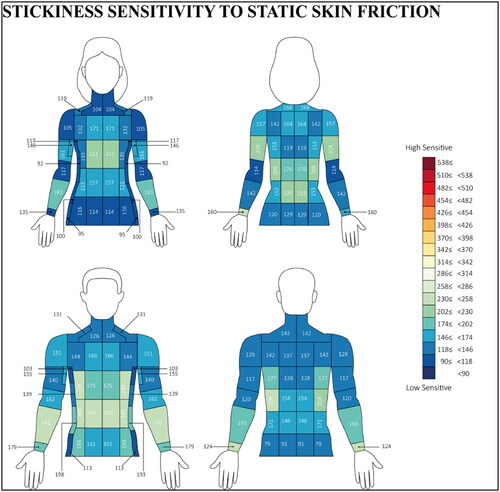
Similarly, the ratio of stickiness perception to the coefficient of the static skin friction was measured to evaluate the stickiness sensitivity to static skin friction. There was a significant difference in the stickiness sensitivity across the range of test regions (p = 0.005). This distribution of stickiness sensitivity is shown in . The upper medial waist had the highest stickiness sensitivity in females at 225 (122–258) and the lateral torso had the highest stickiness sensitivity in males at 248 (187–478). However, the upper lateral side of female and lower lateral waist of male had the lowest stickiness sensitivity of 92 (78–189) and 79 (33–158), respectively. No significant effect of sex was found on the stickiness sensitivity (p = 0. 178).
Figure 9. The body mapping of stickiness sensitivity to static skin friction.
3.6. Relationship between tactile perceptions and skin friction coefficient
The static skin friction coefficient was not related to the tactile perceptions—texture, stickiness, comfort, and pleasantness—(p = 0.732, p = 0.381, p = 0.354, and p = 0.944, respectively). Similarly, the dynamic skin friction coefficient was not related to tactile perceptions—texture, stickiness, comfort, and pleasantness—(p = 0.598, p = 0.337, p = 0.802, and p = 0.804, respectively).
4. Discussion
4.1. Hypothesis 1—the skin friction coefficient to textile would vary across the body regions
It is well known that the physical and physiological features of the skin are different across the body. The skin friction coefficient with regard to a cotton textile across six test regions was investigated (Temel, Johnson, and Lloyd Citation2022). To further those insights, results from this investigation showed that the friction coefficient in skin-textile interaction varied considerably across thirty-six anatomical regions (p < 0.01). The anterior neck had a high friction level in females and males. Upper anterior and posterior torso, anterior shoulder, anterior elbow, and lateral sides on both females and males had a moderate level of skin friction. Also, the lateral chest of females had a moderate level of skin friction. The skin can be considered as a viscoelastic material so that physical features of the skin, e.g. skin young’s modulus, shear strength, and layer thickness, may influence skin friction behaviour via changes in skin elasticity, as well as the presence of muscle tissue and fat under the dermis layer (Veijgen, van der Heide, et al. Citation2013). This finding broadly supports the work of other studies which found that the skin friction coefficient varies across the body regions (Cua, Wilhelm, and Maibach Citation1990, Citation1995; Ramalho et al. Citation2007; Veijgen, Masen, et al. Citation2013; Zhu et al. Citation2011; Hendriks and Franklin Citation2010; Gitis and Sivamani Citation2004; Derler et al. Citation2009; Zhang and Mak Citation1999; Manuskiatti, Schwindt, and Maibach Citation1998). Although regional differences in skin friction coefficient have been investigated, the number of test regions have previously been limited, as well as knowledge relating to understanding the regional skin friction coefficient in the skin-textile interaction.
4.2. Hypothesis 2—the tactile perception of textiles would vary across the body regions
A previous study tested six body regions and the results showed that individuals rated their tactile perception significantly different across a range of test regions (Temel, Johnson, and Lloyd Citation2022). Based on these findings, 36 regions across the upper body were tested to establish a map of tactile perception for the upper body, as shown in (texture), (stickiness), and (pleasantness). The results showed that there was a significant difference in texture, stickiness, and pleasantness perception across the tested regions. However, based on this data alone, it is not possible to conclude the reasons for such difference. This is because the interregional difference in tactile perception can be because of changes in the physical features of the skin (e.g. the skin friction coefficient, the elasticity of the skin, as well as the presence of fat, muscle, and bone), physiological factors (e.g. mechano-receptors distributions and innervations) or psychological (e.g. previous experience) features.
4.3. Hypothesis 3—the tactile sensitivity to skin friction would vary across the various tested body regions
The static skin friction describes ‘the resistance to the force tangential to the interface which is just sufficient to initiate relative motion between two bodies under load’ (Naz, Jamil, and Sherani Citation2014). To understand the sensitivity across the body, the stickiness perception was normalised to static skin friction coefficient in this study, and sensitivity mapping was created by calculated sensitivity for each testing body region (). Similarly, dynamic skin friction describes ‘the friction between two surfaces in relative motion’ (Naz, Jamil, and Sherani Citation2014). To understanding texture sensitivity across the body, the dynamic skin friction coefficient was associated with texture perception in this study, and the texture perception was normalised to dynamic skin friction coefficient, and sensitivity mapping was created by calculated sensitivity for each testing body region (). The results revealed that there was a significant difference in the texture and stickiness sensitivity across the testing body regions. This may suggest that mechano-receptors distributions and/or innervations sensitivity might partially explain the reasons that participants perceived their textile sensations to be different across various body regions. Moreover, each spinal nerve carries somatic sensory information from a specific area of the skin on the surface of the body (dermatome) to the central nervous system through the spinal cord (Martini et al. Citation2014); thus, the transmission of afferent information may vary depending on the spinal level associated with that dermatome.
4.4. Hypothesis 4—there would be a significant sex difference in the skin friction coefficient and tactile perception across the various tested body regions
The results of this study showed that there was no significant sex difference in the skin friction coefficient. The findings of the current study support the previous research found there was no significant sex difference in skin friction coefficient across the limited number of tested body regions (Comaish, Harborow, and Hofman Citation1973; Veijgen, van der Heide, et al. Citation2013; Cua, Wilhelm, and Maibach Citation1990; Gerhardt et al. Citation2008; Kenins Citation1994; Gitis and Sivamani Citation2004).
The results showed that there were no sex-related differences in tactile perception (roughness, stickiness, pleasantness, discomfort). There is no difference in density or dispersion of sensory nerve terminals in the epidermis between men and women (Giacomoni, Mammone, and Teri Citation2009) as well as no significant sex effect on tactile sensitivity to mechanical stimulation and hedonic experience to materials having various texture properties over the different body regions (Stevens and Choo Citation1996; Essick et al. Citation2010). Although few studies are investigated the sex-related difference in touch sensitivity, to our knowledge, no previous literature has investigated the sex effect on the tactile perception of textiles. It is important to bear in mind a ‘matched-groups approach’ was not used to examine sex differences, thereby nullifying the effect of, e.g. body morphology in the present study. Therefore, further work is required to understand the effect of sex on tactile perception.
4.5. Study perspective
In addition to hypotheses presented previously, the confidence level of texture perception was tested, and the results showed that the confidence level of texture sensation did not depend on test regions and the median level of certainty was 75% in females and 85% in males. Participants scored a similar level of confidence in their texture perception to our previous observation of thermal sensation (Temel, Johnson, et al. Citation2021). Like thermal, pain, itch, and tactile perception is a fundamental cutaneous sense, which may explain similar confidence ratings (McGlone and Reilly Citation2010; Filingeri, Hodder, and Havenith Citation2015; Tominaga and Caterina Citation2004; Mather Citation2016; Goldstein Citation2013). It would be interesting to explore further our understanding of multisensory perceptions, such as wetness, stickiness, and comfort, and bring into question the validity of observations using sensorial scales for complex psychophysiological phenomena (Filingeri, Hodder, and Havenith Citation2015; Filingeri et al. Citation2014; Raccuglia et al. Citation2018; Maggie et al. Citation2018; Bertaux, Lewandowski, and Derler Citation2007; Hollins et al. Citation1993).
5. Conclusion
The presented study examined four hypotheses underlying skin friction measurements, with key findings demonstrating that skin friction varied across the body regions, with the anterior neck being the highest friction areas in males and females. Also, there was a significant difference in texture, stickiness, and pleasantness but not in discomfort perception across the tested body regions. Participants felt test textiles to be rougher and stickier on their anterior torso in comparison to other parts of the body. There was a significant difference in the tactile sensitivity to skin friction across tested body regions. The tactile perception did not depend on the physical features but might depend on physiological and psychological factors. There was no difference between males and females′ skin friction coefficient, tactile perception, and sensitivity.
The findings from this work can be beneficial for clothing design development and to improve the experience and functionality of clothing.
Author contributions
All authors contributed to the study conception and design. Material preparation, data collection, and analysis were performed by Mevra Temel. Manuscript creation was led by Mevra Temel with input from the co-authors.
Supplemental Material
Download MS Word (1.2 MB)Acknowledgements
I would like to thank Alex Robertson of Loughborough University’s School of Design & Creative Arts for supporting the visualization of figures (human body maps).
Disclosure statement
No potential conflict of interest was reported by the author(s).
Additional information
Funding
References
- Bertaux, Emilie, Maryline Lewandowski, and Siegfried Derler. 2007. “Relationship between Friction and Tactile Properties for Woven and Knitted Fabrics.” Textile Research Journal 77 (6): 387–396. doi:10.1177/0040517507074165.
- Claus, D., M.J. Hilz, I. Hummer, and B. Neundörfer. 1987. “Methods of Measurement of Thermal Thresholds.” Acta Neurologica Scandinavica 76 (4): 288–296. doi:10.1111/j.1600-0404.1987.tb03583.x.
- Comaish, J.S., P.R.H. Harborow, and D.A. Hofman. 1973. “A Hand‐Held Friction Meter.” The British Journal of Dermatology 89 (1): 33–35. doi:10.1111/j.1365-2133.1973.tb01914.x.
- Cua, A.B., K.P. Wilhelm, and H.I. Maibach. 1990. “Frictional Properties of Human Skin: Relation to Age, Sex and Anatomical Region, Stratum Corneum Hydration and Transepidermal Water Loss.” The British Journal of Dermatology 123 (4): 473–479. doi:10.1111/j.1365-2133.1990.tb01452.x.
- Cua, Anastasia B., Klaus P. Wilhelm, and Howard I. Maibach. 1995. “Skin Surface Lipid and Skin Friction: Relation to Age, Sex and Anatomical Region.” Skin Pharmacology 8 (5): 246–251. doi:10.1159/000211354.
- Derler, S., U. Schrade, and L.C. Gerhardt. 2007. “Tribology of Human Skin and Mechanical Skin Equivalents in Contact with Textiles.” Wear 263 (7–12): 1112–1116. doi:10.1016/j.wear.2006.11.031.
- Derler, S., L.C. Gerhardt, A. Lenz, E. Bertaux, and M. Hadad. 2009. “Friction of Human Skin against Smooth and Rough Glass as a Function of the Contact Pressure.” Tribology International 42 (11–12): 1565–1574. doi:10.1016/j.triboint.2008.11.009.
- Duncan, S., T. Mclellan, and E.G. Dickson. 2011. “Improving Comfort in Military Protective Clothing.” In Improving Comfort in Clothing, 320–369. Woodhead Publishing. doi:10.1016/B978-1-84569-539-2.50013-2.
- Essick, Greg K., Francis McGlone, Chris Dancer, David Fabricant, Yancy Ragin, Nicola Phillips, Therese Jones, and Steve Guest. 2010. “Quantitative Assessment of Pleasant Touch.” Neuroscience and Biobehavioral Reviews 34 (2): 192–203. doi:10.1016/j.neubiorev.2009.02.003.
- Filingeri, Davide, Damien Fournet, Simon Hodder, and George Havenith. 2014. “Body Mapping of Cutaneous Wetness Perception across the Human Torso during Thermo-Neutral and Warm Environmental Exposures.” Journal of Applied Physiology 117 (8): 887–897. doi:10.1152/japplphysiol.00535.2014.
- Filingeri, Davide, Simon Hodder, and George Havenith. 2015. “The Neurophysiology and Assessment of Human Skin Wetness Perception.” In Agache’s Measuring the Skin, edited by Philippe Humbert, Howard Maibach, Ferial Fanian, and Pierre Agache. Cham: Springer. doi:10.1007/978-3-319-26594-0.
- Fournet, Damien, Lindsey Ross, Thomas Voelcker, Bernard Redortier, and George Havenith. 2013. “Body Mapping of Thermoregulatory and Perceptual Responses of Males and Females Running in the Cold.” Journal of Thermal Biology 38 (6): 339–344. doi:10.1016/j.jtherbio.2013.04.005.
- Gerhardt, L.C., V. Strässle, A. Lenz, N.D. Spencer, and S. Derler. 2008. “Influence of Epidermal Hydration on the Friction of Human Skin against Textiles.” Journal of the Royal Society, Interface 5 (28): 1317–1328. doi:10.1098/rsif.2008.0034.
- Gerrett, Nicola. 2019. “Body Mapping of Perceptual Responses to Sweat and Warm Stimuli and Their Relation to Physiological Parameters.” PhD thesis., Loughborough University.
- Gerrett, Nicola, Yacine Ouzzahra, Bernard Redortier, Thomas Voelcker, and George Havenith. 2015. “Female Thermal Sensitivity to Hot and Cold during Rest and Exercise.” Physiology & Behavior 152 (Pt A): 11–19. doi:10.1016/j.physbeh.2015.08.032.
- Giacomoni, Paolo U., Thomas Mammone, and Matthew Teri. 2009. “Gender-Linked Differences in Human Skin.” Journal of Dermatological Science 55 (3): 144–149. doi:10.1016/j.jdermsci.2009.06.001.
- Gitis, Norm, and Raja Sivamani. 2004. “Tribometrology of Skin.” Tribology Transactions 47 (4): 461–469. doi:10.1080/05698190490493355.
- Goldstein, E. Bruce. 2013. Sensation and Perception. Cengage Learning. www.cengagebrain.com.
- Gong, Zheng, Xinming Qian, and Mengqi Yuan. 2019. “Structural Design of a 3-D Printed Stab Resistant Body Armor.” Rapid Prototyping Journal 25 (1): 143–151. doi:10.1108/RPJ-05-2017-0086.
- Griffiths, I.D., and P.R. Boyce. 1971. “Performance and Thermal Comfort.” Ergonomics 14 (4): 457–468. doi:10.1080/00140137108931266.
- Havenith, George, Alison Fogarty, Rebecca Bartlett, Caroline J. Smith, and Vincent Ventenat. 2008. “Male and Female Upper Body Sweat Distribution during Running Measured with Technical Absorbents.” European Journal of Applied Physiology 104 (2): 245–255. doi:10.1007/s00421-007-0636-z.
- Hendriks, C.P., and S.E. Franklin. 2010. “Influence of Surface Roughness, Material and Climate Conditions on the Friction of Human Skin.” Tribology Letters 37 (2): 361–373. doi:10.1007/s11249-009-9530-7.
- Hollins, Mark, Richard Faldowski, Suman Rao, and Forrest Young. 1993. “Perceptual Dimensions of Tactile Surface Texture: A Multidimensional Scaling Analysis.” Perception & Psychophysics 54 (6): 697–705. doi:10.3758/BF03211795.
- Johnson, Andrew, Guy A. Bingham, and David I. Wimpenny. 2013. “Additive Manufactured Textiles for High-Performance Stab Resistant Applications.” Rapid Prototyping Journal 19 (3): 199–207. doi:10.1108/13552541311312193.
- Kenins, P. 1994. “Influence of Fiber Type and Moisture on Measured Fabric-to-Skin Friction.” Textile Research Journal 64 (12): 722–728. doi:10.1177/004051759406401204.
- Klosterman, Donald A., Richard P. Chartoff, Nora R. Osborne, George A. Graves, Allan Lightman, Gyoowan Han, Akos Bezeredi, and Stan Rodrigues. 1999. “Development of a Curved Layer LOM Process for Monolithic Ceramics and Ceramic Matrix Composites.” Rapid Prototyping Journal 5 (2): 61–71. doi:10.1108/13552549910267362.
- Liu, Yanfeng, Lijuan Wang, Yuhui Di, Jiaping Liu, and Hao Zhou. 2013. “The Effects of Clothing Thermal Resistance and Operative Temperature on Human Skin Temperature.” Journal of Thermal Biology 38 (5): 233–239. doi:10.1016/j.jtherbio.2013.03.001.
- Lloyd, Alex, Simon Hodder, and George Havenith. 2015. “The Interaction between Peripheral and Central Fatigue at Different Muscle Temperatures during Sustained Isometric Contractions.” American Journal of Physiology. Regulatory, Integrative and Comparative Physiology 309 (4): R410–R420. doi:10.1152/ajpregu.00061.2015.
- Maggie, Ka Po, Kam Hong Chau, Chi Wai Kan, and Jin Tu Fan. 2018. “Magnitude Estimation Approach for Assessing Stickiness Sensation Perceived in Wet Fabrics.” Fibers and Polymers 19 (11): 2418–2430. doi:10.1007/s12221-018-8626-9.
- Manuskiatti, I.V., D.A. Schwindt, and H.I. Maibach. 1998. “Influence of Age, Anatomic Site and Race on Skin Roughness and Scaliness.” Dermatology 196 (4): 401–407. doi:10.1159/000017932.
- Martini, Frederic H., William C. Ober, Judi L. Nath, Edwin F. Bartholomew, and Kevin Petti. 2014. Visual Anatomy and Physiology. Testbanktop.Com. http://testbanktop.com/wp-content/uploads/2016/11/Downloadable-Solution-Manual-for-Visual-Anatomy-Physiology-2nd-Edition-Martini-FM_instructor_manual-1.pdf
- Mather, George. 2016. Foundations of Sensation and Perception. Foundations of Sensation and Perception. 2nd ed. Psychology Press. doi:10.4324/9781315672236.
- McGlone, Francis, and David Reilly. 2010. “The Cutaneous Sensory System.” Neuroscience and Biobehavioral Reviews 34 (2): 148–159. doi:10.1016/j.neubiorev.2009.08.004.
- Meh, Duška, and Miro Denišlič. 1994. “Quantitative Assessment of Thermal and Pain Sensitivity.” Journal of the Neurological Sciences 127 (2): 164–169. doi:10.1016/0022-510X(94)90069-8.
- Moncrieff, R. W. 2008. Military Textiles. Elsevier. doi:10.1533/9781845694517.
- Naz, Sabhia, Abu Waris Jamil, and F.S. Sherani. 2014. “Skin Friction Coefficient as a Parameter for Temperament Assessment: A Review.” International Journal of Scientific & Technology Research 3 (4): 178–81 doi:10.1007/s11249-011-9854-y.
- Ouzzahra, Yacine, George Havenith, and Bernard Redortier. 2012. “Regional Distribution of Thermal Sensitivity to Cold at Rest and during Mild Exercise in Males.” Journal of Thermal Biology 37 (7): 517–523. doi:10.1016/j.jtherbio.2012.06.003.
- Raccuglia, Margherita, Christian Heyde, Alex Lloyd, Simon Hodder, and George Havenith. 2019. “The Use of Infrared Thermal Imaging to Measure Spatial and Temporal Sweat Retention in Clothing.” International Journal of Biometeorology 63 (7): 885–894. doi:10.1007/s00484-019-01701-5.
- Raccuglia, Margherita, Kolby Pistak, Christian Heyde, Jianguo Qu, Ningtao Mao, Simon Hodder, and George Havenith. 2018. “Human Wetness Perception of Fabrics under Dynamic Skin Contact.” Textile Research Journal 88 (19): 2155–2168. doi:10.1177/0040517517716905.
- Ramalho, A., C.L. Silva, A.A.C.C. Pais, and J.J.S. Sousa. 2007. “In Vivo Friction Study of Human Skin: Influence of Moisturizers on Different Anatomical Sites.” Wear 263 (7–12): 1044–1049. doi:10.1016/j.wear.2006.11.051.
- Sivamani, Raja K., Jack Goodman, Norm V. Gitis, and Howard I. Maibach. 2003. “Friction Coefficient of Skin in Real-Time.” Skin Research and Technology 9 (3): 235–239. doi:10.1034/j.1600-0846.2003.20361.x.
- Smith, Caroline J., and George Havenith. 2011. “Body Mapping of Sweating Patterns in Male Athletes in Mild Exercise-Induced Hyperthermia.” European Journal of Applied Physiology 111 (7): 1391–1404. doi:10.1007/s00421-010-1744-8.
- Stevens, Joseph C., and Kenneth K. Choo. 1996. “Spatial Acuity of the Body Surface over the Life Span.” Somatosensory & Motor Research 13 (2): 153–166. doi:10.3109/08990229609051403.
- Temel, Mevra, Andrew A. Johnson, George Havenith, Josh T. Arnold, Anna M. West, and Alex B. Lloyd. 2021. “An Examination of Five Theoretical Foundations Associated with Localized Thermosensory Testing.” European Journal of Applied Physiology 121 (7): 1943–1954. doi:10.1007/s00421-021-04670-z.
- Temel, Mevra, Andrew A. Johnson, and Alex B. Lloyd. 2022. “Evaluating the Repeatability of Friction Coefficient Measurements and Tactile Perceptions in Skin–Textile Interactions across Body Regions.” Tribology Letters 70 (1): 1–12. doi:10.1007/s11249-021-01560-5.
- Temel, Mevra, Alex B. Lloyd, and Andrew A. Johnson. 2021. “Evaluating the Design and Repeatability of a Novel Device to Measure Friction of Mechanical Surrogate Skins in Contact with Cotton Textiles.” Tribology Letters 69 (4): 121. doi:10.1007/s11249-021-01502-1.
- Tominaga, Makoto, and Michael J. Caterina. 2004. “Thermosensation and Pain.” Journal of Neurobiology 61 (1): 3–12. doi:10.1002/neu.20079.
- Veijgen, N.K., E. van der Heide, and M.A. Masen. 2013. “A Multivariable Model for Predicting the Frictional Behaviour and Hydration of the Human Skin.” Skin Research and Technology 19 (3): 330–338. doi:10.1111/srt.12053.
- Veijgen, N.K., M.A. Masen, and E. van der Heide. 2013. “Variables Influencing the Frictional Behaviour of In Vivo Human Skin.” Journal of the Mechanical Behavior of Biomedical Materials 28: 448–461. doi:10.1016/j.jmbbm.2013.02.009.
- Zhang, M., and A.F.T. Mak. 1999. “In Vivo Friction Properties of Human Skin.” Prosthetics and Orthotics International 23 (2): 135–141. doi:10.3109/03093649909071625.
- Zhu, Y.H., S.P. Song, W. Luo, P.M. Elias, and M.Q. Man. 2011. “Characterization of Skin Friction Coefficient, and Relationship to Stratum Corneum Hydration in a Normal Chinese Population.” Skin Pharmacology and Physiology 24 (2): 81–86. doi:10.1159/000321993.