
Abstract
The COVID-19 pandemic led to growing concerns about pilots’ proficiency due to the significant decrease in flight operations. The objective of this research is to provide a proactive approach to mitigate potential risks in flight operations associated with the impact of the COVID-19 pandemic using flight data monitoring (FDM). The results demonstrated significant associations between the pandemic impacts and FDM exceedance categories, flight phases and fleets. Manual flying skill decay, lack of practice effects on use of standard operating procedures and knowledge of flight deck automation should be considered by airlines when preparing for the return to normal operations. An FDM Programme allows prediction of the probability and severity of occurrences for developing an effective SMS within an airline. To mitigate the impacts of the pandemic, tailored training sessions must be implemented, and airlines should strive to avoid additional optional procedures where practicable.
Practitioner summary: The COVID-19 pandemic has raised concerns regarding pilot proficiency due to lack of practice effects. Results from the Flight Data Monitoring Programme show significant associations between the pandemic impacts and occurrence categories, fleets, and flight phases. FDM can be applied to mitigate the probability and severity of occurrences for airlines developing effective safety management systems.
There is a significant association between the COVID-19 pandemic stages and FDM events in different flight phases, FDM categories, and aircraft types
The COVID-19 pandemic led to a significant increase in FDM exceedances, especially for precursors on runway excursion and go-arounds
Airlines should carefully plan training sessions for pilots as the disruptions due to the pandemic led to a lack of practice effect in flight operations
Reviewing FDM data may have contributions to establish proactive SMS and mitigate COVID-19 impacts to aviation safety
HIGHLIGHTS
1. Introduction
The COVID-19 pandemic has caused unprecedented effects to the aviation industry, as countries closed their borders and passenger demand dropped significantly (Miller Citation2020). This created unpredictable scenarios including the development and introduction of new operations (e.g., repatriation flights, airport terminal closures, health and safety requirements on the flight deck and across flight operations, etc.) which created novel tasks for many aviation personnel (Christidis and Christodoulou Citation2020). Aviation professionals were furloughed, and crew duty rosters were changed to fewer flights and longer duty times, especially for long-haul flight pilots and cabin crews. Some negative effects on operational safety have been identified through data analysis by Flight Data Monitoring (FDM), such as a rise in unstable approaches, airport disruptions, risk occurrences, and even possible factors of incidents/accidents (Jarry, Delahaye, and Feron Citation2021; Werfelman Citation2021). The aviation sector is a complex system, characterised by tight couplings among different sub-systems such as airlines, regulators, airports, and aircraft manufacturers (Harris and Stanton Citation2010). The ‘new normal’ in aviation, caused by COVID-19, is an emerging state which was unpredictable prior to the pandemic, and which remains unpredictable today, due to the possibilities of new virus variants. The significant reduction in flights due to the pandemic not only limited pilots’ recency in performing routine tasks, but also potentially increased operational risks in aviation. The extended period of low recency affects pilots’ skill retention (EASA Citation2021). Furthermore, new procedures have been developed to cope with the changes in flight operations related to COVID-19 safety and health regulations (Olaganathan and Amihan Citation2021). Pilots’ proficiency highly depends on the frequency of practicing their skills and the required standard operational procedures (SOPs) associated with flight operations, as the ability of skill retention will decline after a long period of disuse (Ammons et al. Citation1958). Skill fade can be split between manual flying skills and knowledge proficiency regarding aircraft systems, procedures, briefings and memory items (EASA Citation2020; Ebbatson et al. Citation2010). Monitoring pilots’ performance has therefore become paramount in ensuring aviation safety. This highlights the benefits of FDM for airlines in monitoring the safety of flight operations and developing corresponding mitigation measures within their safety management system.
1.1. The objective of implementing an FDM programme
The objective of implementing an airline FDM Programme is to shift from a purely reactive approach to safety based on crew’s reporting incidents to a proactive approach of identifying potential risks and implementing mitigation measures. FDM can therefore be used as a safety assurance tool and should be integrated as a core component of an airline’s Safety Management System (SMS). It is an explicit element of the corporate management system associated with flight operations to achieve high levels of safety performance (EASA Citation2019; Elliott and Woodward Citation2007). FDM helps to identify deviations from Standard Operating Procedures (SOPs). Therefore, operational risks which may require mitigating actions in the form of improved simulator training or revised SOPs for a specific aircraft type, operated in a specific airport or operational environment. Operators are required to be efficient by their organisation in order to optimise cost-efficiency, unless there is an accident in which hindsight points towards thoroughness instead of efficiency (Dekker, Cilliers, and Hofmeyr Citation2011).
Given the important role of FDM in aviation safety, advanced techniques in data analytics, deep-learning, and machine learning have been developed to detect anomalies during flights. For example, Matthews et al. (Citation2014) proposed Multiple-Kernel Anomaly Detection, which could combine information from multiple data sources and then identify whether the entire fight is an abnormal event; a clustering technique based on Gaussian Mixture Model (GMM) was employed to detect unusual data patterns in flights, which might be an indicator for increasing level of risks (L. Li et al. Citation2016); some studies employed autoencoders, one of the powerful techniques in deep learning, to detect unknown hazards during the approach phase (Fernández et al. Citation2019). The pandemic has created an effect whereby airlines have had to cut costs wherever possible, whereas the pandemic’s possible effects including increased crew fatigue, decreased morale, skill, and proficiency decay may have led to operational risks. Whilst some events and incidents are unavoidable, and while aiming for zero-event operations is well-intended, it is safer to aim for a reduction in event severity rather than event frequency in flight operations (Holtom Citation2007).
The direct impact of the pandemic on pilot proficiency has been considered as negative effect due to the reduced number of flights. Modern aircraft feature complicated automated systems, and operating an aircraft requires routine in manual flying skills combined with cognitive information processing, applying various procedures (cockpit flow patterns) and dealing with Air Traffic Control (W.-C. Li et al. Citation2020). The inherent complexity of aircraft operations, which causes a higher level of cognitive skills demand, makes it more difficult for pilots to maintain routine in monitoring and performing operational tasks (Hendrickson, Goldsmith, and Johnson Citation2006). Findings of accident investigations can be made at different systemic levels which can explain the chains of possible causal factors leading to the event (W.-C. Li, Harris, and Yu Citation2008). For instance, in the case of an event involving suspected pilot skill decay, different factors might need to be taken into account. FDM covers a set of core events and considers the main areas of interest for the different flight phases (Taxi, Take-off, Cruise, Descent, Approach, Landing and Go-around) on different fleets (EASA Citation2019). Furthermore, FDM can provide objective information and detailed parameters which complement subjective aviation safety reports from flight crew, thereby improving aviation safety and operational efficiency (Chaves Citation2020; O'Leary Citation2002). Most FDM-based studies focus on the descent, approach, and landing phases as these are the most dynamic flight phases where most deviations are likely to occur (International Air Transport Association Citation2021; Smart, Brown, and Denman Citation2012). Contrary to common belief, fewer deviations occur during take-off (Flight Safety International Citation2014). In addition, the flight phases close to the ground are associated with greater cognitive complexity for crews when compared to other flight phases, and so require a greater set of piloting skills (Arthur et al. Citation1998; Ebbatson et al. Citation2010). Skill retention abilities varied depending on the tasks, which involved highly integrating behaviours, required less cognitive skills, and therefore were less prone to decay. The use of SOPs and normal checklists could be classified as rule-based behaviour, although it is dependent on experience and training. Finally, unfamiliar situations such as complex failures which do not regularly occur would fall into knowledge-based behaviour. This is the most prone to decay as it often requires greater effort from pilots in order to regain an adequate level of proficiency (Rasmussen Citation1983).
1.2. Lessons learned from previous occurrences
By addressing lessons learned from FDM events and operations analytics, the remedial strategies of SMS related to flight operations can be applied to diminish risks (EASA Citation2016). FDM can help airlines and regulators identify possible skill degradations. Deviations from acceptable values at stages of flight where the aircraft is flown manually (such as unstable approaches, high pitch events, hard touchdowns) provide insightful information about the pilots’ performance and training needs (Bromfield and Landry Citation2019). However, FDM captures only a deviation. Although pilots’ inputs (e.g., on the yoke/sidestick, rudder and throttle) are recorded, it is not possible to analyse the interactions between pilots in the cockpit and their decision-making process which led to these inputs solely through FDM (Maille Citation2015; Stogsdill Citation2022). Findings related to pilots’ flying skills on FDM can also have different confounding causes, such as operational environment factors of visibility, crosswind, runway conditions, air traffic volume etc. Weather disruption, for example, can cause an increase in FDM occurrences which would normally be related to manual flying skills and could therefore bias the results (Schultz et al. Citation2018). As the pandemic started to disrupt flight operations and flight numbers dropped significantly in 2020, there are fewer occurrences recorded by FDM Programme compared to the same stage in 2019. Short-term trend analyses therefore became more challenging, which forced airlines to revert to focus on traditional reactive analyses, where only incidents enabled new learning opportunities while the rest of the operations stayed in “survival mode” (Miller Citation2020). FDM contributes to building safety resilience by providing self-monitoring capabilities to each operator and to the associated regulator(s) in cases where the data is shared. Knowledge derived from an FDM Programme can then be used to adapt operational procedures and develop a specific training syllabus to address any observed issues on training need analysis, such as the impact of COVID-19 on Crew Resource Management (CRM) and pilots’ operational behaviours on the flight deck (EASA Citation2021).
Pilot Skill decay was already a concern among airlines and safety practitioners prior to the pandemic, however due to different reasons. The increase in aircraft automation as well as reduced opportunities for hand-flying an aircraft were a major concern until 2020. The pandemic shifted this concern to a new level: not only is there a risk of skill fade due to aircraft automation but also because pilots tend to fly much less than prior to 2020. Several factors impact the way pilots use automation and influence their skill fade. It has been determined that performance in the cockpit is highly correlated to recent flying experience (Ebbatson et al. Citation2010), and to the type of flight operation (long-haul versus short haul) (Haslbeck and Hoermann Citation2016; Haslbeck, Hoermann, and Gontar Citation2018). High workload phases in the cockpit usually occur as the aircraft is close to the ground, during take-off, approach, and landing. These phases draw heavily on of pilots’ skills both in terms of communication and workload management but also on staying ahead of the aircraft. These characteristics are likely to degrade in case of a lack of recency especially in case of shorter approach paths, which requires more anticipation from the pilots. Therefore, an increase in deviations can be expected in these flight phase in case of skill decay (Sikora, Hari, and Hanusch Citation2020).
Specific markers can help airlines identify skill decay among their pilots. FDM events such as deviations from the localizer/glideslope, late flaps, and gear extension during the approach phase and/or deviations from an assigned speed and/or altitude can demonstrate a loss of manual flying skills or automation knowledge. Equally, excessively long, or short landings (long flares or touchdown before the touchdown zone) can also be markers of skill fade (Haslbeck and Hoermann Citation2016). But, to strengthen an assumed skill fade, it might be beneficial to analyse the factors behind a specific deviation. These factors are possible crew fatigue, ATC restrictions, weather and might help understand why these deviations occurred (Haslbeck et al. Citation2014). In case of mixed-fleet flying, the skill degradation can be exacerbated as the required information retention capacity is higher. A mixed-fleet pilot might be affected by negative transfer which consist of cognitively reverting to the incorrect aircraft procedures and/or knowledge, especially during high workload tasks. Negative transfer has been found to be correlated with lack of recency (Lyall and Wickens Citation2005; Soo, Mavin, and Roth Citation2016). The collected FDM information can also be passed on to the pilots (either specific statistics about their performance, or general thematic issues), providing pilots and safety management department with additional insights (Walker Citation2017; Wang et al. Citation2019). All these measures contribute towards a more resilient system in terms of aviation safety. In addition to FDM data collection, pilots are able to provide a confidential report which may relate to safety concerns in flight operations, and this can provide useful supplementary information to the safety management system (O'Leary Citation2002). While FDM plays an important role in aviation safety, it must be recognised that both reactive (safety 1) and proactive approaches (safety 2) (Hollnagel Citation2017; Reason Citation2016) are complementary for ensuring aviation safety during the preparation for return to normal operations (Barry Citation2021; International Air Transport Association Citation2020; Oehling and Barry Citation2019).
2. Method
2.1. FDM data collection
The FDM events were examined from 123,140 flights on five fleets among the airline (short-haul aircraft – Airbus A319, A320 and A321 and long-haul aircraft – B777 and B773) operated in an international commercial airline between June 2019 and May 2021. The data contains 24 months of flights which were analysed across three ‘stages’, with each stage comprising of an eight-month period. Due to the COVID-19 pandemic spreading in January 2020, the first stage encompassed 2915 FDM events screened from 82,819 flights between June 2019 and January 2020 (before the pandemic); the second stage contained 1328 FDM events screened from 26,128 flights between February 2020 and September 2020 (beginning of the pandemic); and the third stage comprised of 518 FDM events screened from 14,193 flights between October 2020 and May 2021 (breakout of the pandemic). FDM events were in the form of a comma separated value (csv) file and included detailed information of events. The approval of the Research Ethics Committee was granted in advance of the research taking place (CURES/13839/2021). The collected data is only available to the research team and stored in accordance with the data management plan of the United Kingdom Ethical Code and the Data Protection Act. Due to the confidentiality of the data provided by the operator, it is not possible for the authors to disclose a specific description related to the data nor for an external practitioner to replicate the analysis.
The number of flights for this operator in this study had dropped by 70% when the pandemic began in 2020 (26,128 flights on the second stage), compared to levels before the pandemic in 2019 (82,819 flights on the first stage); then continued to drop by nearly 50% after outbreak of the pandemic in 2021 (14,193 flights on the third stage). The raw data from Quick Access Recorders (QARs) was first processed by the operator’s FDM department using their internal SESMA software. A value beyond a specific threshold created an FDM exceedance. The frequency of flights was weighted based on number of flights in each stage.
2.2. Measures
The FDM events typically used a seven-category flight phase grouping methodology, including Take-off, Climb, Cruise, Descent, Approach, Landing, and Go-around. In order to report on each risk within a critical category, there is a requirement to identify an FDM source to measure the operational effectiveness and safety concerns based on flight phases and type of aircraft. Some of the risk categories are supported by FDM data which consist of a list of occurrences and specific details (O'Leary Citation2002). It displays the month and year of occurrence, the flight number, the flight phase, the event’s location, the aircraft type and registration, and the description of the event along with its classification which is standardised (EASA Citation2016). The event is then classified in one of the following five main categories based on the operator’s FDM criteria: Runway Excursion (RE), Mid-Air Collision (MAC), Controlled Flight into Terrain (CFIT), Loss of Control In flight (LOC-I) and Go-Around (GA). These criteria are based on EASA’s framework for standardised FDM indicators (EASA Citation2016). In sum, five independent variables are the focus in this study, including the events (five categories), fly phases (seven flight phases), fleets (five fleets), ASRs on FDM exceedances (reported vs. no-reported) and stages (three stages).
2.3. Procedure
The FDM Programme allows an operator (airline) to analyse the information on the frequency of exceedance, combined with an estimated severity index to assess the safety risks and determine the acceptability of risks if the discovered trend continues. The probability of an event is a measure of how likely that the FDM exceedance is to occur. An estimated probability on FDM events can be assessed from the data collected using the Special Event Search and Master Analysis (SESMA), which was a major innovation for aviation safety and was adopted across the world. SESMA is a flight data recording Programme which monitors the safety of the fleets’ operations anonymously. To conduct the analysis, we collected FDM data first. The process of collecting raw data was administered by the FDM experts, who needed strong internal controls to maintain a maximum level of trust. FDM Programme can and have been successfully integrated with safety management systems, but flight data monitoring can often be viewed as a threat by pilots, due to confidentiality and anonymity fears (de Courville Citation2019). The perceived degree of trust may therefore have implications on pilots when drafting and submitting ASRs regarding FDM exceedances.
Secondly, we evaluated the trend based on FDM data. In the context of aviation safety monitoring, the trend should be present for at least eight quarters to improve the reliability of the estimation of the trend and minimise any random sampling effects (Elliott and Woodward Citation2007). This paper focuses on the probability and trend analysis on the FDM exceedance. Detecting outliers is an important task before undertaking further analysis. A value beyond a specific threshold will then create an FDM exceedance event. Analysis of those exceedance events served for continuous comparison of flight profile, engine, and system operations with a set of defined parameters for safety management and incident investigation. There are different algorithms for each FDM category and each aircraft type to measure the overall safety concern on flight operations.
2.4. Data Processing
The chi-square test is a non-parametric analysis which is used to analyse the data within an FDM Programme, screening from the total number of flights among three stages using the observed frequencies (Elliott and Woodward Citation2007). Furthermore, chi-square tests are inherently non-directional, and used to examine whether the observed frequencies and expected frequencies align with particular observed frequencies above/below the corresponding expected frequencies. To convey the meaning in a simple way, we used the term ‘association’ throughout the manuscript. That is, association means the observed frequencies and expected frequencies are different. Given numbers of flights are different at each stage, the frequency of FDM events was weighted by total flights in each stage (shown in ). That is, the frequencies were transferred into weighted frequencies (frequencies * 10,000/numbers of flights at each stage). The reason is to exclude the effect of confounding variables (i.e., numbers of flights at each stage). Pearson Chi-square statistics were applied to test the associations between stages and FDM exceedances.
Table 1. Cross tabulation of the FDM event counts (frequencies per 10,000 flights), standardised Pearson residuals, and (percentages) of five FDM categories array on column across the three stages of the pandemic displayed on rows.
Table 2. Cross tabulation on the FDM event counts (frequencies per 10,000 flights), standardised Pearson residuals, and (percentages) of FDM events on seven flight phases array on column across three stages of pandemic displayed on row.
Table 3. Cross tabulation on the FDM event counts (frequencies per 10,000 flights), adjusted standardised residuals, and (percentages) of FDM events on five fleets array on column across three stages of pandemic displayed on rows.
2.5. Statistical analysis
A Chi-square test was used to determine whether there were significant associations between categorical variables, such as the three pandemic stages and the five FDM categories. The dependent variables here represent the frequency data for each FDM category, flight phases and fleets. If the expected minimum count was less than less than five, then the Fisher’s exact test is used instead (Agresti Citation2002). The probability of FDM exceedances including event categories, flight phases, fleets, ASRs and ranges of flight among the three stages was computed using SPSS (IBM Corp Citation2021), and p values less than 0.05 were used as a cut-off for statistical significance. If the association is significant, we further examined whether the counts in each cell larger/smaller than the expected value by testing standardised Pearson residuals (Agresti Citation2002, 81), which could provide a precise analysis (Haberman Citation1973). Absolute values of standardised Pearson residuals that are more than 1.96 suggested a significant difference with a significant level at 0.05.
2.6. Hypotheses
Based on the previous literature review, specific risk categories of deviations (CFIT, LOCI, MAC, RE and GA) were identified whose frequency increase may indicate a loss of pilot proficiency (EASA Citation2016; Flight Safety International Citation2014; Smart, Brown, and Denman Citation2012). There are some underlying conditions which may associate with operational risks, but those may not be identifiable through FDM solely. Human performance influencing factors such as fatigue, airspace bustle, weather and crew workload can be difficult to be detected directly within an FDM occurrence, however it is still possible (Lager and Melin Citation2022). FDM records flight performance which consists of raw flight data analysis, such as altitude or speed deviations, it is usual to combine FDM events with Air Safety Reports (ASRs) submitted by crew members in order to gain a broader understanding of a situation beyond the available raw data (Walker Citation2017). The unprecedented pandemic may increase operational risks impacting FDM occurrences, flight phases and fleets and frequency on pilots’ ASRs submission related to human performance. Therefore, there are four hypotheses to be tested as follows,
H1:
There is a significant association between the three stages of pandemic and the percentage of the five categories on FDM exceedances
H2:
There is a significant association between the three stages of pandemic and the percentage of the seven flight phases on FDM exceedances
H3:
There is a significant association between the three stages of pandemic and the percentage of the five fleets on FDM exceedances
H4:
There is a significant association between the three stages of pandemic and the percentage of ASRs on FDM exceedances
3. Results
3.1. Sample characteristics
A total of 1384 ASRs were submitted among 4761 FDM exceedance events, retrieved from 123,140 flights on an international commercial airline, for 24 months across three stages of the pandemic (). The following categorical variables were analysed: FDM categories including CFIT, GA, LOCI, MAC and RE (), the flight phases including take-off, climb, cruise, descent, approach, landing, and go-around (), fleets including A319, A320, A321, B773 and B777 (), and frequencies of ASRs submitted among the three pandemic stages ().
Figure 1. Evolution of the number of flights, FDM events and ASRs between June 2019 and May 2021. The scale on the right-hand side (2000 per scale), displays numbers of flights each month (Red-line); the scale on the left-hand side (100 per scale) shows frequencies of FDM events (Blue-line) and ASRs (Green-line) across 24 months of data.
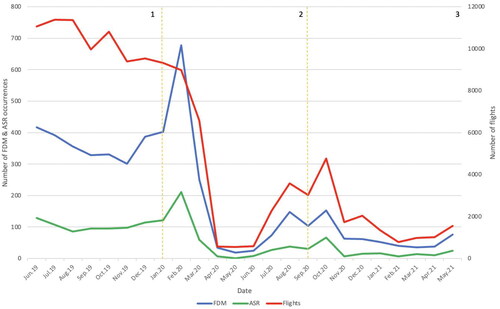
Table 4. Cross tabulation on the frequencies, adjusted standardised residuals, and (percentages) of pilots submitted ASRs on FDM events across three stages of the pandemic.
3.2. Testing associations between three stages of pandemic and five FDM categories
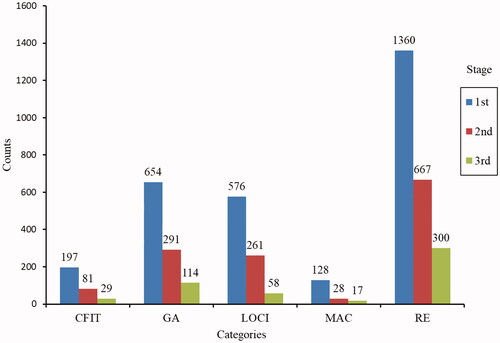
There is a significant association between the three pandemic stages and five FDM categories, χ 2 (8, N = 1225) = 19.058, p = .015. Therefore, the first hypothesis ‘H1: There is a significant association between three stages of pandemic and five categories on FDM exceedances’ is accepted. demonstrates the number of events (4761), frequencies, and percentage on five FDM categories among three stages of pandemic across a total of 123,140 flight operations. Analyses on standardised Pearson residuals reveal that numbers of LOCI events were significantly smaller than expected at stage 3. In contrast, the numbers of RE events were smaller than expected at stage 1 but larger than expected at stage 3. The bar chart on shows the values of FDM events on the three stages of pandemic, which could be interpreted as the number of events. The result demonstrated that there are significant associations between the FDM categories and the three stages of the pandemic.
Figure 2. The significance association between the three stages of the pandemic and the five categories on FDM exceedances for 24 months are illustrated using a bar chart. The values (on the top of each bar) of FDM exceedances on five FDM categories among three stages of pandemic represented the number of events based on chi-square analysis.
3.3. Testing associations between the three stages of the pandemic and seven flight phases
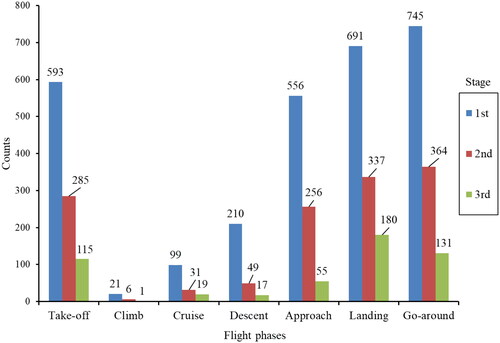
There is a significant association between the three pandemic stages and seven flight phases on FDM exceedances, χ 2 (12, N = 1225) = 31.272, p = .002. Therefore, the second hypothesis ‘H2: There is a significant association between the three stages of pandemic and seven flight phases on FDM exceedances’ is accepted. shows the original events, frequencies, and percentage of FDM exceedances on seven flight phases among the three stages of the pandemic. Analyses on standardised Pearson residuals reveal that numbers of descents were significantly larger than expected at stage 1. In contrast, the numbers of approaches were larger than expected at stage 2 but smaller than expected at stage 3. Moreover, the numbers of landings were smaller than expected at stage 1 but larger than expected at stage 3. The bar chart in indicates the values of FDM events on the three stages of the pandemic, which could be interpreted as the number of events based on chi-square tests. The result demonstrates that there are significant FDM exceedance associations between seven flight phases and three stages of pandemic.
Figure 3. The significance association between the three stages of the pandemic and seven flight phases on FDM exceedances for 24 months shown as bar chart. The values (on the top of each bar) of FDM exceedances on the seven flight phases among three stages of pandemic represent the number of events based on chi-square analysis.
3.4. Testing associations between three stages of pandemic and five fleets
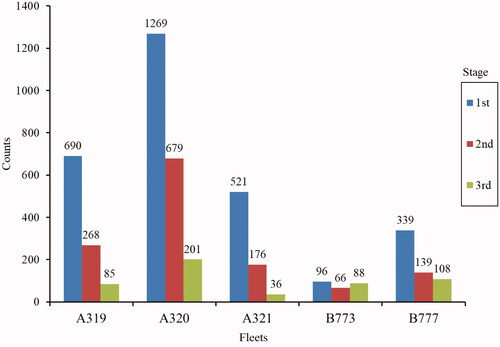
There is a significant association between the three pandemic stages and five fleets on FDM exceedances, χ 2 (8, N = 1225) = 99.374, p < .001. Therefore, the third hypothesis ‘H3: There is a significant association between the three stages of the pandemic and five fleets on FDM exceedances’ is accepted. demonstrates the original number of events, frequencies and percentage of FDM exceedances on five fleets among the three stages of the pandemic. Analyses on standardised Pearson residuals reveal that the numbers of A319 flights were significantly smaller than expected at stage 3. In contrast, the numbers of A320 flights were larger than expected at stage 2 but smaller than expected at stage 3. Moreover, the numbers of A321 flights were larger than expected at stage 1 but smaller than expected at stage 3. The numbers of B773 flights were smaller than expected at stage 1 and stage 2 but larger than expected at stage 3. Similarly, the numbers of B777 flights were smaller than expected at stage 1 and stage 2 but larger than expected at stage 3. The bar chart () illustrates the values of FDM events on the three stages of the pandemic, which could be interpreted as the number of events based on chi-square tests. The result demonstrates that there are significant associations on FDM exceedances between five fleets and the three stages of the pandemic.
Figure 4. The significance association between the three stages of the pandemic and five fleets on FDM exceedances for 24 months are shown as bar chart. The values (on the top of each bar) of FDM exceedances on the five fleets among three stages of pandemic represented the number of events based on chi-square analysis.
3.5. Testing associations between three stages of pandemic and pilots submitted ASRs
There is no significant association between the three pandemic stages and pilots’ ASRs submissions based on FDM event categories, χ 2 (2, N = 1225) = 0.427, p = 0.808. Therefore, the fourth hypothesis ‘H4: There is a significant association between the three stages of the pandemic and pilots submitted ASRs on FDM exceedances’ is rejected. illustrates the percentage and frequencies of each FDM event in different stages of the pandemic as a bar chart in . The result demonstrated that there are no significant associations between pilots submitted ASRs and the three stages of the pandemic.
4. Discussion
The substantial drop in flight numbers combined with new SOPs related to the COVID-19 spread in early 2020 had increased operational risks in aviation (EASA Citation2021; Olaganathan and Amihan Citation2021). There are statistically significant associations between the stages of pandemic and FDM categories, flight phases and fleets (), but no significant association with ASRs (). The results thus validate the hypotheses that the pandemic had an influence on the frequency changes of the FDM categories, flight phases and fleets. However, the hypothesis that there was a significant change in number of ASRs submitted was disproved. Pilots were impacted by many additional health and safety requirements, some doing a substantially different job, and some not being able to fly under furlough schemes which may associate with deteriorating proficiency on both psychomotor handling skills and complicated SOPs in the flight deck.
4.1. FDM exceedances related to runway excursion increased while flight numbers decreased
The results demonstrate a significant increase in FDM exceedances related to the runways excursion category during the pandemic ( and ). The disruption of COVID-19 creates an issue for airlines on determining the appropriate recurrent training schedules for flight crews, as the significant traffic decrease, and congested simulator sessions have induced regulators’ safety concerns for pilots’ skill and knowledge retention (EASA Citation2021; Hendrickson, Goldsmith, and Johnson Citation2006). Results show that the pandemic had implications across the five FDM categories and influenced pilots’ operational performance related to runway excursion, go-arounds, mid-air collisions, controlled flight into terrain and loss of control in-flight. The required critical skills and core competencies for pilots defined by International Air Transport Association (Citation2013) can fade due to inactivity, lack of individual effort or simply through lack of exposure to certain scenarios within the operation (Casner et al. Citation2014). The COVID-19 pandemic has had an immense impact on pilot skill fade due to fleet and flying hour reductions, furloughs and redundancies (EASA Citation2021). Pilots may find it harder to remember procedures and carry out some tasks, carry tasks out in the wrong sequence (incorrect cockpit flow), forget parts of tasks and processes, or fail to realise that they have carried out a task not following procedures (CAA Citation2021). The pandemic caught airlines and flight crew by surprise. Airlines were forced to shift towards increased cost-efficiency, and it can be argued that flight crews could not maintain their level of thoroughness due to lack of recency since the beginning of the pandemic. There are contributing factors related to LOC-I accidents/incidents including disorientation, distraction, startled responses, lack of aircraft handling skills, and inadequate risk management (Federal Aviation Administration Citation2019). The lack of aircraft handling skills is associated with pilot proficiency, which requires recent performance and practice to be familiar with the SOPs and cognitive information processing. The highest mortality is related to loss of control inflight due to lack of piloting skills and is mainly associated with a reduced pilot’s proficiency (Hanusch Citation2017).
The results show a significant increase in events during the landing flight phase ( and ). The landing flight phase requires the highest cognitive and psychomotor skills involving in terms of manual flying skill, anticipation, applying suitable SOPs, and decision-making (Arthur et al. Citation1998; Ebbatson et al. Citation2010). Therefore, the landing stage is most prone to a skill decay which is associated with runway excursions due to a lack of practice effect. The actual significant increase in event frequency during landing can therefore be an indicator for skill fade (Sikora, Hari, and Hanusch Citation2020). The approach and landing flight phases are among those which require most cognitive skills from pilots, especially with regards to anticipating events, communication, and use of SOPs, and checklists. These behaviours typically fall into rule-based knowledge or sometimes even knowledge-based behaviours in the case of less common approaches (Rasmussen Citation1983). Therefore, these flight phases are expected to be most impacted by decay and pilots may find it harder to regain their proficiency levels following a skill fade. Furthermore, runway excursion events typically feature exceedances linked to long flares and unstable approaches (Haslbeck and Hoermann Citation2016). The significant increase in RE events during the pandemic compared to before pandemic also highlights a loss of proficiency due to significantly fewer flight operations in 2020. Although the total flight numbers significantly had dropped from 82,819 (1st stage) to 26,128 (2nd stage), the occurrences of runway excursion increased from 164 to 255 based on the FDM Programme ( and ). Runway excursions represent the highest percentage of FDM exceedances. There are confounding contributory factors to RE, such as poor visibility, wind velocity/crosswind, and runway contaminated by water, ice, or snow. Reason (Citation2016) has proposed that there is a ‘many to one’ mapping between the precursors of operators’ unsafe acts and the actual error involved in an incident/accident. This phenomenon creates a complicated scenario to determine the potential risks on FDM exceedances which are involved in varieties of parameters recorded and preconditions of unsafe acts either in the operational environment or in the flight deck (W.-C. Li, Harris, and Yu Citation2008). It is also evident that FDM events rarely occur due to a single triggered factor, such as the operational environments, flight phases and fleets.
4.2. Go-around as most vulnerable phase to the pandemic’s impact
The FDM data demonstrates the ‘close to ground’ effect in terms of Area of Vulnerability (AOV), which includes take-off (22.20%), go-around (25.29%) and landing (34.75%) below 1500 feet which were associated with the majority of exceedances (75.3%) ( and ). Flight phases close to the ground are associated with severe consequences and limited time is available to detect and correct the deviations, for instance during a landing with a gusty crosswind component. It is notable that the highest frequency of FDM events in terms of flight phases is associated with the second stage (41.48%) – compared with the first (28.73%) and the third stages (29.79%) of the pandemic. Equally, the significant increase in the FDM events associated with landing and go-arounds took place on the second stage of pandemic. It has significantly increased from 90 to 139 occurrences on 10,000 flight ( and ). Flight crews should ensure that visual cross-checking tasks are accomplished by the pilot-monitoring (PM) while consciously observing cockpit instruments and effectively communicating with the pilot-flying (PF) to perform a high sampling rate scan of the cockpit environment. Adequate visual cross-checking by the PM is critical on assisting the PF managing the aircraft’s flight path and energy state (Dehais et al. Citation2017). A deviation which would remain unnoticed by both the PF and the PM could eventually trigger an FDM exceedance event, e.g., an unstable flight path which in this case would be labelled as an RE event. Staying ahead of the aircraft also involves adequate monitoring by both PF and PM (Sumwalt, Cross, and Lessard Citation2015). However, monitoring and cross-checking abilities are affected in case of prolonged time without using them (Casner et al. Citation2014) which is related to pilots’ lack of practice effects due to the pandemic in reducing flights by 70%. It is thus recommended that both PF, and PM ensure adequate attentional resources for task management during ‘close to ground’ flight phases, while the time-critical tasks need to be performed in-time. Finally, it is recommended that airlines and flight crews do not complicate their SOPs as introducing new SOPs for flight crews can create additional workload and thus risks, which are exacerbated in cases associated with lack of recency (EASA Citation2021).
4.3. The A320 is associated with the highest occurrences among all fleets across the three stages
The FDM data can be split between fleets, which can aid in the identification of operational risks on different types of aircraft and increasing cost efficiency on maintenance. Quality assurance and maintenance departments may make use of FDM to enhance safety and efficiency while managing the long-haul (B777 and B773) and short-haul fleets (A319, A320 and A321). The A320 has the highest percentage of FDM exceedances (45.28%) compared with the other two short-haul fleets, A319 (20.06%) and A321 (12.70%), and long-haul fleets, B777 (13.89%) and B773 (8.07%) across three stages of pandemic ( and ). A significant increase of FDM events which were associated with a high pitch attitude on take-off, TCAS resolution advisory, excessive vertical speed in the climb, and over rotation during go-around at the second stage of the pandemic has been observed on the A320. This FDM information can be valuable to Threat and Error Management (TEM) when developing the fleet safety management strategy. Furthermore, new risks have been identified on aircraft which had just been removed from storage (EASA Citation2021). In addition, pilots who operate mixed-fleet flying (A319, A320 and A321) should pay extra vigilance, focussing on SOPs due to differences in aircraft weights and procedures which could remain unnoticed (EASA Citation2021). The short-haul sector was hit the hardest at the early pandemic stage (2nd stage) due to a large reduction of flights, which caused a significant increase in FDM events. However, it was able to return to a pre-pandemic level at the third stage; while the long-haul sector, although less impacted at the beginning of the pandemic (2nd stage), shows an increase in FDM occurrences at the third stage (). This can be explained by the drop of short-haul flights at the beginning of the pandemic, which led to a lack of recency for pilots. The long-haul sector was able to maintain a certain level of operations due to the demand for cargo. The increase in FDM occurrences at the later stage may be due to both insidious effects and mental workloads incurred by the impacts of the pandemic, which led to disrupted operations (short layovers, leading to crew fatigue for instance), and which were not immediately visible but latent (Reason Citation1990).
4.4. Limitations
The objective of ASRs is to improve aviation safety by ensuring that relevant safety information related to flight operations is reported, collected, disseminated, and analysed (Leva et al. Citation2010). According to the airline’s procedures, pilots are only required to submit an ASRs in cases of a go-around. For all other occurrences it remains a pilot decision if an ASRs should be submitted or not. Although the number of precursor events for runway excursions increased, it did not lead to an increased number of ASRs among the three stages. This can be due to the fact that either pilots did not know that an FDM event was triggered during their flight, or that they did not consider it was relevant to submit one. It is interesting to note that 53.4% of MAC events are followed by an ASR, while it is the case for only 4.3% of RE events. Previous studies identified risk perception to be a key factor in influencing pilot’s decision (Drinkwater and Molesworth Citation2010) and internal threats are considered less threatening than external ones (Orasanu, Fischer, and Davison Citation2002). Some limitations occurred during our current research. Firstly, this research does not examine the effects of weather (storms, icing, etc.), although these can influence the recorded FDM exceedances, especially in relation to go-arounds and runway excursions. Secondly, the data is limited to only 24 months. Thirdly, we were not able to analyse FDM events aligned with crew’s retrospective reports due to text ASRs not being added to the dataset. An FDM event is only represented by its recorded data (i.e., “raw” values). Without ASR or crew interviews, it may not always be possible to understand the crew’s action behind an occurrence or identify who was pilot flying and who was pilot monitoring. Fourthly, each recorded parameter was applied using a specific threshold and algorithm on different types of aircraft, which is a complicated process to work with on the data analysis. Finally, this study only focuses on FDM event frequencies and probability, the severity index may have to be investigated on a future study.
5. Conclusion
A FDM Programme enables analysts to predict the probability of occurrence for specific events during a specific flight phase and fleet. The finding of proactive FDM data analysis can be used for developing an effective SMS to improve aviation safety. There is a significant association between the impacts of the pandemic and the increased frequency of FDM events, especially related to pilot proficiency based on this research. Therefore, manual flying skill decay, lack of practice effects of SOPs, and knowledge on flight deck automation should be considered for airlines’ preparations to return to normal operations. Specific training sessions are already in place to address potential risks, although differences appear to exist between short-haul pilots and long-haul pilots, as the reduction of traffic in Europe from March 2020 has had an immediate effect on short-haul pilots with a sharp reduction of the number of flights which is considered to have an effect on pilots’ proficiency. The effects of routine decay on long-haul pilots have been more latent, as cargo flights increased during the pandemic. Currently, FDM is a part of every major airline’s safety and reporting culture, which are non-punitive with protected data sources. There is a constant feedback process among individual crewmembers, the flight safety department, pilot unions, and the airline management. Crew’s trust in an airline safety management system and FDM Programme is paramount in ensuring its effectiveness and contribution to aviation safety. On the preparation for return to normal operations, tailored training sessions based on FDM have to be integrated with SMS to mitigate the impacts of the pandemic.
Acknowledgements
The authors would like to express special thanks to Captain Ben Whitworth and Simon Oakes for their contribution to this research. Their support and the enthusiasm of their respective teams was invaluable in facilitating the authors’ research efforts.
Disclosure statement
The authors declared that they have no commercial or associative interest that represents a conflict of interest in connection with the work submitted to Ergonomics.
Data availability statement
Due to the privacy restrictions as well as a legally binding confidentiality agreement with the data provider, it is not possible for their data to be shared publicly, so supporting data is not available.
Additional information
Funding
References
- Agresti, A. 2002. Categorical Data Analysis. 2nd ed. New York: John Wiley & Sons, Inc.
- Ammons, R.B., R.G. Farr, E. Bloch, E. Neumann, M. Dey, R. Marion, and C.H. Ammons. 1958. “Long-Term Retention of Perceptual-Motor Skills.” Journal of Experimental Psychology 55 (4): 318–328. doi:10.1037/h0041893.
- Arthur, W., Jr, W. Bennett, Jr, P.L. Stanush, and T.L. McNelly. 1998. “Factors That Influence Skill Decay and Retention: A Quantitative Review and Analysis.” Human Performance 11 (1): 57–101. doi:10.1207/s15327043hup1101_3.
- Barry, D.J. 2021. “Estimating Runway Veer-off Risk Using a Bayesian Network with Flight Data.” Transportation Research Part C: Emerging Technologies 128: 103180. doi:10.1016/j.trc.2021.103180.
- Bromfield, M.A., and S.J. Landry. 2019. “Loss of Control in Flight – Time to Re-Define?” Aiaa Aviation 2019 Forum: American Institute of Aeronautics and Astronautics. doi:10.2514/6.2019-3612.
- CAA. 2021. “Safety Notice, Awareness of Skill Fade and Suggested Mitigations.” https://publicapps.caa.co.uk/docs/33/SafetyNotice2021011.pdf
- Casner, S.M., R.W. Geven, M.P. Recker, and J.W. Schooler. 2014. “The Retention of Manual Flying Skills in the Automated Cockpit.” Human Factors 56 (8): 1506–1516. doi:10.1177/0018720814535628.
- Chaves, F. 2020. “Airline Safety Management System Issues: A Practitioner’s Perspective.” Aircraft Engineering and Aerospace Technology 92 (2): 117–127. doi:10.1108/AEAT-11-2018-0280.
- Christidis, P., and A. Christodoulou. 2020. “The Predictive Capacity of Air Travel Patterns during the Global Spread of the Covid-19 Pandemic: Risk, Uncertainty and Randomness.” International Journal of Environmental Research and Public Health 17 (10): 3356. doi:10.3390/ijerph17103356.
- de Courville, B. 2019. “Breaking Airlines Flight Data Monitoring Barriers: A Pilot’s Perspective.” Paper Presented at the 72nd Annual International Air Safety Summit, Taipei, Taiwan.
- Dehais, F., J. Behrend, V. Peysakhovich, M. Causse, and C.D. Wickens. 2017. “Pilot Flying and Pilot Monitoring’s Aircraft State Awareness during Go-around Execution in Aviation: A Behavioral and Eye Tracking Study.” The International Journal of Aerospace Psychology 27 (1–2): 15–28. doi:10.1080/10508414.2017.1366269.
- Dekker, S., P. Cilliers, and J.-H. Hofmeyr. 2011. “The Complexity of Failure: Implications of Complexity Theory for Safety Investigations.” Safety Science 49 (6): 939–945. doi:10.1016/j.ssci.2011.01.008.
- Drinkwater, J.L., and B.R.C. Molesworth. 2010. “Pilot See, Pilot Do: Examining the Predictors of Pilots’ Risk Management Behaviour.” Safety Science 48 (10): 1445–1451. doi:10.1016/j.ssci.2010.07.001.
- EASA. 2016. “Developing Standardised FDM-Based Indicators.” https://www.easa.europa.eu/sites/default/files/dfu/EAFDM__standardised_FDM-based_indicators_v2_Ed2017.pdf
- EASA. 2019. “Guidances for the Implementation of FDM-Precursors.” https://www.easa.europa.eu/eofdm-wgb-guidance-implementation-fdm-precursors-revision-3
- EASA. 2020. “Safety Issue Report-Skills and Knowledge Degradation Due to Lack of Recent Practice.” https://ifairworthy.com/safety-issue-report-skills-and-knowledge-degradation-due-to-lack-of-recent-practice/
- EASA. 2021. Review of Aviation Safety Issues Arising from the Covid-19 Pandemic.” https://www.easa.europa.eu/downloads/127172/en
- Ebbatson, M., D. Harris, J. Huddlestone, and R. Sears. 2010. “The Relationship between Manual Handling Performance and Recent Flying Experience in Air Transport Pilots.” Ergonomics 53 (2): 268–277. doi:10.1080/00140130903342349.
- Elliott, A., and W. Woodward. 2007. “Statistical Analysis Quick Reference Guidebook.” https://methods.sagepub.com/book/statistical-analysis-quick-reference-guidebook doi:10.4135/9781412985949.
- Federal Aviation Administration. 2019. “Safety Culture.” https://www.faa.gov/news/safety_briefing/2019/media/JulAug2019.pdf
- Fernández, A., D. Martínez, P. Hernández, S. Cristóbal, F. Schwaiger, J. María Nuñez, and J.M. Ruiz. 2019. “Flight Data Monitoring (FDM) Unknown Hazards Detection During Approach Phase Using Clustering Techniques and Autoencoders.” https://www.sesarju.eu/sites/default/files/documents/sid/2019/papers/SIDs_2019_paper_71.pdf
- Flight Safety International. 2014. “A Practical Guide for Improving Flight Path Monitoring.” https://flightsafety.org/files/flightpath/EPMG.pdf
- Haberman, S.J. 1973. “The Analysis of Residuals in Cross-Classified Tables.” Biometrics 29 (1): 205. doi:10.2307/2529686.
- Hanusch, M. 2017. “Manual Flying Skills – Airline Procedures and Their Effect on Pilot Proficiency.” MSc Air Safety Management, City University of London.
- Harris, D., and N.A. Stanton. 2010. “Aviation as a System of Systems: Preface to the Special Issue of Human Factors in Aviation.” Ergonomics 53 (2): 145–148. doi:10.1080/00140130903521587.
- Haslbeck, A., and H.-J. Hoermann. 2016. “Flying the Needles: Flight Deck Automation Erodes Fine-Motor Flying Skills among Airline Pilots.” Human Factors 58 (4): 533–545. doi:10.1177/0018720816640394.
- Haslbeck, A., H.-J. Hoermann, and P. Gontar. 2018. “Stirring the Pot: Comparing Stick Input Patterns and Flight-Path Control Strategies in Airline Pilots.” The International Journal of Aerospace Psychology 28 (1–2): 15–30. doi:10.1080/24721840.2018.1481343.
- Haslbeck, A., P. Kirchner, E. Schubert, and K. Bengler. 2014. “A Flight Simulator Study to Evaluate Manual Flying Skills of Airline Pilots.” Proceedings of the Human Factors and Ergonomics Society Annual Meeting 58 (1): 11–15. doi:10.1177/1541931214581003.
- Hendrickson, S.M.L., T.E. Goldsmith, and P.J. Johnson. 2006. “Retention of Airline Pilots’ Knowledge and Skill.” Proceedings of the Human Factors and Ergonomics Society Annual Meeting 50 (17): 1973–1976. doi:10.1177/154193120605001755.
- Hollnagel, E. 2017. Safety–I and Safety–II: The Past and Future of Safety Management. Boca Raton, FL: Routledge. doi:10.1201/9781315607511.
- Holtom, M. 2007. “FOQA – Flight Data Analysis of Aircraft for Flight Safety.” https://www.theairlinepilots.com/forumarchive/flightsafety/foqaflightdataanalysis.php
- IBM Corp. 2021. IBM SPSS Statistics for Windows (Version 28.0). Armonk, NY: IBM Corp.
- International Air Transport Association. 2013. Evidence-Based Training Implementation Guide. 1st ed. https://pdf4pro.com/view/evidence-based-training-implementation-guide-iata-5b2a29.html
- International Air Transport Association. 2020. Guidance for Flight Operations During and Post Pandemic. 3rd ed. https://www.iata.org/en/programs/covid-19-resources-guidelines/
- International Air Transport Association. 2021. “Safety Report 2020.” https://www.iata.org/en/publications/safety-report/
- Jarry, G., D. Delahaye, and E. Feron. 2021. “Flight Safety during Covid-19: A Study of Charles de Gaulle Airport Atypical Energy Approaches.” Transportation Research Interdisciplinary Perspectives 9: 100327. doi:10.1016/j.trip.2021.100327.
- Lager, E., and M. Melin. 2022. “Proactive Flight Safety – A Feasibility Study on Optimal Use of Flight Data Monitoring and Incident Reports in an Airline.” International Journal of Occupational Safety and Ergonomics : JOSE 28 (2): 1311–1315. doi:10.1080/10803548.2021.1899608.
- Leva, M.C., J. Cahill, A.M. Kay, G. Losa, and N. McDonald. 2010. “The Advancement of a New Human Factors Report – ‘The Unique Report’ – Facilitating Flight Crew Auditing of Performance/Operations as Part of an Airline’s Safety Management System.” Ergonomics 53 (2): 164–183. doi:10.1080/00140130903437131.
- Li, L., R.J. Hansman, R. Palacios, and R. Welsch. 2016. “Anomaly Detection via a Gaussian Mixture Model for Flight Operation and Safety Monitoring.” Transportation Research Part C: Emerging Technologies 64: 45–57. doi:10.1016/j.trc.2016.01.007.
- Li, W.-C., G. Braithwaite, T. Wang, M. Yung, and P. Kearney. 2020. “The Benefits of Integrated Eye Tracking with Airborne Image Recorders in the Flight Deck: A Rejected Landing Case Study.” International Journal of Industrial Ergonomics 78: 102982. doi:10.1016/j.ergon.2020.102982.
- Li, W.-C., D. Harris, and C.-S. Yu. 2008. “Routes to Failure: Analysis of 41 Civil Aviation Accidents from the Republic of china Using the Human Factors Analysis and Classification System.” Accident; Analysis and Prevention 40 (2): 426–434. doi:10.1016/j.aap.2007.07.011.
- Lyall, B., and C.D. Wickens. 2005. “Mixed Fleet Flying between Two Commercial Aircraft Types: An Empirical Evaluation of the Role of Negative Transfer.” Paper Presented at the Human Factors and Ergonomics Society Annual Meeting, Orlando, Florida.
- Maille, N. 2015. “On the Use of Flight Operating Procedures for the Analysis of FOQA Data.” Paper Presented at the 6th European Conference for Aeronautics and Space Sciences (EUCASS), Krakow, Poland.
- Matthews, B., S. Das, K. Bhaduri, K. Das, R. Martin, and N. Oza. 2014. “Discovering Anomalous Aviation Safety Events Using Scalable Data Mining Algorithms.” Journal of Aerospace Information Systems 11 (7): 482–482. doi:10.2514/1.I010211.
- Miller, C.J. 2020. “Six Months into the Pandemic, It’s Even Worse for Airlines than We Thought – The Air Current.” https://theaircurrent.com/analysis/six-months-into-the-pandemic-its-even-worse-for-airlines-than-we-thought/
- O'Leary, M. 2002. “The British Airways Human Factors Reporting Programme.” Reliability Engineering & System Safety 75 (2): 245–255. (01)00098-9. doi:10.1016/S0951-8320.
- Oehling, J., and D.J. Barry. 2019. “Using Machine Learning Methods in Airline Flight Data Monitoring to Generate New Operational Safety Knowledge from Existing Data.” Safety Science 114: 89–104. doi:10.1016/j.ssci.2018.12.018.
- Olaganathan, R., and R.A.H. Amihan. 2021. “Impact of Covid-19 on Pilot Proficiency – A Risk Analysis.” Global Journal of Engineering and Technology Advances 6 (3): 001–013. doi:10.30574/gjeta.2021.6.3.0023.
- Orasanu, J., U. Fischer, and J. Davison. 2002. “Risk Perception: A Critical Element of Aviation Safety.” IFAC Proceedings Volumes 35 (1): 49–58. doi:10.3182/20020721-6-ES-1901.01639.
- Rasmussen, J. 1983. “Skills, Rules, and Knowledge; Signals, Signs, and Symbols, and Other Distinctions in Human Performance Models.” IEEE Transactions on Systems, Man, and Cybernetics SMC-13 (3): 257–266. doi:10.1109/TSMC.1983.6313160.
- Reason, J. 1990. Human Error. Cambridge: Cambridge University Press.
- Reason, J. 2016. Managing the Risks of Organizational Accidents. London: Routledge.
- Schultz, M., S. Lorenz, R. Schmitz, and L. Delgado. 2018. “Weather Impact on Airport Performance.” Aerospace 5 (4): 109. doi:10.3390/aerospace5040109.
- Sikora, I., B.L. Hari, and M. Hanusch. 2020. “Human Factors Approaches and Models in LOC-I Accident Analysis and Prevention: Flight Crew Resource Management Techniques as a Risk Mitigation Tool.” International Journal of Safety and Security Engineering 10 (3): 301–310. doi:10.18280/ijsse.100301.
- Smart, E., D. Brown, and J. Denman. 2012. “A Two-Phase Method of Detecting Abnormalities in Aircraft Flight Data and Ranking Their Impact on Individual Flights.” IEEE Transactions on Intelligent Transportation Systems 13 (3): 1253–1265. doi:10.1109/TITS.2012.2188391.
- Soo, K., T.J. Mavin, and W.-M. Roth. 2016. “Mixed-Fleet Flying in Commercial Aviation: A Joint Cognitive Systems Perspective.” Cognition, Technology & Work 18 (3): 449–463. doi:10.1007/s10111-016-0381-3.
- Stogsdill, M. 2022. “When Outcomes Are Not Enough: An Examination of Abductive and Deductive Logical Approaches to Risk Analysis in Aviation.” Risk Analysis 42 (8): 1806–1814. doi:10.1111/risa.13681.
- Sumwalt, R., D. Cross, and D. Lessard. 2015. “Examining How Breakdowns in Pilot Monitoring of the Aircraft Flight Path.” International Journal of Aviation, Aeronautics, and Aerospace 2 (3): 1063. doi:10.15394/ijaaa.2015.1063.
- Walker, G. 2017. “Redefining the Incidents to Learn from: Safety Science Insights Acquired on the Journey from Black Boxes to Flight Data Monitoring.” Safety Science 99: 14–22. doi:10.1016/j.ssci.2017.05.010.
- Wang, L., J. Zhang, C. Dong, H. Sun, and Y. Ren. 2019. “A Method of Applying Flight Data to Evaluate Landing Operation Performance.” Ergonomics 62 (2): 171–180. doi:10.1080/00140139.2018.1502806.
- Werfelman, L. 2021. “Unpracticed. Flight Safety Foundation.” https://flightsafety.org/asw-article/unpracticed/
