
 ?Mathematical formulae have been encoded as MathML and are displayed in this HTML version using MathJax in order to improve their display. Uncheck the box to turn MathJax off. This feature requires Javascript. Click on a formula to zoom.
Abstract
Seat pressure maps are often used to evaluate comfort of the users. In this study, we explored the relationships between pressure maps and comfort/discomfort of users in aircraft seats with a focus on a new 6-division method on the pressure maps collected at the bottom of the cushions. An experiment was designed where three cushions with identical shapes but different stiffnesses were prepared. 33 subjects joined the experiment and after sitting on each cushion in 4 postures, they completed comfort questionnaires. Pressure maps on the top as well as the bottom of cushions were collected and analysed. Results indicated that measures on the proposed 6 divisions, especially on the distal posterior thigh regions and regions close to ischial tuberosity of the bottom pressure maps, had larger correlation values to comfort scores compared to other division methods.
Practitioner summary: The relations between comfort/discomfort and seat pressure maps collected from the top/bottom of three cushions were studied with 33 subjects in four postures. The distal posterior thigh and ischial tuberosity regions in the proposed 6-division of the bottom pressure maps had larger correlation values to comfort/discomfort compared to other methods.
Introduction
During a flight, train ride or bus ride passengers spend most of their time sitting. Previous research indicated that the perceived sitting comfort and discomfort are of significant importance for passengers when choosing an airline (Hiemstra-van Mastrigt, Meyenborg, and Hoogenhout Citation2016), and a well-designed seat plays a vital role in enhancing comfort experience of passengers (Ahmadpour, Robert, and Lindgaard Citation2016).
While sitting, the human body is in direct contact with the seat (cushion) and the interface pressure profile between the body and the seat (cushion), which can be captured by a pressure sensing mat as a pressure map (XSensor Citation2022; Song and Vink Citation2021), has relations with the perceived discomfort (De Looze, Kuijt-Evers, and Van Dieën Citation2003). As the hip joints are often fixed during sitting and the weight is mainly sustained by the bony structure (Floyd and Roberts Citation1958), distribution of pressure values or pressure distribution in the pressure map is not uniform and a large pressure concentrated area can always be found in the region around the ischial tuberosity (Lay and Fisher Citation1940), followed by the proximal posterior thigh.
Pressure distributions of people sitting in car seats were studied often to improve comfort of drivers/passengers and reduce potential health risks (Hartung Citation2005; Zenk et al. Citation2012; Kilincsoy Citation2019). Though the backrest recline angle, the posture, and the armrest might influence the supporting forces of a person regarding different seat components while sitting, the seat cushion usually takes 55–95% of the weight (Shen et al. Citation1999). In the study of Ebe and Griffin (Citation2001), it was found that the ‘bottoming feeling’ and the ‘foam hardness feeling’ were two main factors influencing comfort of a seat, which were affirmed by other studies (Vos et al. Citation2006; Wegner et al. Citation2019). Zemp, Taylor, and Lorenzetti (Citation2015) showed that less discomfort and higher comfort are related to a lower mean pressure, a lower peak pressure, and a larger contact area(s) of the pressure map. Akgunduz, Rakheja, and Tarczay (Citation2014) also found correlations between perceived comfort and the peak and mean pressures on the seat pan.
To highlight the importance of different regions of the seat cushion regarding comfort/discomfort for possible improvements, researchers tried to divide the pressure map into different regions following different criteria. For instance, Kilincsoy (Citation2019) uniformly divided the bounding box of the contact area by a 3 × 2 grid following the fore-aft and lateral directions, respecitively. He found that in the back seat of an SUV, the ideal pressure distribution for comfort can be <55.8%, <20.0%, <9% reagrding the buttock, the proximal posterior thigh and the distal posterior thigh, respectively. Lantoine et al. (Citation2022) introduced the crotch point as a landmark to divide the bounding box into four regions and they found that the values of contact pressure in the left buttock region were significantly higher than other areas. listed the divisions that proposed in previous studies, their application contexts, and the main findings.
Table 1. Different divisions of the pressure distribution used in past studies.
Researchers paid extensive effort in using the pressure map measures to explain the perceived comfort/discomfort of users. However, many division methods are subjected to the shape of contact areas regarding different seats, e.g. only a few studies investigated the pressure distribution of aircraft seat regarding comfort (Dangal, Smulders, and Vink Citation2021); there is no consensus on the use of pressure map measures regarding the perceived comfort/discomfort; and the pressure mat, which uses different materials compared to the upholstery of the seat, is often positioned on the top of the cushion (Moon et al. Citation2020; Wegner et al. Citation2020). This limits the comparison of different comfort and discomfort evaluations and it is the question which is most valuable, especially for long-term evaluation.
In this study, we tried to explore the relationships between comfort/discomfort and measures in different regions of pressure maps captured on the top as well as the bottom of the cushion in the context of aircraft seats. The research questions were set as (1) Which division methods and pressure map measures are more suitable for evaluating comfort/discomfort experience of passengers and (2) Can the relationships between comfort/discomfort and the pressure map captured from the bottom of the cushion be established?
Methods
Postures
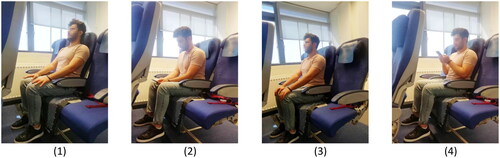
Passengers experience differences in comfort and discomfort in different postures in an aircraft seat. In the study conducted by Liu et al. (Liu, Yu, and Chu Citation2019), the different postures and the frequency of occurrences in aircraft cabins were summarised. Four postures were selected for this study (): (1) sit with two feet on the ground, hands on lap, both head and back against the backrest; (2) sit with two feet on the ground, back against the backrest, head down to look at the phones/books in hands on lap; (3) sit straight with feet on ground and hands on lap; and (4) sit with feet on the ground, back against the backrest, holding phones in front of the chest and look into the phones. These four postures account for 29.7%, 12.9%, 4.2% and 3.2% of the occurrences, respectively (Liu, Yu, and Chu Citation2019).
Figure 1. Four postures selected in this study.
Participants and protocols
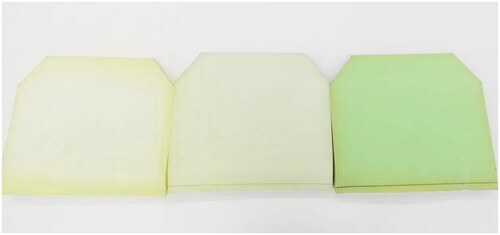
To collect the pressure maps on the top as well as at the bottom of the cushions with these 4 postures, 33 subjects, 18 males and 15 females ageing from 23 to 37 (BMI between 17.6 and 41.3), were invited to a within-subject experiment. Two rows of aircraft seats were used in this experiment to simulate the flying environment. In the 2nd row three self-designed NEVEON® cushions with the same shape but different stiffnesses were evaluated on an economy class seat frame (see ). The cushions were designed with a depth of 50 cm and a width of 44 cm (17.3 inch). The thicknesses of all cushions were 6 cm. To ensure the fit of the cushions and the frame of a 17-inch-wide seat, two triangular parts (8 and 10 cm for two sides adjacent to the right angle of the orthogonal triangle) were cut off from the upper edges (see ). All cushions are being used in aircraft seats and cushion A is the softest while cushion C is the hardest. Compression tests were done with Zwick Z010 on three points of each cushion and five times each point. The average displacements under 125 N on the compression platen (Φ 30 mm) are 48.6 mm, 38.1 mm and 31.6 mm. Subjects sat on each cushion for about 12 min. The pressure map of each posture was recorded on the top and at the bottom of the seat cushion using two XSensor LX210:48.48.02 pressure sensing mats (resolution: 48 × 48 cells, each 1.27 cm × 1.27 cm). The sequence of the cushions for each participant was altered using the Latin Square method. After experiencing a cushion, participants were asked to complete an overall comfort and discomfort questionnaire (Anjani et al. Citation2021).
Figure 2. Three cushions with different stiffnesses used in this study (A,B,C from left to right).
Data analysis methods
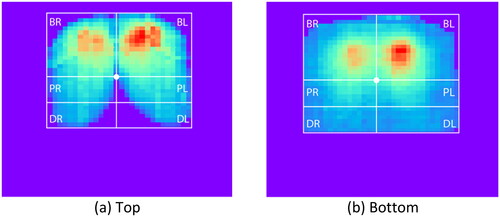
The comfort/discomfort scores of the questionnaires were normalised using the min-max scaling (Gopal, Patro, and Kumar Sahu Citation2015). To divide the pressure map to different regions, besides the six division methods (2A, 3A, 3B, 4A, 4B, 6A) summarised in , we proposed a new division (6B, as ) by combining the six-region division used by Kilincsoy (Citation2019) and the four-region division used by Lantoine et al. (Citation2022). Similar to the work of Lantoine et al. (Citation2022), the highest point on the edge of buttock between two thighs on the pressure map was used as the approximation of the crotch on the upper layer (round dots in ). The location of crotch on the lower pressure map was defined as the projection of the crotch point on the upper layer. In the bounding box of the contact area, we divided the pressure map to 4 regions using the crotch point. The two posterior thigh regions were further divided by a line in the middle to roughly outline the distal and proximal posterior thigh regions, as Kilincsoy (Citation2019) concluded that the distal posterior thigh might be more sensitive to the proximal side regarding the same pressure.
Figure 3. Proposed division (Method 6B) on the top as well as the bottom pressure map.
In , literature regarding pressure map measures and perceived sitting comfort/discomfort in different contexts is listed. Based on these studies, eight measures were selected for this study: mean pressure, peak pressure, contact area (CA), variance (VA), coefficient of variation (CV), force, load and seat pressure distribution percentage (SPD%). The mean pressure was the mean of all pressure values in the contact area, the peak pressure was calculated as the mean of the five largest pressure values in the contact area. Variance was calculated as the square of standard deviation of pressure values of the valid cells. Coefficient of Variation (CV) was the square root of the variance, i.e. the standard deviation, divided by the mean pressure. The total force applied on the pressure mat can be calculated as the sum of forces applied on all cells (pressure × area). Load is the ratio between force in each region and the total force. (Campos and Xi Citation2017), where
stands for the mean pressure,
stands for the pressure in each valid cell and
is the number of cells in the contact area.
Table 2. Pressure measures regarding sitting comfort.
For each subject regarding each cushion, eight pressure recordings (four postures × the upper and lower) were collected. Using the seven division methods (six in and the proposed new method in ), we computed eight measures of each region of the pressure map. According to Liu, Yu, and Chu (Citation2019), the occurrence of the four postures in a 2-h flight journey account for 29.7%, 12.9%, 4.2% and 3.2% of the total. These percentages were used as weights for the calculation. For each cell in the pressure map regarding four postures, the weighted average pressure value was computed as
Here
and
stands for the pressure values of each posture. For the scores of comfort discomfort questionnaires, Min–Max normalisation (Gopal, Patro, and Kumar Sahu Citation2015) has been processed with subjective data to show the changes in comfort and discomfort, as compared to use the absolute scores of subjective ratings on comfort/discomfort, using the relative changes of the comfort/discomfort might be less influenced by the background the expectations of subjects (Song and Vink Citation2021). Pearson correlation coefficients between measured values in different regions and normalised comfort/discomfort scores were calculated regarding all subjects and 3 cushions. Measures with the largest three correlations were highlighted regarding this region.
Results
In , the mean pressure and its standard deviation (SD) of each posture regarding each cushion are listed. In general, the mean pressure and its SD on the top layer were both larger than that of the bottom layer, whereas for the softest cushion (A), both were the smallest. With the hardest cushion (C), the largest mean pressure was observed both on the top and the bottom pressure maps.
Table 3. Mean pressure of each posture for each cushion at the top and the bottom (unit: N/cm2).
present measures with the 3 highest correlations to comfort/discomfort for each division method. The absolute values of correlations (AVC) under 0.1 are not included in these tables. The AVC ≥ 0.3 measures are highlighted. shows that more AVCs ≥ 0.3 were found in the thigh region than the buttock region using method 2A. Compared to discomfort, more AVCs between comfort and pressure parameters are over 0.3. Twelve AVCs are highlighted in (method 3A), where the pressure map was divided into right buttock region, left buttock region and thigh region. The highest correlation is 0.447, which was found in the left buttock region. More AVCs ≥ 0.3 were found between pressure and comfort both on upper layer and lower layer with division Method 3B (). For using method 4A (), results in the buttock regions are similar to that of using the division method 3A (). The division of the thigh regions suggested that the pressure measures of right thigh might be more correlated to comfort. Results of using the other 2 by 2 division method (4B) are shown in , in which the division is based on the crotch point. Compare to the uniform division methods, e.g. method 4A in , more correlations with AVC ≥ 0.3 were found. Both the buttock region and the thigh region on the right side show better performance than those of the left. The results of dividing the pressure map into 6 regions equally are shown in . Most of correlations over 0.3 are in the buttock regions and distal posterior thigh regions. Only 3 out of 22 of them are in proximal posterior thigh regions. The results of proposed 6-division method (Method 6B) are shown in . The correlations between pressure measures and (dis)comfort in buttock regions are the same with the results of division method 4B (). Compared to method 6A (), more correlations over 0.3 were found in proximal posterior thigh regions, mostly on the right side. In total, 24 correlations were highlighted with the proposed method. Among the 7 division methods, method 6B (), had the most measures that had AVCs ≥ 0.3, which were mostly centred on the bottom layer.
Table 4. Highest correlations (5 AVCs ≥ 0.3, in bold) in buttock and thigh regions (Method 2A) on different layers of three cushions.
Table 5. Highest correlations (12 AVCs ≥ 0.3, in bold) in buttock right, buttock left and thigh regions (Method 3A) on different layers of three cushions.
Table 6. Highest correlations (9 AVCs ≥ 0.3, in bold) in buttock, proximal posterior thigh and distal posterior regions (Method 3B) on different layers of three cushions.
Table 7. Highest correlations (17 AVCs ≥ 0.3, in bold) in buttock right, buttock left, thigh right and thigh left regions (Method 4A) on different layers of three cushions.
Table 8. Highest correlations (21 AVCs ≥ 0.3, in bold) in buttock right, buttock left, thigh right and thigh left regions (Method 4B) divided based on crotch location on different layers of three cushions.
Table 9. Highest correlations (21 AVCs ≥ 0.3, in bold) in buttock right, buttock left, proximal posterior thigh right, proximal posterior thigh left, distal posterior thigh right and distal posterior thigh left regions (Method 6A) on different layers of three cushions.
Table 10. Highest correlations (25 AVCs ≥ 0.3 , in bold) in buttock right, buttock left, proximal posterior thigh right, proximal posterior thigh left, distal posterior thigh right and distal posterior thigh left regions (6B) divided based on crotch location on different layers of three cushions.
Discussion
In this study, we tried to explore the relationships between the perceived comfort/discomfort and different measures in different divisions of the pressure maps, which were collected on the top as well as at the bottom of three different cushions. We synthesised 4 postures in comfort evaluation and calculating pressure map measures. And a new division method (6B) was proposed based on landmarks as well as the knowledge that the proximal and distal posterior thigh has different sensitivity regarding the same load (Kilincsoy Citation2019; Hirao, Naito, and Yamazaki Citation2022).
The proposed division method
Comparing method 4B and 6B, in which the only difference is whether the distal posterior thigh is separated, the number of measures with AVCs ≥ 0.3 in the thigh area and the distal posterior area are the same on the bottom layer. The high correlation values in the distal posterior thigh (Region 5, 6 in division 6A and 6B) also affirmed the findings. This is also in accordance with the work of Vink and Lips (Citation2017) who concluded the feeling in the distal posterior thigh of both legs are essential as the sensitivity of the lower thigh parts are significantly higher than other parts touching the seat pan, most probably due to that in this area the blood vessels and nerves are ‘unprotected’ and soft tissue can be easily deformed.
In this study, the highest value of correlation showed up in the left buttock area of 4B and 6B methods. This is in accordance with Kyung and Nussbaum(Citation2008). In their study, the pressure map of a driver seat cushion was divided using method 4A. The correlations between 39 pressure measures (including different regions on seat pan and backrest) of the driver seat cushion and whole-body comfort rating were calculated. The ratio between average regional pressure of left buttock and average total pressure had the largest correlations with comfort. Zhao et al.(Citation2020) also used the method 4A in their study and the highest correlation they achieved in their study is 0.307, which is between the peak pressure of left thigh region and the subjective ratings. Both works from Kyung and Nussbaum(Citation2008) and Zhao et al.(Citation2020) found the highest correlations in regions on the left. Similarly, more correlations with AVCs ≥0.3 were found on the left in this study with methods 4A, 4B, 6A and 6B. The consistency may indicate that maybe because of 90% of population are right hand dominant, humans tend to put more weight on the left part of the seat. This could explain more correlations with discomfort. Another research studied the correlations between global pressure measures and regional comfort (Fang, Gao, and Xie Citation2015), in which the driver seat pan pressure map was divided equally into three regions (3B). Values of the correlations varied from −0.426 to 0.253, which is comparable to our study.
Top and bottom pressure maps
Comparing the pressure map of the top to the bottom, the regions with high correlation values differ. The foam cushion dissipates the weight of the user towards the seat pan (Lam et al. Citation2018), resulting in a larger contact area, less mean pressure values and less noise at the bottom pressure map. The force applied by the distal posterior thigh is not large, therefore not prominent in the pressure map at the bottom. For instance, with the 6A division method, 7 AVCs ≥ 0.3 measures in the distal posterior thigh area were found on the top layer while only 3 AVCs ≥ 0.3 were found in the same area on the bottom layer. When the pressure map is divided uniformly, the performance on the bottom layer decreased as the number of regions grow. Dividing the pressure map base on the location of the crotch can solve this problem since the anatomy of human being can still be reflected on the map. For instance, using the 6B division, there are 2 AVCs ≥ 0.3 measures in the distal posterior thigh area, 3 in the proximal posterior thigh on the top map, for the bottom, the numbers are 6 and 4. Also, the measures of bottom pressure map had larger correlation values to comfort than discomfort. This finding indicates the potential of using pressure maps collected from the bottom of a cushion for long-term comfort studies, as in this spatial configuration, the materials of the pressure sensing mats will probably not influence the comfort experience of users as users will ‘feel’ the normal upholstery and the foam might allow moisture to pass through. Additionally, it might be that the bottom pressure mat had smaller peak pressure values and is less sensitive to unexpected damages.
Measures of the pressure maps
The largest correlation between pressure map measures and comfort/discomfort is the load with a value of 0.471, which show up in the left buttock area in 4B and 6B. The absolute value is comparable to the study of Fang, Gao, and Xie (Citation2015), in which 28 correlations with values between −0.426 to 0.253 were found between pressure parameters and comfort (overall and regional) in a driver seat. In general, CA (31 time > 0.3), Force (23 times > 0.3), and Mean (17 times > 0.3) are the most prominent measures. This is in accordance with findings of Naddeo, Califano, and Vink (Citation2018) and Li et al. (Citation2020). However, in study done by Zhao et al. (Citation2020), the highest correlation was found between the peak pressure of left thigh and overall discomfort. This could be an indication that using single pressure parameter for comfort and discomfort evaluation might not be sufficient. The fluctuating performance of individual measures regarding different stiffnesses of the cushions implies that synthesising multiple measures in predicting comfort/discomfort can be an important topic to study in future research.
Pressure measurement vs (dis)comfort
The pressure distribution is essential for studying both comfort and discomfort of the aircraft seats. Many AVCs ≥ 0.3 measures were found between the recordings and discomfort, which is accordance with the literature (Na et al. Citation2005; Kyung and Nussbaum Citation2008; Zhao et al. Citation2020). However, more AVCs ≥ 0.3 measures between the recordings and comfort, especially on the bottom layer, were found which is in accordance with the work of Vink and Hallbeck (Citation2012) that physical aspects are still an important construct of comfort. Moderate correlations were found between (dis)comfort and pressure parameters, which is in accordance with previous studies (Fang, Gao, and Xie Citation2015; Li et al. Citation2020; Zhao et al. Citation2020). These findings highlight the importance of pressure distribution in studying comfort. On the other side, comfort has a multifactorial construct (Mansfield et al. Citation2020) and objective measurements on other factors such as anthropometry, heart rate variability, electromyography and skin temperature can also reflect comfort of the subjects (Song & Vink, Citation2021). A proper integration of different measurements is recommended for a better understanding of sitting (dis)comfort.
Limitations
The population age of this study is between 23 and 37. Children, young persons and older adults were not included. Also, the sitting time was short and it is known that sitting longer increases discomfort (e.g. Smulders et al. Citation2016) and higher correlations over time might have been found. However, it is difficult to evaluate the long-term comfort of a cushion with a pressure mat on the top, which is also a support for using pressure mats under the cushion. The thickness of cushions used in this study were 6 cm. The results might change if cushions with different thickness and hardness are used. Also, the seat pan that was used was relatively flat, which was needed because of the bottom pressure mat. A pressure mat can also not be curved that much as it creates a pressure value just by bending the material, which we wanted to avoid. A curved seat pan might have different comfort experiences, but was not used, which might be a limitation as well. Besides, the study focussed on aircraft seats which limited the possibility of movement and made generalisation to other areas limited.
Conclusion
In this study, we explored the comfort/discomfort experience regarding different divisions and measures of pressure maps collected on both the top and bottom of three different cushions. Based on literature, a new division method based on the location of the crotch point to divide buttock, proximal and distal posterior thigh on both sides was explored. This six-region division of the pressure map gives more information, especially on the bottom layer which shows a potential for further use in comfort studies. Among all the regions, pressure measures under the distal posterior thigh area have strong relationships with comfort and discomfort, especially the relationship with comfort on the bottom layer. For the area around the ischial tuberosity, pressure maps collected under the cushion seem to give more information related to comfort/discomfort, which highlights the potential of using this spatial configuration for long-term comfort studies.
Ethics statement
The experiment setup and the protocol were approved by the Human Research Ethical Committee (HREC) of Delft University of Technology under file number 1228. Consent forms were signed by all subjects.
Disclosure statement
No potential conflict of interest was reported by the author(s).
Additional information
Funding
References
- Ahmadpour, N., J.M. Robert, and G. Lindgaard. 2016. “Aircraft Passenger Comfort Experience: Underlying Factors and Differentiation from Discomfort.” Applied Ergonomics 52: 301–308. doi:10.1016/j.apergo.2015.07.029.
- Akgunduz, A., S. Rakheja, and A. Tarczay. 2014. “Distributed Occupant-Seat Interactions as an Objective Measure of Seating Comfort.” International Journal of Vehicle Design 65 (4): 293–313. doi:10.1504/IJVD.2014.063829.
- Anjani, S., M. Kühne, A. Naddeo, S. Frohriep, N. Mansfield, Y. Song, and P. Vink. 2021. “PCQ: Preferred Comfort Questionnaires for Product Design.” Work 68 (s1): S19–S28. doi:10.3233/WOR-208002.
- Braun, A., S. Frank, and R. Wichert. 2015. “The Capacitive Chair.” In 3rd International Conference on Distributed, Ambient and Pervasive Interactions, Vol. 9189, 397–407. Los Angeles: Springer Verlag. doi:10.1007/978-3-319-20804-6_36.
- Campos, G.H., and F. Xi. 2017. “Pressure Sensing and Control of an Aircraft Passenger Seat Smart Reconfigurable Aircraft Cabin Design View Project Pressure Sensing and Control of an Aircraft Passenger Seat.” International Comfort Congress, Salerno.
- Dangal, S., M. Smulders, and P. Vink. 2021. “Implementing Spring-Foam Technology to Design a Lightweight and Comfortable Aircraft Seat-Pan.” Applied Ergonomics 91: 103174. doi:10.1016/j.apergo.2020.103174.
- De Looze, M.P., L.F.M. Kuijt-Evers, and J. Van Dieën. 2003. “Sitting Comfort and Discomfort and the Relationships with Objective Measures.” Ergonomics 46 (10): 985–997. doi:10.1080/0014013031000121977.
- Ebe, K., and M.J. Griffin. 2001. “Factors Affecting Static Seat Cushion Comfort.” Ergonomics 44 (10): 901–921. doi:10.1080/00140130110064685.
- Fang, R., J. Gao, and S. Xie. 2015. “Analysis of Pressure Distribution between Human and Seat for Evaluation of Automotive Seating Comfort.” In SAE-China Congress, Vol. 364, 383–395. Los Angeles: Springer Verlag. doi:10.1007/978-981-287-978-3_35/TABLES/4.
- Floyd, W.F., and D.F. Roberts. 1958. “Anatomical and Physiological Principles in Chair and Table Design.” Ergonomics 2 (1): 1–16. doi:10.1080/00140135808930397.
- García-Molina, P., S.R. Casasus, E. Sanchis-Sánchez, E. Balaguer-López, M. Ruescas-López, and J.M. Blasco. 2021. “Evaluation of Interface Pressure and Temperature Management in Five Wheelchair Seat Cushions and Their Effects on User Satisfaction.” Journal of Tissue Viability 30 (3): 402–409. doi:10.1016/J.JTV.2021.05.004.
- Gopal, S., K. Patro, and K. Kumar Sahu. 2015. “Normalization: A Preprocessing Stage.” IARJSET : 20–22. 10.48550/arxiv.1503.06462.
- Hartung, J. 2005. Objektivierung des statischen Sitzkomforts auf Fahrzeugsitzen durch die Kontaktkräfte zwischen Mensch und Sitz. Munich: Technischen Universität München eingereicht.
- Hiemstra-van Mastrigt, S., I. Meyenborg, and M. Hoogenhout. 2016. “The Influence of Activities and Duration on Comfort and Discomfort Development in Time of Aircraft Passengers.” Work 54 (4): 955–961. doi:10.3233/WOR-162349.
- Hirao, A., S. Naito, and N. Yamazaki. 2022. “Pressure Sensitivity of Buttock and Thigh as a Key Factor for Understanding of Sitting Comfort.” Applied Sciences 12 (15): 7363. doi:10.3390/app12157363.
- Kilincsoy, U. 2019. Digitalization of Posture-Based Seat Design: Developing Car Interiors by Involving User Demands and Activities. Delft: Delft University of Technology. doi:10.4233/uuid:419e4678-cb27-4c03-9725-7fb5b0fd3a12.
- Kyung, G., and M.A. Nussbaum. 2008. “Driver Sitting Comfort and Discomfort (Part II): Relationships with and Prediction from Interface Pressure.” International Journal of Industrial Ergonomics 38 (5–6): 526–538. doi:10.1016/j.ergon.2007.08.011.
- Lam, C., J.S.H. Kwan, Y. Su, C.E. Choi, and C.W.W. Ng. 2018. “Performance of Ethylene-Vinyl Acetate Foam as Cushioning Material for Rigid Debris-Resisting Barriers.” Landslides 15 (9): 1779–1786. doi:10.1007/s10346-018-0987-z.
- Lantoine, Pascaline, Mathieu Lecocq, Clément Bougard, Erick Dousset, Tanguy Marqueste, Christophe Bourdin, Jean-Marc Allègre, Laurent Bauvineau, and Serge Mesure. 2022. “Influence of Car Seat Firmness on Seat Pressure Profiles and Perceived Discomfort during Prolonged Simulated Driving.” Applied Ergonomics 100: 103666. doi:10.1016/J.APERGO.2021.103666.
- Lay, W.E., and L.C. Fisher. 1940. “Riding Comfort and Cushions.” In SAE Technical Papers. Warrendale, PA: SAE International. doi:10.4271/400171.
- Li, W., R. Mo, S. Yu, J. Chu, Y. Hu, and L. Wang. 2020. “The Effects of the Seat Cushion Contour and the Sitting Posture on Surface Pressure Distribution and Comfort during Seated Work.” International Journal of Occupational Medicine and Environmental Health 33 (5): 675–689. doi:10.13075/ijomeh.1896.01582.
- Li, W., S. Yu, H. Yang, H. Pei, and C. Zhao. 2017. “Effects of Long-Duration Sitting with Limited Space on Discomfort, Body Flexibility, and Surface Pressure.” International Journal of Industrial Ergonomics 58: 12–24. doi:10.1016/j.ergon.2017.01.002.
- Liu, J., S. Yu, and J. Chu. 2019. “The Passengers’ Comfort Improvement by Sitting Activity and Posture Analysis in Civil Aircraft Cabin.” Mathematical Problems in Engineering 2019: 1–10. doi:10.1155/2019/3278215.
- Mansfield, N., A. Naddeo, S. Frohriep, and P. Vink. 2020. “Integrating and Applying Models of Comfort.” Applied Ergonomics 82 (2019): 102917. doi:10.1016/j.apergo.2019.102917.
- Moon, J., T.K. Sinha, S.B. Kwak, J.U. Ha, and J.S. Oh. 2020. “Study on Seating Comfort of Polyurethane Multilayer Seat Cushions.” International Journal of Automotive Technology 21 (5): 1089–1095. doi:10.1007/s12239-020-0102-z.
- Na, S., S. Lim, H.-S.S. Choi, and M.K. Chung. 2005. “Evaluation of Driver’s Discomfort and Postural Change Using Dynamic Body Pressure Distribution.” International Journal of Industrial Ergonomics 35 (12): 1085–1096. doi:10.1016/j.ergon.2005.03.004.
- Naddeo, A., R. Califano, and P. Vink. 2018. “The Effect of Posture, Pressure and Load Distribution on (Dis)Comfort Perceived by Students Seated on School Chairs.” International Journal on Interactive Design and Manufacturing (IJIDeM) 12 (4): 1179–1188.
- Noro, K., T. Naruse, R. Lueder, N. Nao-I, and M. Kozawa. 2012. “Application of Zen Sitting Principles to Microscopic Surgery Seating.” Applied Ergonomics 43 (2): 308–319. doi:10.1016/j.apergo.2011.06.006.
- Shen, W., C. Parenteau, R. Roychoudhury, and J. Robbins. 1999. “Seated Weight Distribution of Adults and Children in Normal and Non-Normal Positions.” Annual Proceedings/Association for the Advancement of Automotive Medicine, 383–397. Barcelona. http://www.ncbi.nlm.nih.gov/pubmed/3400220.
- Smulders, M., K. Berghman, M. Koenraads, J. A. A. Kane, K. Krishna, T. K. K. Carter, and U. Schultheis. 2016. “Comfort and Pressure Distribution in a Human Contour Shaped Aircraft Seat (Developed with 3D Scans of the Human Body).“ Work 54 (4): 925–940. doi:10.3233/WOR-162363.
- Song, Y. (Wolf), and P. Vink. 2021. “On the Objective Assessment of Comfort.” In Comfort Congress 2021, edited by N. Mansfield, S. Frohriep, A. Naddeo, V. Peter, & A. West. Nottingham: Chartered Institute of Ergonomics and Human Factors. https://comfort.ergonomics.org.uk/programme/#proceedings.
- Vink, P., and S. Hallbeck 2012. “Editorial: Comfort and Discomfort Studies Demonstrate the need for a New Model.” Applied Ergonomics 43 (2): 271–276. doi:10.1016/j.apergo.2011.06.001.
- Vink, P., and D. Lips. 2017. “Sensitivity of the Human Back and Buttocks: The Missing Link in Comfort Seat Design.” Applied Ergonomics 58: 287–292. doi:10.1016/j.apergo.2016.07.004.
- Vos, G.A., J.J. Congleton, J. Steven Moore, A.A. Amendola, and L. Ringer. 2006. “Postural versus Chair Design Impacts upon Interface Pressure.” Applied Ergonomics 37 (5): 619–628. doi:10.1016/j.apergo.2005.09.002.
- Wegner, M., R. Martic, M. Franz, and P. Vink. 2020. “A System to Measure Seat-Human Interaction Parameters Which Might be Comfort Relevant.” Applied Ergonomics 84: 103008. doi:10.1016/j.apergo.2019.103008.
- Wegner, Maximilian, S. Anjani, W. Li, and P. Vink. 2019. “How Does the Seat Cover Influence the Seat Comfort Evaluation?.” In Advances in Intelligent Systems and Computing, edited by S. Bagnara, R. Tartaglia, S. Albolino, T. Alexander, and Y. Fujita, Vol. 824, 709–717. Los Angeles: Springer Verlag. doi:10.1007/978-3-319-96071-5_75.
- XSensor. 2022. “Seating & Ergonomics.” https://www.xsensor.com/solutions-and-platform/design-and-safety/seating-ergonomics
- Zemp, R., W.R. Taylor, and S. Lorenzetti. 2015. “Are Pressure Measurements Effective in the Assessment of Office Chair Comfort/Discomfort? A Review.” Applied Ergonomics 48: 273–282. doi:10.1016/j.apergo.2014.12.010.
- Zenk, R., M. Franz, H. Bubb, and P. Vink. 2012. “Technical Note: Spine Loading in Automotive Seating.” Applied Ergonomics 43 (2): 290–295. doi:10.1016/j.apergo.2011.06.004.
- Zhao, C., S.huai Yu, C. Harris Adamson, S. Ali, W.hua Li, and Q.qian Li. 2020. “Effects of Aircraft Seat Pitch on Interface Pressure and Passenger Discomfort.” International Journal of Industrial Ergonomics 76: 102900. doi:10.1016/j.ergon.2019.102900.