
 ?Mathematical formulae have been encoded as MathML and are displayed in this HTML version using MathJax in order to improve their display. Uncheck the box to turn MathJax off. This feature requires Javascript. Click on a formula to zoom.
Abstract
In a previous study, an unexpected u-shaped relationship was observed between load level and fatigue/recovery responses. Moderate load levels resulted in lower perceived discomfort, pain, and fatigue, and shorter recovery times compared to either low or high load levels. This phenomenon has been reported in other studies, but no article has examined the possible mechanisms that might explain this u-shaped relationship. In this paper, we re-examined the previously published data and found that the phenomenon does not appear to be due to the experimental artefact; the u-shape may be due to unexpectedly lower fatigue effects at moderate loads, and higher fatigue effects at lower loads. We then conducted a literature review and identified several possible physiological, perceptual, and biomechanical explanatory mechanisms. No single mechanism explains the entirety of the phenomenon. Further research is needed on the relationship between work exposures, fatigue, and recovery, and the mechanisms related to the u-shaped relationship.
Practitioner summary: We examine a previously observed u-shaped relationship between load level and fatigue/recovery, where moderate force resulted in lower perceived fatigue and shorter recovery times. A u-shaped fatigue response suggests that simply minimising load levels might not be an optimal approach to reduce the risk of workplace injuries.
1. Introduction
Rose et al. (Citation2014) and Rose, Beauchemin, and Neumann (Citation2018) reported some unexpected findings in an experimental study of fatigue and recovery responses during and after one-hand static pushing efforts. In their study, participants perceived a more favourable, less fatiguing, loading situation at their moderate load level (30% maximum voluntary force—MVF) compared to either low (10% MVF) or high (50% MVF) load levels. This appears to be counterintuitive as one would expect fatigue and recovery times to increase steadily with workload levels. In this paper, we investigate this counterintuitive relationship between recovery/perceived discomfort and load level. If the u-shaped phenomenon is a real pattern, as opposed to an experimental artefact, this would have important implications for job design as lower loads might not always imply lower injury risks and better performance.
1.1. Background
Fatigue has been broadly described as a multi-dimensional construct, associated with various physical, psychological, socioeconomic, and environmental factors (Saito Citation1999). Narrowing the scope to work task factors, such as those described in Rose et al. (Citation2014), task-based fatigue involves a range of physical and cognitive processes. The relationships observed by Rose et al. (Citation2014) are believed to be a consequence of physical fatigue, which is characterised as a complex interaction between central (spinal and supraspinal physiological phenomena and impairments within the muscle afferent system) and peripheral (intramuscular factors and decline of contractile function) mechanisms (Boyas and Guével Citation2011; MacIntosh and Shahi Citation2011; Behm Citation2004; Westerblad, Bruton, and Katz Citation2010). Fatigue may be task dependent. The principle of task dependency indicates that task parameters, including cycle time, duty cycle, force amplitudes, and task duration may influence the contributions of central and peripheral fatigue mechanisms (Enoka and Stuart Citation1992; Yung and Wells Citation2017).
Briefly described here, the Rose et al. (Citation2014) study involved 15 different sessions, each with two consecutive trials. Trials consisted of a loading and recovery phase. During the loading phase, perceived discomfort, pain, and fatigue (henceforth collectively labelled as perceived discomfort—PD) were rated every 30 s. During the recovery phase, participants rested until they perceived that they had recovered sufficiently to resume the task—the voluntary resumption time (RT). Prior to performing all experimental sessions, each participant performed three maximal voluntary pushing force exertions. From the average of these, three sub-maximal load levels were calculated: 10, 30, and 50% of maximum voluntary force (MVF) referred to as load level (LL). These load levels have been described as low, moderate, and high, respectively (Sjøgaard Citation1996). Over three initial experimental sessions, participants’ subjectively determined endurance time (ET) was assessed at each of the three load levels. Using the average of maximum ET, loading time (LT) was then calculated for each load level at five fractions (10, 30, 50, 70, and 100%) of ET. Fatigue and recovery responses for each combination of load level (10, 30, 50% MVF) and the remaining submaximal loading times (10, 30, 50, and 70% of ET) were determined over the remaining twelve sessions. In the Rose et al. (Citation2014) study, the period of self-selected recovery between two bouts of a fatiguing one-hand static pushing task (RT) was shortest, and perceived discomfort (PD) during and at the end of the pushing task was lowest, for a moderate load level of 30% MVF. Interestingly, while PD was highest at the highest load level of 50%, RT was longest at the lowest load level, 10% MVF. Graphically, these findings show a u-shaped relationship between RT and LL for different relative LTs (), as well as between PD and LL ().
Figure 1. U-shaped relationship between load level (10%, 30%, 50% MVF), expressed as a fraction of 1.0 (100% MVF) and Resumption Time (RT), for five levels of endurance time. The u-shaped pattern was most pronounced at higher fractions of endurance time.
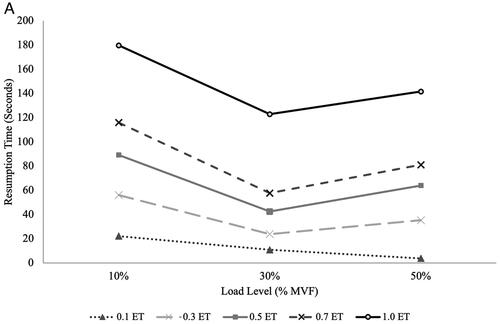
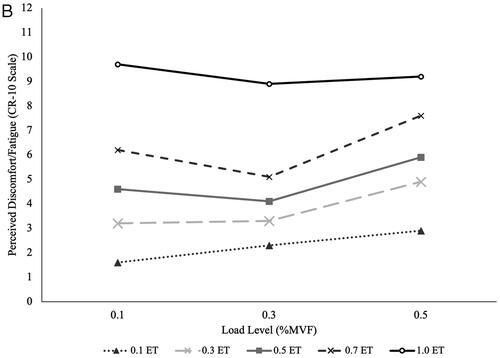
Figure 2. Flow chart illustrating our steps in addressing study research questions. The flow chart guides the reader through (1) our initial brainstorming to ideate hypotheses of possible fatigue and recovery mechanisms related to task load (Section 2), (2) a re-examination of Rose et al. (2014) data through two secondary data analysis methods (Section 3), and (3) a review of literature of potential mechanisms (Section 4). The secondary data analysis is presented as sequential methodology and results sub-sections, for each analysis method, to help navigate readers through the process and assist in interpreting the results of each method. The literature review is presented in the methodology and results sections for each load level.
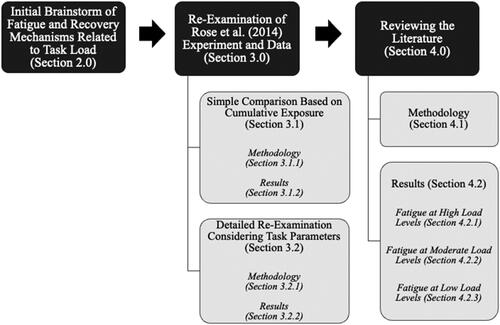
Figure 3. Concept map of authors’ brainstorming of possible fatigue and recovery mechanisms related to task load. Four groupings of mechanisms emerged: experimental, physiological, biomechanical, and perceptual factors.
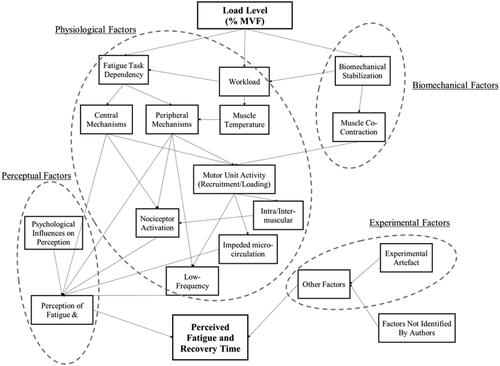
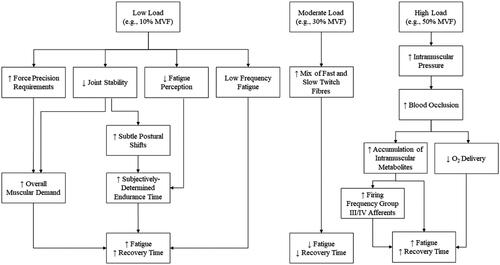
Figure 4. Possible fatigue mechanisms at low, moderate, and high load levels. Hypothesised inter-linked mechanisms that may co-occur, act in combination, or synergistically to increase fatigue and recovery time at low loads. Moderate loads may activate an optimal mixture of fast and slow twitch muscle fibres to reduce fatigue and recovery time. Fatigue responses observed during high load experimental conditions met expectations. Known mechanisms at high load levels include increases in intramuscular pressure leading to blood occlusion and subsequent accumulation of metabolites and decrease in oxygen delivery.
Similar u-shaped relationships between load level and fatigue have been noted in other human factors and work physiology studies. These previous studies represent potential replications of the effect we are examining here. For example, Wood, Fisher, and Andres (Citation1997) observed a u-shaped relationship between fatigue and load level where each load level condition consisted of 9-min bouts of intermittent hand grip contractions at a fixed impulse ratio of 10%. At their moderate load level (32% of maximum voluntary contraction, MVC), decrements in grip force at the end of the bout were significantly less than their higher load level (48% MVC), an indication that participants experienced less fatigue at the moderate load level. Similarly, their participants experienced less fatigue at moderate load levels compared to lower load levels of 16% MVC, but the effect was not statistically significant. In Wood et al.’s paper, ratings of perceived exertion also shared a u-shaped relationship, with significant effects between load levels. Mehta and Agnew (Citation2012) similarly observed greater strength recovery following a bout of intermittent static shoulder abduction, until volition, at 35% MVC compared to load levels of 15% MVC and 55% MVC. These previous observations, in addition to Rose et al. (Citation2014), warrant a further discussion on the possible mechanisms that could explain these u-shaped relationships to set the stage for further research on this issue.
The objective of this paper is to identify and discuss possible mechanisms of the u-shaped relationship exhibited for the subjectively assessed recovery and perceived discomfort parameters identified by Rose et al. (Citation2014). Our approach more specifically focussed on addressing the following research questions (RQs): (RQ1) was the u-shaped relationship a result of the experimental artefact or is it possibly a real phenomenon? (RQ2) if the u-shaped relationship was a real phenomenon, could the u-shaped relationship be better explained by an unexpectedly lower fatigue and recovery time at the moderate load level? Or unexpectedly higher fatigue and recovery time at the lower load level? Or both? And (RQ3) what possible physiological, biomechanical, and perceptual mechanisms might explain this phenomenon?
We addressed these research questions through (1) ideating hypotheses of possible fatigue and recovery mechanisms related to task load; (2) re-examining Rose et al. (Citation2014) data; and (3) reviewing the literature on potential mechanisms that support our hypotheses. These research steps are illustrated in to help guide the reader through our process and assist in the interpretation of the results.
2. Initial brainstorming
An ad hoc group of researchers, experienced in occupational and fatigue research, were assembled to identify potential factors to explain the observed u-shaped phenomenon. This group of researchers is the authors of this article.
The team first brainstormed on general fatigue and recovery mechanisms related to task load; these mechanisms were then organised into a concept map (). From this concept map, four groupings of potential mechanisms emerged: experimental, physiological, biomechanical, and perceptual factors.
The following sections focus on re-examining the Rose et al. (Citation2014) data and possible mechanisms that may explain the u-shaped phenomenon within our identified groups of factors. In the final section, we discuss the potential implications of a u-shaped fatigue relationship for research and for practice, including potential research questions for subsequent studies.
3. Re-examining Rose et al. (Citation2014) experiment and data (RQ1 and RQ2)
Addressing RQ1 and RQ2 in the first portion of this study, we re-examined Rose et al. (Citation2014) experimental data to identify whether the u-shaped relationship was a consequence of an experimental artefact or possibly a true phenomenon. This re-examination consisted of two methods: (3.1) simple comparison of experimental conditions while considering cumulative exposure (i.e. total performed work output); and (3.2) detailed re-examination of experimental conditions while considering potential interactions between task parameters.
3.1. Simple comparison of experimental conditions based on cumulative exposure
3.1.1. Potential for inequitable work across experimental trials (RQ1)—methodology
We first re-examined whether there were differences in cumulative exposure—by calculating total performed work output—between experimental conditions in Rose et al. (Citation2014). Total performed work is a function of exposure time and load (Mathiassen and Winkel Citation1991). Tension-time product, a widely accepted index of total performed work, has been previously used to estimate mechanical load, energy utilisation, blood flow, and fatigue susceptibility, and is closely matched to fatigue development (Klawitter and Clanton Citation2004). When kept constant, equitable comparisons can then be made between task conditions with different forces and durations (Byström and Fransson-Hall Citation1994). Tension-time product can be kept constant across experimental conditions by manipulating contraction intensity, duty cycle, or endurance time (Byström and Fransson-Hall Citation1994; Adamo et al. Citation2009). Tension-time product ( (EquationEquation 1
(1)
(1) ) for each of Rose et al. (Citation2014) experimental loading condition was calculated as the product of load level (LL, expressed as a % of MVF), duty cycle (
fraction of the contraction in a contraction-relaxation cycle), and the loading time (LT, expressed in minutes) (Mathiassen and Winkel Citation1991; Byström and Fransson-Hall Citation1994).
(1)
(1)
We plot tension-time product values at each combination of load level and fraction of endurance time.
3.1.2. Potential for inequitable work across experimental trials (RQ1)—results
We found a u-shaped relationship, which followed a similar pattern to RT (Supplementary Appendix, Figure A1), where the u-shaped pattern was increasingly pronounced as loading time increased towards 100% of endurance time (described as ‘relative loading time’, RLT, in Rose et al. Citation2014). This finding suggests that Rose et al.’s u-shaped relationship may be a consequence of differences in total work performed, where fatigue was lower during the moderate load level (LL30) condition, and hence recovery/resumption time was the shortest. Wood, Fisher, and Andres (Citation1997), however, observed a similar u-shaped pattern despite controlling for the total work performed across conditions by maintaining a constant impulse ratio (as described by Wood, Fisher, and Andres Citation1997). Impulse ratio was defined as the product of the duty cycle and amplitude of force (% of MVC). When combined with Wood, Fisher, and Andres (Citation1997) fixed absolute endurance period of 9 min, Wood et al.’s impulse ratio is equivalent to tension-time product. Thus, the findings of Wood, Fisher, and Andres (Citation1997) suggest that a u-shaped pattern continues to exist even when workload is constant between load level conditions. We, therefore, conclude, in response to RQ1, those apparent workload inequities, based on simple comparisons of total work output between experimental conditions in Rose et al. (Citation2014), do not explain the presence of the observed u-shaped fatigue-load phenomena.
3.2. Detailed re-examination of experimental conditions considering interactions between task parameters
3.2.1. Detailed re-examination of experimental conditions and what might explain the u-shape? (RQ1 and RQ2)—methodology
Despite its wide acceptance in understanding fatigue and energetics, tension-time product is a simple index that cannot account for all the complexities of work, and its appropriateness for measuring realistic workloads may be questioned. Therefore, a more detailed re-examination of total work performed during the Rose et al. (Citation2014) study was conducted that takes into consideration the potential interactions between individual task parameters.
We conducted a more detailed re-analysis of the Rose et al. (Citation2014) data that took into consideration possible circumstantial interactions between task parameters that could explain or further illuminate the apparent u-shaped relationship. Task parameters, such as force, duration of force, frequency of force, and working period, can have different effects on each other and on the musculoskeletal system (Gallagher and Heberger Citation2013).
For this detailed re-examination and to better understand what might explain the u-shaped relationship (addressing RQ2), we plotted the experimental raw data between the parameters of:
Loading Time (LT) and Perceived Discomfort (PD)
Resumption Time (RT) and Perceived Discomfort (PD)
Resumption Time (RT) and LT
Duty Cycle (DC) and PD, and
Frequency (F) and PD.
3.2.2. Detailed re-examination of experimental conditions and what might explain the u-shape? (RQ1 and RQ2)—results
After plotting the experimental data between combinations of parameters, we had three general observations. (1) Regardless of load level, there appeared to be positive linear relationships between LT and PD (Supplementary Appendix, Figure A2), RT and PD (Supplementary Appendix, Figure A3), and RT and LT (Supplementary Appendix, Figure A4), and a negative linear relationship between DC and PD (Supplementary Appendix, Figure A5). The slopes of these linear relationships were dependent on load level. (2) There was an apparent non-linear relationship between F and PD (Supplementary Appendix, Figure A6). (3) The shortest LTs had very low RTs which created markedly higher frequencies, especially for the moderate and high load levels.
Two additional observations were made to the LL10 combinations. First, DC (which conflates LT and RT) was effectively constant across all LL10 combinations, i.e. DC did not materially change regardless of the underlying LT. Therefore, at LL10, increases in LT did not result in a proportional increase in RT, as was the case for LL30 and LL50 combinations. Second, the trends between LT and PD, and RT and PD, were strongly linear (r2 = 0.995 and r2 = 0.997, respectively), and both had logical y-intercepts of zero.
If the aforementioned LL30 and LL50 high-frequency data points are assumed to be spurious, then the DC trendlines for LL10, LL30, and LL50 converge at ∼63% DC (for low LT and at correspondingly low PD), with the caveat that the LL10 trend is shifted towards a modestly higher 66% DC at longer LTs (Supplementary Appendix, Figure A5). If we further assume that: (1) Consistent with findings from Rohmert et al. (Citation1986) and others, DC does not change for the low-load condition of LL10, regardless of the underlying LT, and (2) The 63% DC convergence for load levels is ‘correct’, then we could conclude that LT was ‘too long’ for LL10 combinations (relative to LT for LL30 and LL50 combinations). Ultimately, we can then adjust LT downward such that DC is constant at 63%.
This re-examination of the Rose et al. (Citation2014) data suggests that participants might have longer than expected endurance time for LL10. If the LL10 endurance time had been ∼320s, rather than 376s, LTs would have been less. These shorter LTs would likely have resulted in lower PD measurements for LL10 combinations (based upon the PD = 0.0259*LT linear relation) that would not have exhibited a u-shaped relationship.
This initial conclusion from re-analysis is limited by the underlying assumptions and further complexities described below, and thus we cannot determine the true cause of the u-shaped relationship from this exploration. Nonetheless, we conclude that the observed u-shaped relationship apparent in the Rose et al. (Citation2014) data is unlikely to be merely an experimental artefact and more likely to be a real phenomenon driven by how humans experience, perceive and process stress, strain, and fatigue in their bodies. We address possible mechanisms that would explain this phenomenon (RQ3) in the next session.
4. Reviewing the literature on potential physiological, perceptual, and biomechanical mechanisms (RQ3)
4.1. Reviewing the literature—methodology
The authors conducted a review of the literature to identify studies that discussed these potential physiological, biomechanical, and perceptual mechanisms, informed by our re-examination, in further detail. Studies were first identified by the authors from their knowledge of this topic area. From these author-identified papers, we conducted a systematic citation chasing of key studies, using both backward reference chaining and forward citation chaining approaches (Booth Citation2008). Backward chaining was conducted by examining the bibliography of references for key studies and forward chaining using Google Scholar to identify papers that cited author-identified papers. We then conducted targeted searches using keywords attributed to potential factors using PubMed/MEDLINE and Scopus databases. Relevant papers that were identified in the search were reviewed for their potential in explaining the u-shaped fatigue/recovery and load level relationship, and when deemed relevant by authors, article information was extracted and interpreted.
4.2. Reviewing the literature—results
Since PD for LL10 was consistently and substantially lower than PD for LL50, we hypothesise that PD for LL30 was unexpectedly low, contributing to the observed u-shaped trend. The detailed re-examination of data did not rule this possibility out. Thus, we believe that the u-shaped relationship may be principally driven by either or both: (1) unexpectedly lower fatigue effects at moderate load levels and (2) unexpectedly higher fatigue effects at lower load levels (as described above).
We reviewed the literature to find evidence supporting, or refuting, our hypotheses of physiological, biomechanical, and perceptual mechanisms relevant to the u-shaped relationship. The mechanisms of fatigue and the pathophysiology of musculoskeletal disorders have been extensively documented in comprehensive reviews (e.g. Allen, Lamb, and Westerblad Citation2008; Visser and van Dieën Citation2006, etc.), and are not the sole focus of this current review. We first briefly discuss known possible mechanisms of fatigue relevant to high load levels; the observed fatigue responses at high load levels were as expected. We then discuss, in greater detail, the possible mechanisms that may play a role in the observed fatigue resistance at the moderate load level, and the relatively higher fatigue and recovery finding at the lower load level.
4.2.1. Expected higher fatigue at high load level
As expected, we observed higher fatigue effects at high load levels. At high load levels, increased fatigue, and consequently recovery, have been hypothesised to be related to blood flow occlusion that disturbs muscle homeostasis, leading to the accumulation of metabolites and detrimental effects on oxygen delivery (Sjøgaard, Savard, and Juel Citation1988; Hammer et al. Citation2020), and is strongly connected to the pain development process (Visser and van Dieën Citation2006). During sustained static, high-intensity contractions, intramuscular pressure may be elevated to above arterial blood pressure, leading to blood flow occlusion (Sjøgaard Citation1996; Visser and van Dieën Citation2006). Blood occlusion may lead to increases in interstitial potassium (K+) (Sjøgaard Citation1996), which is related to a decrease in sarcolemmal excitability, and consequently reduced action potential conduction velocity and amplitude (Bigland-Ritchie, Jones, and Woods Citation1979), which affects force development and fatigue recovery (Byström and Sjøgaard Citation1991). Intense fatiguing contractions also induce sodium (Na+) and chloride (Cl−) influx, but large force depressions were only observed when the interstitial-intracellular Na+ gradient was substantially reduced (McKenna, Bangsbo, and Renaud Citation2008). The role of Cl− on muscle contractility is less well-established in the literature (McKenna, Bangsbo, and Renaud Citation2008).
The accumulation of intramuscular metabolites, due to blood flow occlusion, has been shown to also increase the firing frequency of group III/IV muscle afferents (Kaufman and Rybicki Citation1987). In turn, these group III/IV muscle afferents may facilitate inhibitory feedback regulating central motor drive and voluntary muscle activation (Amann Citation2012), which serves as a possible protective mechanism of intramuscular metabolic perturbation. However, the consequence of increased inhibitory feedback from group III/IV muscle afferents is an increase in central fatigue. In support of this paradigm, Broxterman et al. (Citation2015) found that muscle blood occlusion exacerbated the development of both peripheral and central fatigue.
4.2.2. Possible mechanisms explaining observed lower fatigue at the moderate load level
Physiological factors may play a role in fatigue resistance at LL30. We hypothesised that Rose et al. (Citation2014) moderate load level activated a mixture of fast- and slow-twitch muscle fibres that are most resilient to fatigue and led to relatively shorter resumption times.
According to Henneman’s size principle, motor units are recruited in an orderly fashion according to size, from smaller type I ‘slow twitch’ motor units to larger type II ‘fast twitch’ motor units (Henneman Citation1957). With increasing recruitment of motor units within a muscle, and modulations of their firing rates, the force of contraction increases (Conwit et al. Citation1999), and different types of motor units may be differentially activated for different tasks. As it relates to fatigue, Potvin and Fuglevand (Citation2017) found that a 20% maximum voluntary contraction, sustained until exhaustion, led to significant reductions in force across the motor unit population (28% of the motor unit population were completely exhausted); whereas motor units during high force sustained contractions (i.e. 80% of maximum voluntary contraction) retained at least 86% of their initial force capacity. Therefore, relative to time-to-exhaustion, high force exertions (e.g. 80% of maximum voluntary contraction) induced relatively less fatigue than low force exertions (e.g. 20% of maximum voluntary contraction)—the range across which the u-shaped response was observed.
The u-shaped pattern may, therefore, be attributed to the relative involvement of fast- and slow-twitch muscle fibres where load levels below 40% of maximum voluntary contraction are more likely to involve slow-twitch fibres than fast-twitch fibres (Deeb, Drury, and Pendergast Citation1992; Wood, Fisher, and Andres Citation1997). Studies have categorised high- and low-threshold motor units, above and below an activation threshold of 25% of maximum voluntary contraction (Carpentier, Duchateau, and Hainaut Citation2001), with appreciable increases in firing rates at loads >30% (Conwit et al. Citation1999). The mixture of motor unit or fibre types may play a more significant role when contractions are not performed until exhaustion, but rather performed at a targeted endurance time (i.e. in Rose et al. Citation2014) or to the same degree of partial fatigue (i.e. in Potvin and Fuglevand Citation2017). As with Hawkins and Hull (Citation1993) model, at higher load levels (e.g. 85% of maximum voluntary contraction), the degree of fatigue was substantial among high threshold motor units and less among lower threshold motor units (Potvin and Fuglevand Citation2017). At lower load levels (e.g. 15% of maximum voluntary contraction), lower threshold motor units had significant reductions in force capability while higher threshold motor units exhibited less fatigue (Potvin and Fuglevand Citation2017). Interestingly, Rose et al. (Citation2014) observed the u-shaped pattern even for efforts at 100% of endurance time () where, presumably, both slow- and fast-twitch fibres were exhausted. This suggests that the interplay between muscle fibres may not be the sole driver of the u-shaped pattern.
4.2.3. Possible mechanisms explaining observed higher fatigue at the low load level
The observed u-shaped pattern may not only be due to reduced fatigue at the moderate level but could be attributed to factors operating at lower load levels. At low loads, possible mechanisms are related to physiological, perceptual, and biomechanical factors.
4.2.3.1. Physiological factors
We hypothesised that at low loads, low frequency fatigue may play a role in fatigue persistence. Studies have shown long-lasting persistent weakness and fatigue at moderate to low levels of frequency stimulation (Edwards Citation1978). Termed low-frequency fatigue, this phenomenon may involve structural changes to the processes involved in excitation-contraction coupling, most likely of proteins involved in calcium handling from the sarcoplasmic reticulum, resulting in a decrease in calcium release (Westerblad and Allen Citation2002). These low frequencies are similar to discharge rates of motor units during everyday activities and may be produced by minor exertions (Edwards et al. Citation1977). Although low-frequency fatigue is often viewed as a phenomenon most prominent after eccentric activity; there is mixed evidence of the extent of low-frequency fatigue after voluntary concentric or isometric exercise (Jones, Newham, and Torgan Citation1989; Dundon, Cirillo, and Semmler Citation2008). While Jones, Newham, and Torgan (Citation1989) observed significant low-frequency fatigue after an eccentric elbow flexion exercise, the authors found minimal changes after isometric and concentric activity. More recently, Dundon, Cirillo, and Semmler (Citation2008) observed low-frequency fatigue in both their eccentric and concentric conditions, particularly immediately after exercise, but low-frequency fatigue was more prolonged after eccentric exercise. Consequently, and especially if 10% MVF endurance time was longer than expected, performing exertions at a low load level in Rose et al. (Citation2014) may have resulted in persistent low-frequency fatigue leading to extensive recovery times compared to the two higher load level conditions. If true, this increased persistence of fatigue from low level loading would help, at least in part, explain the unexpectedly longer RTs for low loads, leading to the u-shaped pattern in the Rose et al. (Citation2014) dataset.
4.2.3.2. Perceptual factors
We hypothesised that at low loads, the unexpected fatigue and recovery findings may be due to the inability of humans to perceive fatigue; this perceptual factor may have resulted in extended self-selected endurance time at low loads. Rose et al. (Citation2014) measured RT and PD based on self-reported discomfort/pain/fatigue measures. These self-reported measures involve sensations of fatigue, discomfort, pain, and effort that could be derived from centrally generated commands and high-level neuronal processing (Enoka and Stuart Citation1992). Perception of fatigue has been shown to be strongly coupled to tasks involving short transient changes in force production rather than low-level static or dynamic exertions (Moussavi, Lehman, and Miller Citation1992; Adamo, Martin, and Johnson Citation2002; Adamo et al. Citation2009). Adamo et al. (Citation2009) found that conditions with long-lasting depression of twitch force during recovery did not coincide with highly exertive conditions that led to the highest post-bout subjective ratings of fatigue. The psychobiological model, based on motivational intensity theory, may help explain the effects of perception on work/exercise performance. The psychobiological model is an effort-based decision-making model, where the perception of effort, motivation, previous experience, and knowledge of time or distance completed and remaining, are primary factors in the conscious regulation of pace (Pageaux Citation2014).
We further hypothesise that attentional focus, classified by direction of attention (external and internal) or dimensions of relevance (task relevant or irrelevant), may be factors responsible for modulating task performance (Lohse and Sherwood Citation2011; Bigliassi Citation2015). Focussing externally on task (un)related cues, compared to internally on physiological cues, may particularly affect subjective perception of exertion and may improve or impair objective measures of performance (Lohse and Sherwood Citation2011). According to Bigliassi (Citation2015), attending to task-unrelated cues, such as visual or auditory stimuli, attenuates processing of corollary signals, as the brain has limited capacity to process different internal and external sensory cues; this distractive response enhances situational motivation and may reduce fatigue-related effects, including perceived exertion. Shifting attention to external task-unrelated cues may be easier during low-intensity workloads. With increasing work intensity (i.e. load levels), attention focus may be reallocated to internal sensory cues (Bigliassi Citation2015). Therefore, we hypothesise that the possible inability to perceive fatigue at lower force levels may have led to unexpectedly longer subjectively determined endurance times that resulted in unexpectedly longer load times in the Rose et al. (Citation2014) protocol; this all may have led to the relatively higher than expected perceived discomfort ratings and recovery times at 10% MVF.
4.2.3.3. Biomechanical factors
At low loads, elevated fatigue may be explained by (1) additional requirements to maintain the necessary force precision to meet the demands of higher task complexity, and relatedly, (2) increase joint stiffness to enhance joint stabilisation. Both may work synergistically to increase overall muscle demand, contributing to higher fatigue levels at lower loads during experimental task conditions. Unconstrained conditions may also allow for subtle postural shifts, a mechanism that could decrease fatigue and discomfort during exertion but could also contribute to higher-than-expected endurance times in the experimental study.
We hypothesise that at the lower force level in the Rose et al. (Citation2014) study, there was an increased precision requirement to suppress the natural tendency to scale towards a higher force, leading to increased fatigue at the lower load level compared to moderate load levels. In a study comparing motor performance between three levels of force (5, 35, 65% of maximum voluntary contraction) during 3-min bouts of intermittent contractions of various joints, including the shoulder, Mehta, Nussbaum, and Agnew (Citation2012) observed a u-shaped pattern between level of force and force fluctuations. Percentage of fluctuations in the exerted force or torque was lower at 35% compared to 5 and 65% maximum voluntary contraction levels. Force fluctuations and human brain activity have been examined during precision grip tasks at three force conditions: grasping an object gently (low grip force), with a normal hold, and with a firm grasp (high grip force) (Kuhtz-Buschbeck, Ehrsson, and Forssberg Citation2001). Stronger brain activity, indicating greater demands of dextrous control and precision requirements, was associated with the gentle grip force and was least activated during the normal hold task. Increases in brain activity during the firm grasp task, compared to the normal hold, may be due to increases in exerted forces or a change from automatic to voluntary control (Kuhtz-Buschbeck, Ehrsson, and Forssberg Citation2001).
At lower loads we also hypothesise that to enhance stability and to resist gravitational force on the arm, there were increased joint stiffness requirements leading to elevated muscle activity levels. In Rose et al. (Citation2014), participants pushed a handle with the arm at 90° shoulder forward flexion. At low load levels, the decreased pushing force acts to reduce joint stability. Less stability and, therefore, increased degrees of freedom are associated with significant increases in overall muscular demand and increases in perceived difficulty of control (Fischer, Wells, and Dickerson Citation2009). This mechanism may in part help explain greater fatigue responses at lower loads.
During unconstrained exertions, subtle postural changes or shifts may also serve as a mechanism to decrease fatigue and discomfort. This mechanism is along the same lines as intra-muscle motor unit variability (including substitution and rotation), as coordinated changes in muscle activity or recruitment patterns, and therefore relative contribution, from muscles involved in the movement or exertion may reduce fatigue and discomfort (Srinivasan and Mathiassen Citation2012). This mechanism may have directly contributed to the higher-than-expected endurance times at low loads as different motor units can provide the required force over time, and hence increased accumulation of fatigue, at LL10 compared to LL30 in the Rose et al. (Citation2014) study. The overall effects of subtle postural shifts during an exertion, however, may be weighed against the overall increase in continuous co-contraction due to less stability.
5. General discussion
The re-examination of the Rose et al. (Citation2014) data suggests that the observed u-shaped pattern is independent of simple differences in total work performed and of differences between conditions after taking into consideration the interactions of task parameters—the u-shaped phenomenon appears to be possibly a real phenomenon and not an experimental artefact. Supported by the re-examination of data, we hypothesised that unexpected fatigue effects at both the lower (elevated fatigue response finding) and moderate loads (lowered fatigue response finding) were primary drivers of the u-shaped pattern and found potential evidence in the scientific literature supporting the unexpected fatigue effects at these two load levels.
While we cannot specifically quantify what is causing this u-shaped phenomenon, we have identified seven plausible physiological, perceptual, and biomechanical mechanisms that would be present in a wide variety of real-world and experimental settings—these are summarised in .
Table 1. Summary of possible mechanisms at three load levels [low (10% MVF), moderate (30% MVF), high (50% MVF)] contributing to the u-shaped fatigue phenomenon.
As no single mechanism adequately explains the entirety of the u-shaped relationship, we believe that these possible mechanisms may be acting in concert to create the observed u-shaped response. For instance, low loads combined with longer than expected endurance time (possibly at least partly due to the freedom to engage in subtle postural shifts to redistribute local muscular loading or the imperceptibility of fatigue across the long duration at this load level), and overall muscle demand (possibly due to overall increase in continuous co-contraction due to less joint stability and increased precision requirements), may increase the magnitude of perceived fatigue. At low loads, the risk of more persistent low-frequency fatigue may also prolong recovery time. At moderate loads, there may be an advantageous mix of fast- and slow-twitch muscle fibres, and optimal conditions of moderate precision requirements and joint stability to reduce both fatigue and recovery time. We present in , possible fatigue mechanisms based on load levels, and show the hypothetical linkages between these interconnected mechanisms for low and moderate loads—the speculated drivers of this u-shaped pattern.
5.1. Limitations
A u-shaped phenomenon was observed by Rose et al. (Citation2014) and similarly by other research groups (e.g. Wood, Fisher, and Andres Citation1997; Mehta and Agnew Citation2012). This paper examined the phenomena in greater detail by conducting a secondary analysis of the Rose et al. data (Section 3), consisting of two methods: simple comparison by considering cumulative exposure (Section 3.1) and a detailed re-examination by considering potential interactions between task parameters (Section 3.2). We then conducted a literature review (Section 4) to initiate discussion around the unexpected fatigue and recovery finding.
As with any secondary analysis of an existing data set, there are limitations. First, we are limited to investigating the phenomenon at the load levels performed in the original Rose et al study and cannot extrapolate the phenomenon beyond 50% MVF. The range of load levels below 50% MVF, however, are occupationally and task relevant (Westgaard and Winkel Citation1996; Engelhoven et al. Citation2018; Alabdulkarim, Kim, and Nussbaum Citation2019). Nonetheless, future studies should explore the effects at different levels of force. We have posed several research questions in Section 5.2 that we believe would further our collective understanding of the possible u-shaped phenomenon. Second, a common limitation of secondary data analysis is the restriction of analysis to only the available data and the absence of potentially important variables, this may lead to residual confounding (Cheng and Phillips Citation2014). Future studies should investigate this u-shaped phenomenon after controlling for task variables, such as duty cycle, load level, and contraction time, and other personal factors, such as sex/gender, to better elucidate the u-shaped response. Third, secondary data analysis is subjected to study-specific nuances in the data collection process that may affect the interpretation of findings. In this circumstance, the authors of this article had access to the dataset and first-hand knowledge from an author of the original study, allowing us to carefully re-examine the data.
While the information provided here is based upon a methodical review of the literature, this was not a systematic review. Our search protocol included author-identified papers, backward citation search, and multiple searches through databases. Together, this search strategy increases the likelihood that we covered major sources. Our evaluation and interpretation of potential mechanisms leading to the observed u-shaped relationship between load and fatigue are based upon, and simultaneously limited by, our collective experience and professional judgements. Additionally, although we identified many more mechanisms related to extraordinary fatigue effects at low force levels than moderate levels, this may rather reflect overlooked mechanisms in our brainstorming and/or gaps in the science on fatigue effects at moderate loads. In light of these aforementioned limitations, we invite and encourage experts in each of these domains to clarify interpretation and to provide or further elucidate information that would help explain, more definitively, this potentially important phenomenon.
5.2. Implications for research
Although we have outlined potential factors that might explain the u-shaped relationship, given the described study limitations, further research studies are warranted to investigate these mechanisms as they relate to the u-shaped relationship. The following are research questions that we invite experts to address in helping explain this u-shaped phenomenon.
(1) What is the effect of level of force on fatigue responses during various task and contraction types (e.g. intermittent vs. static, concentric vs. eccentric) and of various body regions and muscle groups (e.g. upper extremities, ambulatory muscles, stability muscles)?
Rationale: The assumption of a linear, progressive response between load level and fatigue effect is contradicted by the findings of studies, such as Rose et al. (Citation2014). With additional targeted research, this assumption can be supported or disproven, with different distinct load levels or a continuum of load levels. Additionally, fatigue is task dependent, influenced by task intensity and duration, type of contraction, and muscle groups involved. Targeted research on the dose-response relationships should consider the task dependency of fatigue while using a complementary set of direct physiological measurements for a comprehensive understanding of fatigue responses.
(2) What is the relationship between workload, fatigue, and recovery? How do the above-mentioned factors, described in the first research question, affect recovery?
Rationale: The literature on recovery and resumption time based on workplace exposures is sparse, as there has been less emphasis on the role of recovery at work (referred to as internal recovery) and during non-work time (referred to as external recovery) (Demerouti et al. Citation2009). There are few studies that have examined the relationship between job demands and need for external recovery after work shifts. In these studies, job demands significantly predicted the need for external recovery (Sonnentag and Zijlstra Citation2006; De Raeve et al. Citation2007), and work schedule was an important factor (Jansen, Kant, and van den Brandt Citation2002). Fewer studies examine the relationship between jobs with low-level exertions and external recovery. On the relationship between fatigue and recovery, Demerouti et al. (Citation2009) argued that fatigue and recovery are related but are not identical constructs; fatigue is a consequence of lack of recovery rather than a concept describing the recovery process. A better understanding is required to determine factors not only affecting fatigue, but also those that affect internal and external recovery.
(3) After controlling for total work performed, across duty cycles, load levels, and contraction times, is the u-shaped phenomenon evident?
Rationale: There remains conflicting evidence (e.g. Wood, Fisher, and Andres Citation1997) regarding the u-shaped pattern when total performed work was kept constant. Further, it is unclear how force, duration of force, frequency of force, and period of exposure (e.g. hours) interact to create total work. The concept of equivalent work needs a reliable and robust definition. And subsequently, more studies on fatigue and resumption time are needed to compare load levels, at equivalent work levels, while manipulating underlying combinations of force, frequency, and duration.
(4) What is the relationship between load level, fatigue responses, and outcomes for human health and for work performance?
Rationale: The observed u-shaped relationship was attributed to fatigue and resumption time. There is strong evidence that suggests a link between fatigue and work performance in both well-controlled experimental studies (e.g. Mizuno and Watanabe Citation2008; Buckley et al. Citation2016) and realistic work scenarios (e.g. Hamrol, Kowalik, and Kujawińsk Citation2011; Bosch et al. Citation2011; Kolus, Wells, and Neumann Citation2018; Yung et al. Citation2020). It has also been hypothesised that fatigue is a precursor to adverse longer-term health outcomes, such as musculoskeletal disorders (Armstrong et al. Citation1993). Large-scale studies of associations between workplace exposures, such as load level, and organisational performance metrics or individual-worker chronic diseases, including MSD, are highly desirable to potentially address this much needed avenue of research. If a u-shaped pattern exists, this may affect the interpretation of large-scale population studies on exposure-outcome associations as there is an assumption that predictor variables (e.g. level of force) and dependent variable (e.g. level of fatigue, MSD risk, or case status) follows a particular direction and is constant over the entire range of values (Ranganathan, Pramesh, and Aggarwal Citation2017). If this assumption does not hold true, odds ratios may not give valid results for the full range of force values. Future occupational epidemiological work should consider risk profiles across the entire load amplitude spectrum.
5.3. Implications for practice
An improved understanding of the effects of load level on fatigue and recovery would have major implications on reducing the risk of MSD and possibly decrements in work performance, and ultimately help create sustainable jobs. Fatigue is a purported precursor to MSD and is linked to decrements in work quality and productivity. Worker fatigue has also been broadly linked to quality deficits in manufacturing systems, suggesting this aspect is an important issue for organisational performance (Kolus, Wells, and Neumann Citation2018; Yung et al. Citation2020). With specific knowledge of what causes phenomena, such as the u-shaped relationship that is the focus of this paper, we can develop targeted interventions, such as designing jobs and tasks that optimise work-recovery patterns. The lower perceived fatigue and shorter resumption time during the moderate load reminds us that the relationship between load level and fatigue/recovery are likely not linear and may not even be progressive. Findings, such as those from Rose et al. (Citation2014) suggest that lower forces (e.g. 10% MVF) may be particularly problematic, leading to significant persistent fatigue and prolonged recovery times. These findings are aligned with the supposition that MSD and its symptoms are prevalent at levels of force exposures below 10% (Westgaard and Winkel Citation1996). If true, for both researchers and occupational health and safety practitioners, this would be counter to conventional ergonomics thinking about how to design tasks and could have significant implications for both job surveillance and design: Less load is not always healthier. Wells et al. (Citation2007) illustrated the repercussions of a singular focus on reducing mechanical exposure amplitudes, in that reductions in load level may have secondary, and unexpected, effects on time patterns, with reduced variation and increased duration of exposure, leading to increased risk of MSD. Studies from Denmark showed increased prevalence of workers reporting musculoskeletal pain and excessive fatigue despite implementation of ergonomic aids and principles and increased automatisation that reduced mechanical exposure (Holtermann, Mathiassen, and Straker Citation2019).
Identifying levels of force that minimise fatigue, or otherwise optimise fatigue and recovery response between low and high loads are worthy of further study and quantification. Further, and more pragmatically, introducing exposure variation and task diversity may be a more useful intervention (Mathiassen Citation2006) than minimising forces below moderate levels. Exposure variation may be particularly useful for occupations characterised by long periods of low loads, such as office work or manufacturing where workers may routinely perform static work. For example, Yung, Mathiassen, and Wells (Citation2012) observed that time-varying forces may be a useful intervention to reduce fatigue in workers performing low-load tasks. Increasing exposure variation and task diversity are a means to achieve improvements in the health and physical capacity of workers and are fundamental to the Goldilocks Principle (Holtermann, Mathiassen, and Straker Citation2019).
The u-shaped phenomenon has implications for the development of mathematical models to predict and design time aspects of work, such as endurance time and recovery needs (see Dode et al. Citation2016 and Givi, Jaber, and Neumann Citation2015 for emerging modelling approaches to integrate fatigue-recovery patterns into engineering models of work systems). As outlined in Rose, Beauchemin, and Neumann (Citation2018), there are several models that estimate aspects of time, but many existing models are often inadequate to simulate the recovery process. Further, existing models may not consider the apparent task-dependency of fatigue, including the effect of load level on fatigue (Ma et al. Citation2011), and these models may not be indiscriminately transferable to a given work scenario (Neumann, Motiwala, and Rose Citation2020). This is an issue for both model development and using these models in practice.
6. Conclusion
Rose et al. (Citation2014) observed a u-shaped relationship between load level and fatigue and recovery, where a moderate level of force resulted in relatively lower perceived fatigue and shorter recovery time. After re-examination of the Rose et al. data, the observed u-shaped pattern does not appear to be an experimental artefact, but rather a real phenomenon. Supported by the re-examination, unexpected fatigue effect at low and moderate forces may have led to the u-shaped pattern. Several possible mechanisms that could contribute to this effect were identified, however, no single mechanism adequately explains the entirety of the u-shaped relationship. Rather, potential mechanisms may interact in complex ways. For instance, at low loads, a longer than expected endurance time due to postural shifting and imperceptibility of fatigue, and higher overall muscle demand, due to less joint stability and precision requirements, may increase the magnitude of perceived fatigue. Thus, many research questions remain, and are outlined in this paper, including the need for additional studies on the effect of force level on fatigue to support or disprove the u-shaped relationship; studies on the relationship between fatigue and recovery; and studies on the relationship between load level, fatigue, and outcomes, including performance and health effects.
Understanding the effects of load level on fatigue and recovery have significant implications for reducing the risk of adverse health outcomes, including MSD. A better understanding of the load level, fatigue, and recovery relationship may support the development of mathematical prediction models that consider fatigue-task dependency, and through the development of targeted interventions, such as designing jobs and tasks that optimise work-recovery patterns or increasing exposure variation at work. An improved understanding of fatigue-recovery responses could contribute to the development of sustainable jobs in the future.
Supplemental Material
Download MS Word (266.7 KB)Disclosure statement
No potential conflict of interest was reported by the author(s).
Additional information
Funding
References
- Adamo, D.E., M. Khodaee, S. Barringer, P.W. Johnson, and B.J. Martin. 2009. “Low Mean Level Sustained and Intermittent Grip Exertions: Influence of Age on Fatigue and Recovery.” Ergonomics 52 (10): 1287–1297. doi:10.1080/00140130902984935.
- Adamo, D.E., B.J. Martin, and P.W. Johnson. 2002. “Vibration-Induced Muscle Fatigue, a Possible Contribution to Musculoskeletal Injury.” European Journal of Applied Physiology 88 (1–2): 134–140. doi:10.1007/s00421-002-0660-y.
- Alabdulkarim, S., S. Kim, and M.A. Nussbaum. 2019. “Effects of Exoskeleton Design and Precision Requirements on Physical Demands and Quality in a Simulated Overhead Drilling Tasks.” Applied Ergonomics 80: 136–145. doi:10.1016/j.apergo.2019.05.014.
- Allen, D.G., G.D. Lamb, and H. Westerblad. 2008. “Skeletal Muscle Fatigue: Cellular Mechanisms.” Physiological Reviews 88 (1): 287–332. doi:10.1152/physrev.00015.2007.
- Amann, M. 2012. “Significance of Group III and IV Muscle Afferents for the Endurance Exercising Human.” Clinical and Experimental Pharmacology and Physiology 39 (9): 831–835. doi:10.1111/j.1440-1681.2012.05681.x.
- Armstrong, T.J., P. Buckle, L.J. Fine, M. Hagberg, B. Jonsson, A. Kilbom, I.A.A. Kuorinka, B.A. Silverstein, G. Sjogaard, and E.R.A. Viikari-Juntura. 1993. “A Conceptual Model for Work-Related Neck and Upper-Limb Musculoskeletal Disorders.” Scandinavian Journal of Work, Environment & Health 19 (2): 73–84. doi:10.5271/sjweh.1494.
- Behm, D.G. 2004. “Force Maintenance with Submaximal Fatiguing Contractions.” Canadian Journal of Applied Physiology 29 (3): 274–290. doi:10.1139/h04-019.
- Bigland-Ritchie, B., D.A. Jones, and J.J. Woods. 1979. “Excitation Frequency and Muscle Fatigue: Electrical Responses during Human Voluntary and Stimulated Contractions.” Experimental Neurology 64 (2): 414–427. doi:10.1016/0014-4886(79)90280-2.
- Bigliassi, M. 2015. “Corollary Discharges and Fatigue-Related Symptoms: The Role of Attentional Focus.” Frontiers in Psychology 6: 1002. doi:10.3389/fpsyg.2015.01002.
- Booth, A. 2008. “Unpacking Your Literature Search Toolbox: On Search Styles and Tactics.” Health Information and Libraries Journal 25 (4): 313–317. doi:10.1111/j.1471-1842.2008.00825.x.
- Bosch, T., S.E. Mathiassen, B. Visser, M.P. de Looze, and J.H. van Dieën. 2011. “The Effect of Work Pace on Workload, Motor Variability and Fatigue during Simulated Light Assembly Work.” Ergonomics 54 (2): 154–168. doi:10.1080/00140139.2010.538723.
- Boyas, S., and A. Guével. 2011. “Neuromuscular Fatigue in Healthy Muscle: Underlying Factors and Adaptation Mechanisms.” Annals of Physical and Rehabilitation Medicine 54 (2): 88–108. doi:10.1016/j.rehab.2011.01.001.
- Broxterman, R.M., J.C. Craig, J.R. Smith, S.L. Wilcox, C. Jia, S. Warren, and T.J. Barstow. 2015. “Influence of Blood Flow Occlusion on the Development of Peripheral and Central Fatigue during Small Muscle Mass Handgrip Exercise.” The Journal of Physiology 593 (17): 4043–4054. doi:10.1113/JP270424.
- Buckley, R.J., W.S. Helton, C.R.H. Innes, J.C. Dalrymple-Alford, and R.D. Jones. 2016. “Attention Lapses and Behavioural Microsleeps during Tracking, Psychomotor Vigilance, and Dual Tasks.” Consciousness and Cognition 45: 174–183. doi:10.1016/j.concog.2016.09.002.
- Byström, S., and C. Fransson-Hall. 1994. “Acceptability of Intermittent Handgrip Contractions Based on Physiological Response.” Human Factors: The Journal of the Human Factors and Ergonomics Society 36 (1): 158–171. doi:10.1177/001872089403600110.
- Byström, S., and G. Sjøgaard. 1991. “Potassium Homeostasis during and following Exhaustive Submaximal Static Handgrip Contractions.” Acta Physiologica Scandinavica 142 (1): 59–66. doi:10.1111/j.1748-1716.1991.tb09128.x.
- Carpentier, A., J. Duchateau, and K. Hainaut. 2001. “Motor Unit Behaviour and Contractile Changes during Fatigue in the Human First Dorsal Interosseus.” The Journal of Physiology 534 (Pt 3): 903–912.
- Cheng, H.G., and M.R. Phillips. 2014. “Secondary Analysis of Existing Data: Opportunities and Implementation.” Shanghai Archives of Psychiatry 26 (6): 371–375. doi:10.11919/j.issn.1002-0829.214171.
- Conwit, A., D. Stashuk, B. Tracy, M. McHugh, W.F. Brown, and E.J. Metter. 1999. “The Relationship of Motor Unit Size, Firing Rate and Force.” Clinical Neurophysiology 110 (7): 1270–1275. doi:10.1016/s1388-2457(99)00054-1.
- Deeb, J.M., C.G. Drury, and D.R. Pendergast. 1992. “An Exponential Model of Isometric Muscular Fatigue as a Function of Age and Muscle Group.” Ergonomics 35 (7–8): 899–918. doi:10.1080/00140139208967370.
- Demerouti, E., A.B. Bakker, S.A.E. Geurts, and T.W. Taris. 2009. “Daily Recovery from Work-Related Effort during Non-Work Time.” In Research in Occupational Stress and Well-Being: Vol 7. Current Perspectives on Job-Stress Recovery, edited by S. Sonnentag, P.L. Perrewé, and D.C. Ganster, 85–123. JAI Press; Emerald Group Publishing.
- De Raeve, L., R.M. Vasse, N.W H. Jansen, P.A. van den Brandt, and I. Kant. 2007. “Mental Health Effects of Changes in Psychosocial Work Characteristics: A Prospective Cohort Study.” Journal of Occupational and Environmental Medicine 49 (8): 890–899. doi:10.1097/JOM.0b013e31811eadd3.
- Dode, P., M. Greig, S. Zolfaghari, and W.P. Neumann. 2016. “Integrating Human Factors into Discrete Event Simulation: A Proactive Approach to Simultaneously Design for System Performance and Employees’ Well Being.” International Journal of Production Research 54 (10): 3105–3117. doi:10.1080/00207543.2016.1166287.
- Dundon, J.M., J. Cirillo, and J.G. Semmler. 2008. “Low-Frequency Fatigue and Neuromuscular Performance after Exercise-Induced Damage to Elbow Flexor Muscles.” Journal of Applied Physiology 105 (4): 1146–1155. doi:10.1152/japplphysiol.01339.2007.
- Edwards, R.H.T. 1978. “Physiological Analysis of Skeletal Muscle Weakness and Fatigue.” Clinical Science and Molecular Medicine 54 (5): 463–470. doi:10.1042/cs0540463.
- Edwards, R.H.T., D.K. Hill, D.A. Jones, and P.A. Merton. 1977. “Fatigue of Long Duration in Human Skeletal Muscle after Exercise.” The Journal of Physiology 272 (3): 769–778. doi:10.1113/jphysiol.1977.sp012072.
- Engelhoven, L.V., N. Poon, H. Kazerooni, A. Barr, D. Rempel, and C. Harris-Adamson. 2018. “Evaluation of an Adjustable Support Shoulder Exoskeleton on Static and Dynamic Overhead Tasks.” Proceedings of the Human Factors and Ergonomics Society 2018 Annual Meeting, Vol. 62. doi:10.1177/1541931218621184.
- Enoka, R.M., and D.G. Stuart. 1992. “Neurobiology of Muscle Fatigue.” Journal of Applied Physiology 72 (5): 1631–1648. doi:10.1152/jappl.1992.72.5.1631.
- Fischer, S.L., R.P. Wells, and C.R. Dickerson. 2009. “The Effect of Added Degrees of Freedom and Handle Type on Upper Limb Muscle Activity during Simulated Hand Tool Use.” Ergonomics 52 (1): 25–35. doi:10.1080/00140130802479895.
- Gallagher, S., and J.R. Heberger. 2013. “Examining the Interaction of Force and Repetition on Musculoskeletal Disorder Risk: A Systematic Literature Review.” Human Factors: The Journal of the Human Factors and Ergonomics Society 55 (1): 108–124. doi:10.1177/0018720812449648.
- Givi, Z.S., M.Y. Jaber, and W.P. Neumann. 2015. “Production Planning in DRC Systems considering Worker Performance.” Computers & Industrial Engineering 87: 317–327. doi:10.1016/j.cie.2015.05.005.
- Hammer, S.M., A.M. Alexander, K.D. Didier, and T.J. Barstow. 2020. “Influence of Blood Flow Occlusion on Muscular Recruitment and Fatigue during Maximal-Effort Small Muscle-Mass Exercise.” The Journal of Physiology 598 (19): 4293–4306. doi:10.1113/JP279925.
- Hamrol, Adam, Dagmara Kowalik, and Agnieszka Kujawińsk. 2011. “Impact of Selected Work Condition Factors on Quality of Manual Assembly Process.” Human Factors and Ergonomics in Manufacturing & Service Industries 21 (2): 156–163. doi:10.1002/hfm.20233.
- Hawkins, D., and M.L. Hull. 1993. “Muscle Force as Affected by Fatigue: Mathematical Model and Experimental Verification.” Journal of Biomechanics 26 (9): 1117–1128. doi:10.1016/S0021-9290(05)80010-7.
- Henneman, E. 1957. “Relation between Size of Neurons and Their Susceptibility to Discharge.” Science 126 (3287): 1345–1347. doi:10.1126/science.126.3287.1345.
- Holtermann, A., S.E. Mathiassen, and L. Straker. 2019. “Promoting Health and Physical Capacity during Productive Work: The Goldilocks Principle.” Scandinavian Journal of Work, Environment & Health 45 (1): 90–97. doi:10.5271/sjweh.3754.
- Jansen, N.W.H., I.J. Kant, and P.A. van den Brandt. 2002. “Need for Recovery in the Working Population: Description and Associations with Fatigue and Psychological Distress.” International Journal of Behavioral Medicine 9 (4): 322–340. doi:10.1207/s15327558ijbm0904_03.
- Jones, D.A., D.J. Newham, and C. Torgan. 1989. “Mechanical Influences on Long-Lasting Human Muscle Fatigue and Delayed-Onset Pain.” The Journal of Physiology 412 (1): 415–427. doi:10.1113/jphysiol.1989.sp017624.
- Kaufman, M.P., and K.J. Rybicki. 1987. “Discharge Properties of Group III and IV Muscle Afferents: their Responses to Mechanical and Metabolic Stimuli.” Circulation Research 61: I60–I65.
- Klawitter, P.F., and T.L. Clanton. 2004. “Tension-Time Index, Fatigue, and Energetics in Isolated Rat Diaphragm: A New Experimental Model.” Journal of Applied Physiology 96 (1): 89–95. doi:10.1152/japplphysiol.00237.2003.
- Kolus, A., R.P. Wells, and W.P. Neumann. 2018. “Production Quality and Human Factors Engineering: A Systematic Review and Theoretical Framework.” Applied Ergonomics 73: 55–89. doi:10.1016/j.apergo.2018.05.010.
- Kuhtz-Buschbeck, J.P., H.H. Ehrsson, and H. Forssberg. 2001. “Human Brain Activity in the Control of Fine Static Precision Grip Forces: An fMRI Study.” European Journal of Neuroscience 14 (2): 382–390. doi:10.1046/j.0953-816x.2001.01639.x.
- Lohse, K.R., and D.E. Sherwood. 2011. “Defining the Focus of Attention: Effects of Attention on Perceived Exertion and Fatigue.” Frontiers in Psychology 2: 332. doi:10.3389/fpsyg.2011.00332.
- Ma, L., D. Chablat, F. Bennis, W. Zhang, B. Hu, and F. Guillaume. 2011. “A Novel Approach for Determining Fatigue Resistances of Different Muscle Groups in Static Cases.” International Journal of Industrial Ergonomics 41 (1): 10–18. doi:10.1016/j.ergon.2010.11.005.
- MacIntosh, B.R., and M.R.S. Shahi. 2011. “A Peripheral Governor Regulates Muscle Contraction.” Applied Physiology, Nutrition, and Metabolism 36 (1): 1–11. doi:10.1139/H10-073.
- Mathiassen, S.E. 2006. “Diversity and Variation in Biomechanical Exposure: What Is It, and Why Would We Like to Know?” Applied Ergonomics 37 (4): 419–427. doi:10.1016/j.apergo.2006.04.006.
- Mathiassen, S.E., and J. Winkel. 1991. “Quantifying Variation in Physical Load Using Exposure-vs-Time Data.” Ergonomics 34 (12): 1455–1468. doi:10.1080/00140139108964889.
- McKenna, M.J., J. Bangsbo, and J-M. Renaud. 2008. “Muscle K+, Na+, and Cl− Disturbances and Na+-K+ Pump Inactivation: Implications for Fatigue.” Journal of Applied Physiology 104 (1): 288–295. doi:10.1152/japplphysiol.01037.2007.
- Mehta, R.K., and M.J. Agnew. 2012. “Influence of Mental Workload on Muscle Endurance, Fatigue, and Recovery during Intermittent Static Work.” European Journal of Applied Physiology 112 (8): 2891–2902. doi:10.1007/s00421-011-2264-x.
- Mehta, R.K., M.A. Nussbaum, and M.J. Agnew. 2012. “Muscle- and Task-Dependent Responses to Concurrent Physical and Mental Workload during Intermittent Static Work.” Ergonomics 55 (10): 1166–1179. doi:10.1080/00140139.2012.703695.
- Mizuno, K., and Y. Watanabe. 2008. “Utility of an Advanced Trail Making Test as a Neuropsychological Tool for an Objective Evaluation of Work Efficiency during Mental Fatigue.”. In Fatigue Science for Human Health, edited by Y. Watanabe, B. Evengård, B.H. Natelson, L.A. Jason, and H. Kuratsune. Tokyo: Springer. doi:10.1007/978-4-431-73464-2_4.
- Moussavi, R.S., S.L. Lehman, and R.G. Miller. 1992. “Dantrolene Sodium and Fatigue of Long Duration.” Muscle & Nerve 15 (3): 384–389. doi:10.1002/mus.880150319.
- Neumann, W.P., M. Motiwala, and L.M. Rose. 2020. “A Comparison of Work-Rest Models Using a “Breakpoint” Analysis Raises Questions.” IISE Transactions on Occupational Ergonomics and Human Factors 8 (4): 187–194. doi:10.1080/24725838.2020.1857315.
- Pageaux, B. 2014. “The Psychobiological Model of Endurance Performance: An Effort-Based Decision-Making Theory to Explain Self-Paced Endurance Performance.” Sports Medicine 44 (9): 1319–1320. doi:10.1007/s40279-014-0198-2.
- Potvin, J.R., and A.J. Fuglevand. 2017. “A Motor Unit-Based Model of Muscle Fatigue.” PLOS Computational Biology 13 (6): e1005581. doi:10.1371/journal.pcbi.1005581.
- Ranganathan, P., C.S. Pramesh, and R. Aggarwal. 2017. “Common Pitfalls in Statistical Analysis: Logistic Regression.” Perspectives in Clinical Research 8 (3): 148–151.
- Rohmert, W., M. Wangenheim, J. Mainzer, P. Zipp, and W. Lesser. 1986. “A Study Stressing the Need for a Static Postural Force Model for Work Analysis.” Ergonomics 29 (10): 1235–1249.
- Rose, L.M., W.P. Neumann, G.M. Hägg, and G. Kenttä. 2014. “Fatigue and Recovery during and after Static Loading.” Ergonomics 57 (11): 1696–1710. doi:10.1080/00140139.2014.952347.
- Rose, L.M., C.A.A. Beauchemin, and W.P. Neumann. 2018. “Modelling Endurance and Resumption Times for Repetitive One-Hand Pushing.” Ergonomics 61 (7): 891–901. doi:10.1080/00140139.2018.1427282.
- Saito, K. 1999. “Measurement of Fatigue in Industries.” Industrial Health 37 (2): 134–142. doi:10.2486/indhealth.37.134.
- Sjøgaard, Gisela, Gabrielle Savard, and Carsten Juel. 1988. “Muscle Blood Flow during Isometric Activity and Its Relation to Muscle Fatigue.” European Journal of Applied Physiology and Occupational Physiology 57 (3): 327–335. doi:10.1007/BF00635992.
- Sjøgaard, G. 1996. “Potassium and Fatigue: The Pros and Cons.” Acta Physiologica Scandinavica 156 (3): 257–264. doi:10.1046/j.1365-201X.1996.207000.x.
- Sonnentag, S., and F.R.H. Zijlstra. 2006. “Job Characteristics and off-Job Activities as Predictors of Need for Recovery, Well-Being, and Fatigue.” The Journal of Applied Psychology 91 (2): 330–350. doi:10.1037/0021-9010.91.2.330.
- Srinivasan, D., and S.E. Mathiassen. 2012. “Motor Variability in Occupational Health and Performance.” Clinical Biomechanics 27 (10): 979–993. doi:10.1016/j.clinbiomech.2012.08.007.
- Visser, B., and J.H. van Dieën. 2006. “Pathophysiology of Upper Extremity Muscle Disorders.” Journal of Electromyography and Kinesiology 16 (1): 1–16. doi:10.1016/j.jelekin.2005.06.005.
- Wells, R., S.E. Mathiassen, L. Medbo, and J. Winkel. 2007. “Time – A Key Issue for Musculoskeletal Health and Manufacturing.” Applied Ergonomics 36 (6): 733–744.
- Westerblad, H., and D.G. Allen. 2002. “Recent Advances in the Understanding of Skeletal Muscle Fatigue.” Current Opinion in Rheumatology 14: 648–652. doi:10.1097/00002281-200211000-00003.
- Westerblad, H., J.D. Bruton, and A. Katz. 2010. “Skeletal Muscle: Energy Metabolism, Fiber Types, Fatigue and Adaptability.” Experimental Cell Research 316 (18): 3093–3099. doi:10.1016/j.yexcr.2010.05.019.
- Westgaard, R.H., and J. Winkel. 1996. “Guidelines for Occupational Musculoskeletal Load as a Basis for Intervention: A Critical Review.” Applied Ergonomics 27 (2): 79–88. doi:10.1016/0003-6870(95)00062-3.
- Wood, D.D., D.L. Fisher, and R.O. Andres. 1997. “Minimizing Fatigue during Repetitive Jobs: Optimal Work-Rest Schedules.” Human Factors: The Journal of the Human Factors and Ergonomics Society 39 (1): 83–101. doi:10.1518/001872097778940678.
- Yung, M., A. Kolus, R.P. Wells, and W.P. Neumann. 2020. “Examining the Fatigue-Quality Relationship in Manufacturing.” Applied Ergonomics 82: 102919. doi:10.1016/j.apergo.2019.102919.
- Yung, M., S.E. Mathiassen, and R.P. Wells. 2012. “Variation of Force Amplitude and Its Effects on Local Fatigue.” European Journal of Applied Physiology 112 (11): 3865–3879. doi:10.1007/s00421-012-2375-z.
- Yung, M., and R.P. Wells. 2017. “Documenting the Temporal Pattern of Fatigue Development.” IISE Transactions on Occupational Ergonomics and Human Factors 5 (3–4): 115–135. doi:10.1080/24725838.2017.1373714.