
Abstract
This study investigates how cognitive performance is affected by the combination of two stressors that are operationally relevant for helicopter pilots: heat load and hypobaric hypoxia. Fifteen participants were exposed to (1) no stressors, (2) heat load, (3) hypobaric hypoxia, and (4) combined heat load and hypobaric hypoxia. Hypobaric hypoxia (13,000 ft) was achieved in a hypobaric chamber. Heat load was induced by increasing ambient temperature to ∼28 °C. Cognitive performance was measured using two multitasks, and a vigilance task. Subjective and physiological data (oxygen saturation, heart rate, core- and skin temperature) were also collected. Mainly heat load caused cognitive performance decline. This can be explained by high subjective heat load and increased skin temperature, which takes away cognitive resources from the tasks. Only the arithmetic subtask was sensitive to hypobaric hypoxia, whereby hypobaric hypoxia caused a further performance decline in addition to the decline caused by heat load.
Practitioner summary: Little is known about how multiple environmental stressors interact. This study investigates the combined effects of heat load and hypobaric hypoxia on cognitive performance. An additive effect of heat load and hypobaric hypoxia was found on a arithmetic task, which may be attributed to independent underlying mechanisms.
1. Introduction
People are being exposed to an increasing amount of information, continuously drawing on their cognitive abilities. This information load specifically affects a range of professionals who must perform their tasks in the presence of environmental stressors, like military pilots who may be subjected to heat, cold, noise, and/or reduced oxygen levels. It is known that each of these stressors alone can degrade cognitive functioning and information processing (Martin et al. Citation2019), but little is known about the effects when one is being exposed to multiple stressors. Lloyd and Havenith (Citation2016) presented a theoretical framework consisting of three different ways of how multiple stressors may interact: additive, synergistic, and antagonistic. With additive interaction, the authors mean that the combined effect of two individual stressors (A and B) equals the sum of the individual effects. This implies that there is no interaction in a statistical sense as both stressors do not influence each other’s effect. Synergistic interaction indicates a combined effect that is more than the sum of A and B, while antagonistic interaction indicates an effect that is less than the sum of both individual effects. These types of interactions can be further divided into subtypes, dependent on the degree to which the combined effect becomes more or less than the sum of A and B (Lloyd and Havenith Citation2016; Alais and Burr, Citation2003; Burr and Alais, Citation2006), or whether the two stressors individually have an effect in the same or opposite direction on performance (Piggott, Townsend, and Matthaei Citation2015).
Whether or not stressors share the same mechanism mediating their impact on performance affects the type of interaction (Lloyd and Havenith Citation2016). Theoretically, this implies that there is a greater possibility that stressors influence each other when they share the same physiological mechanism, resulting in antagonistic or synergistic interaction effects. For example, the presence of noise bursts has been shown to reduce the negative effects of sleep deprivation on cognitive performance, representative of an antagonistic interaction (Corcoran Citation1962). Broadbent (Citation1963) explained this finding by assuming that noise bursts and sleep deprivation share the mechanism ‘arousal’, where noise bursts increase the level of arousal, and sleep deprivation leads to a decrease in the level of arousal. On the other hand, additive effects result from two stressors with independent mechanisms that don’t affect each other.
In the current study, we investigate how cognitive performance is affected by the combination of two stressors that are operationally relevant for helicopter pilots, i.e. heat load and hypobaric hypoxia. As will be explained below, we assume that these stressors affect cognitive performance by a shared mechanism. Heat load occurs during military operations in warm climates. Already before takeoff, the temperature can rise considerably in the cockpit, while the pilots may also have to deal with solar radiation to the head and body throughout the flight (Froom et al. Citation1993; Sihver et al. Citation2015). Hypobaric hypoxia may arise when the mission requires the aircrew to fly at an altitude between 10,000 and 13,000 feet (3048–4000 m), without the use of supplemental oxygen. At these altitudes, the reduced barometric pressure causes a decrease of partial pressure of oxygen (pO2) in ambient air (Muthuraju and Pati Citation2014), resulting in a fall of arterial blood O2 saturation (SaO2) and deprived oxygen supply to the brain (Moore, Charles, and Julian Citation2011).
Heat load itself can degrade cognitive performance. Different studies found cognitive performance decline on tasks that require executive functioning (Faerevik and Reinertsen Citation2003; Gaoua et al. Citation2011), while reaction tasks were often unaffected (Martin et al. Citation2019). Heat load activates thermoregulatory mechanisms of the body, such as sweating and redistributing body heat to the skin by blood flow, which aim to protect the body against overheating and compensate for excess heat gain. The most profound cognitive performance decline is shown when body core temperature increases above 38.5 °C (Piil et al. Citation2021). However, even without an increase in body core temperature, the thermoregulatory mechanism itself comes at a cost that can have consequences for cognitive performance (Hancock and Vasmatzidis Citation2003; Martin et al. Citation2019). For instance, one hypothesis is that the increased blood flow to the skin reduces the capacity to provide blood to the brain, thereby affecting cognitive performance (Brothers et al. Citation2009; Wilson et al. Citation2006).
Hypobaric hypoxia is also known to affect cognitive performance due to deprived oxygen supply to the brain (Brothers et al. Citation2009; Martin et al. Citation2019; McMorris et al. Citation2017; Petrassi et al. Citation2012). Studies found impaired cognitive performance on decision-making tasks at altitudes between 6500 and 12,000 ft (Petrassi et al. Citation2012), while performance decline on reaction time tasks was only observed at higher altitudes, e.g. between 18,000 and 25,000 (Shaw, Cabre, and Gant Citation2021).
Exposure to a combination of stressors and their acute effects on cognitive performance is innovative compared to other studies. Previous studies examining the individual and combined effects of heat load and hypoxia focussed on acclimatisation protocols (Gibson et al. Citation2017) in relation to physical performance (Aldous et al. Citation2015; Bradbury et al. Citation2019; Girard and Racinais Citation2014; Lloyd et al. Citation2016; Van Cutsem et al. Citation2015), but rarely (<5 papers) on cognitive performance (Gibbons et al., 2020; Van Cutsem et al. Citation2015). Although via different physiological routes (i.e. redistribution of blood, and reduced oxygen saturation of the blood, respectively), heat load and hypobaric hypoxia share the ‘mechanism’ of reduced supply of oxygenated blood to the brain. Because of this, we hypothesise that heat load and hypobaric hypoxia will have a synergistic interaction (AB > A + B). This is only expected for complex tasks, as these are mainly affected at altitudes above 13,000 ft and/or during heat load.
We induced heat load by heaters to increase air temperature, radiant heat from an artificial sun, and by wearing the protective clothing and helmet of aircrew. Hypobaric hypoxia was induced in a hypobaric chamber at a simulated altitude of 13,000 ft. Besides examining the effects of these two stressors on cognitive performance, we collected subjective and physiological data to get insight into underlying mechanisms. Core- and skin temperature were recorded as they reflect thermoregulatory mechanisms and experienced discomfort, while pulsed oxygen saturation (SpO2) was used to reflect the hypoxic state. Subjective thermal discomfort was collected through a questionnaire.
2. Methods
2.1. Participants
Sixteen participants took part in this study, of whom fifteen completed the whole study. They were recruited through the TNO participant pool. Exclusion criteria were: smoking, drugs use in the last three months, hypersensitivity to air sickness, and being at an altitude above 6500 ft in the last three months for longer than a week. An approval for this study was granted by an accredited medical research ethics committee (MREC Brabant, reference number: P2007). All participants gave written informed consent. Participants were aged between 22 and 35 years (mean age 25.4 years) and seven of them were male.
All participants were in good health based on a screening by an aeromedical physician. Participants came on four separate test days. Participants were instructed to refrain from alcoholic beverages 24 h before the test days.
2.2. Materials
2.2.1. Cognitive task performance
Aircrew is expected to be competent both in monitoring skills, like monitoring the aircraft’s flight path and systems, as well as engaging in various cognitive challenging tasks at the same time. To measure this wide range of cognitive skills, the relevant cognitive performance measures included both multi-tasking tasks as well as simple vigilance tasks.
2.2.1.1. Multi-Attribute Task Battery (MATB-II)
The MATB-II is a computer-based task developed by NASA/Langley Research Centre designed to evaluate workload and cognitive performance (Arnegard and Comstock Citation1991). It provides multiple tasks that must be performed simultaneously. The tasks include system monitoring (monitoring gauges and warning lights), compensatory tracking, resource management (maintaining fuel levels in tanks by switching pumps on and off while dealing with pre-programmed pump failures), and Air Traffic Control communication elements. These tasks are analogous to activities performed by aircrew in flight (Santiago-Espada et al. Citation2011). For this study a total of four different parallel versions of a MATB-II script were programmed, each having a duration of 10 min. Performance measures of the system monitoring task consisted of number of lights that were successfully turned on and off and mean reaction time (RT). The root mean square (RMS) tracking error is used as performance measure for the tracking task, and the mean absolute deviation from target fuel level for the resource management task. Performance measures for the communication task consisted of the percentage successful radio and frequency tunings.
2.2.1.2. SYNWIN
The SYNWIN is also a computer-based task with multiple tasks to be performed simultaneously (Elsmore, Citation1994). It has been used in studies of human-computer interaction and sustained operations in cockpit setting (Hambrick et al. Citation2010), and also in hypobaric hypoxia conditions (Beer et al. Citation2017). It represents different cognitive skills required in complex task situations. The SYNWIN includes four tasks: a simple memory task, an arithmetic computation task, a visual monitoring task, and an auditory monitoring task. Performance measures included a SYNWIN Composite Score and measures determining the accuracy, reliability, and speed of responses for each individual cognitive task. The Composite Score represents performance across all four tasks by including points earned minus penalties for incorrect responses, namely incorrect or missed identification in the memory task, incorrect calculation, allowing the fuel gauge to expire, and auditory false alarms or misses. Performance measures for the visual monitoring task consisted of total earned points and lapse rate (number of time participant allowed gauge to reach zero divided by number of sampling periods). For the auditory monitoring task percentage correct is used as performance measure. The total duration of this task was 10 min.
2.2.1.3. Vigilance and tracking
The Vigilance and Tracking (VigTrack) is a dual-task measuring vigilance performance under the continuous load of a compensatory tracking task. The test has been used in various studies by Valk and Simons (Citation2009), Valk et al. (Citation1997), and Vrijkotte et al. (Citation2009), and appeared to be sensitive for measuring vigilance and alertness. The task was performed on a computer screen. During the tracking task, participants had to steer a blue dot using a joystick, so that it is kept below a red dot in the centre of the display. The blue dot is programmed to move continuously from the centre of the display. While tracking, participants had to perform the vigilance task. Inside the red dot, a black square alternated with a diamond, once per second. At random intervals, a hexagon was presented, when this was the case participants had to press an additional key on the joystick. The duration of this test was 10 min and performance measures included RT, root mean square tracking error, and percentage omissions.
2.2.1.4. Psychomotor vigilance task
The psychomotor vigilance task (PVT) is a task that measures how fast participants respond to a visual stimulus and is used to assess vigilance (Basner and Dinges Citation2011). Normally this task is used as a primary attention task. In this study, it was used as a secondary attention task in addition to the MATB-II and SYNWIN. Participants were instructed to monitor a second computer screen located in their peripheral field of view, and press the response button with their foot as soon as a red stimulus appeared. The inter-stimulus interval, defined as the period between the last response and the appearance of the next stimulus, varied randomly between 2 and 10 s. Performance measure includes RT. As participants were instructed to give priority to the primary task, the performance measures of the PVT can be used as an objective measure of mental load.
2.2.2. Subjective ratings
Participants indicated their perceived thermal comfort and temperature sensation during baseline, every 10 min during the pre-heating phase (starts at T = −60 min), and immediately after each cognitive task (starts at T = 15 min) International Organization for Standardization (ISO Citation2009: 10551 2001). See for a timeline of the protocol. Thermal discomfort was assessed using a 5-point paper scale ranging from comfortable (0) to uncomfortable (4). The thermal sensation was assessed on a 9-point paper scale ranging from very cold (−4) to very hot (+4). Participants were also asked to rate any possible hypoxia symptoms (e.g. warmth, cold, nausea, tunnel vision, fatigue, etc.) from 0 (none) to 7 (extreme) during baseline assessment (T = −60) and at the beginning (T = 0) and end of the altitude phase (T = 45).
2.2.3. Physiological monitoring
2.2.3.1. Oxygen saturation and heart rate
Oxygen saturation (SpO2) and heart rate (HR) were measured using the Nonin WristOx2® Model 3150, configured with the 8000 R Reflectance Pulse Oximetry Sensor placed on the forehead (SpO2 accuracy range of 70–100% and pulse rate accuracy range of 40–240 beats per minute). Data was transmitted via Bluetooth to a computer, enabling the experimental leader to monitor SpO2 and HR.
SpO2 is a measurement of oxygen saturation level in the blood and declines with increasing altitudes. This measure is both used as a manipulation check of hypoxia as well as monitoring the well-being of the participants. HR reflects cardiovascular responses and is expected to increase with higher altitudes, temperatures, and/or workload.
2.2.3.2. Core temperature
The gastrointestinal temperature was used as a measure of body core temperature (TC) with an ingestible capsule (e-Celsius Performance, BodyCap, Caen, France, 17.7 × 8.9 mm) (Bongers et al. Citation2018; Notley, Meade, and Kenny Citation2021). Participants ingested the capsule with water at least 60 min before the onset of the pre-heating phase. Participants were not allowed to drink or eat after ingestion of the pill for the duration of the experiment. TC is measured to estimate the magnitude of thermal strain that is caused by the thermal stressor. In case of an uncompensable heat load, TC will rise regardless of the thermoregulatory responses. Conversely, a compensable heat load may be concurrent with an increase in TC yet it stabilises when excess heat gain is compensated by thermoregulatory heat loss mechanisms. It may even be so that a compensable heat load elicits strong thermoregulatory responses that prevent TC from increasing above baseline. A model simulation with Organization For Standardization (Citation2004a) ISO7933 Predicted Heat Strain indicated that in this study a small to moderate increase in body core temperature is expected (between 37 and 38 °C), with the prime uncertain factor being the exact insulation of the participant’s clothing ensemble (estimated between 1.0 and 1.2 clo).
2.2.3.3. Mean skin temperature
Mean skin temperature (TSK) was measured at four positions according to Organization For Standardization (Citation2004b) ISO 9886; at the neck, scapula, left hand, and right shin. TSK is expected to increase during the (pre-)heating phases (1) due to reduced convective heat loss from the skin surface as skin to air temperature gradient decreases and (2) increased vasodilation associated heat transport to skin tissue. In addition, skin temperature on the left forearm and left fingertip were measured to determine the forearm-fingertip gradient (TFOREARM-FINGER) which is the difference between skin temperature on the forearm and fingertip (House and Tipton Citation2002). When this gradient is positive, i.e. higher forearm skin temperature compared to finger skin, this indicates cutaneous vasoconstriction (Bräuer Citation2018) and a decreased gradient indicates a peripheral vasodilation (Keramidas et al. Citation2013). Sensors were fixed with Fixomull plasters, which are breathable and let through sweat.
Mean body temperature (MBT) was estimated from core- and mean skin temperature with a formula proposed by Burton (1935): (TC * .64) + (TSK * .36).
2.2.4. Altitude
Participants were exposed to hypobaric hypoxia (starting at T = 0) in a hypobaric chamber at the Centre for Man in Aviation (CML) in Soesterberg, with a simulated altitude of 13,000 ft (3962 m). The air pressure was reduced in such a way that we ascend to an altitude of 1000 ft per minute. This altitude was chosen as helicopter aircrew are allowed to fly at this altitude for a maximum of 30 min. This chamber is normally used to simulate the effects of hypoxia at high altitudes for training pilots and aeromedical research.
2.2.5. Thermal environment
Heat load was induced by radiant heat from an artificial sun (infrared halogen lamp, 13195X/98, 1000 W, 235 V REFL UNP) and by wearing a Nomex flight suit, vests, and helmet. The air temperature was increased using one electro heater of 400 V–9 kW. After the first 60 min in the pre-heating phase, only the heat lamps provided the heat source (starting at T = 0, ‘Altitude’). Participants were not acclimatised to heat before the test days. Acclimatisation to heat load results in various changes in physiological responses to cope with warm climates (e.g. Périard, Racinais, and Sawka Citation2015).
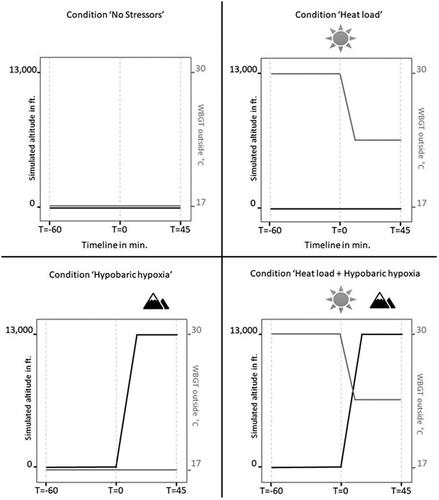
shows the imposed air temperature, relative humidity, and globe temperature for each condition. The Wet Bulb Globe Temperature (WBGT) outside increased with heat load conditions to ∼28 °C. The temperature for the heat load + hypobaric hypoxia condition decreased during the altitude phase from 27.36 to 24.42 °C and for the hypobaric hypoxia condition from 17.51 to 15.39 °C. This was due to lower pressure (thin air) at altitude compared to sea level.
Table 1. Mean air temperature (°C), relative humidity (%), globe temperature (°C), and Wet Bulb Globe Temperature (WBGT) outside (°C) during the conditions and for each phase in the experiment.
2.3. Design
The design was a 2 × 2 within-subjects design: heat load (absent, present) × hypobaric hypoxia (absent, present). Participants were exposed to four conditions in a counterbalanced order. For an overview, see . The exposure to a single condition took 105 min, where the first 60 min simulated the ‘flight preparation/ground procedures part’ (with potential heat load stimuli, from T = −60 to T = 0) and the next 45 min the ‘actual flight’ (with potential altitude stimuli, starts at T = 0).
Figure 1. Overview of the four experimental conditions. Ascending from 0 to 13,000 ft in hypobaric hypoxia conditions took 13 min (1,000 ft per minute). In this figure, the ambient temperature (TA) is an estimated value.
2.3.1. Data analysis
Unfiltered HR and SpO2 signals of the Nonin Pulse Oximetry Sensor were processed in MATLAB (The MathWorks, Inc., Natick, MA, USA) for all phases of the experiment. Values 255 and 127 were removed as these are error values. Mean HR in beats per minute (bpm), mean % SpO2, and mean TC were calculated for the baseline and (potential) altitude phase. Also, a weighted TSK for each phase was calculated with the following formula: .28*Tneck + .28*Tscapula + .16*Thand + .28*Tshin (ISO 9886 2004). In addition, the forearm-fingertip gradient (Tforearm–finger) was calculated, which is the difference between the skin temperature on the forearm and fingertip.
For each condition, a delta cognitive performance score was calculated. This is the performance score on each cognitive task during the (potential) altitude phase minus performance score during baseline assessment on the same test day. Statistical analyses were performed using Statistical Package for the Social Sciences (SPSS 25.0.0) software. All delta cognitive performance scores, physiological- and subjective measures were analysed using Linear Mixed Models. This type of data analysis was selected to account for the nested data structure and the dependency of the repeated observations within an individual during the four test days. Delta cognitive performance scores, physiological- and subjective measures were used as the dependent variables in the linear mixed model analysis, and heat load and hypobaric hypoxia were used as fixed factors. Results are all reported with a significance level of .05.
2.4. Procedures
After online registration for this study, participants received a medical questionnaire that they had to send to the medical doctor. Participants were approved or rejected based on the answers on this medical questionnaire. Upon approval, participants were invited for a screening- and training visit. This visit started with a presentation about the aim and consequences of the study. If the participant agreed to participate in the study, he or she signed the informed consent. After signing, a physical examination, an ECG, pregnancy test, and drug test were done by medical personnel. Next, participants received a training session with the computer tasks. This training session consisted of three times a 5-min practice session of the VigTrack. The individual subtasks of both the SYNWIN and the MATB-II were explained one by one and practiced separately for about 10 min. Afterwards, participants practiced both the SYNWIN and the MATB-II three times for 10 min as multitasks, i.e. all four subtasks of both the SYNWIN and the MATB-II at the same time. In case participants did not achieved a composite score of 1000 or higher on the SYNWIN, the participants had to repeat the 10-min practice session.
There were no more than 14 days between screening- and training visit and the first test day. All four separate test day took about three and a half hours and at least a seven-day washout between test days was held. To avoid confounding circadian influences, participants started a test day at the same hour of the day in the morning or afternoon. Due to practical reasons, four participants were unable to visit all four test days at the same hour of the day.
During conditions without hypobaric hypoxia, at least two experiment leaders were present. In the other conditions with hypobaric hypoxia at least two experiment leaders and one certified physiological training officer were present. The hypobaric chamber was controlled by this trained operator. Also, a medical doctor was available during all conditions, except for the no stressors condition.
The participants were instructed to follow a hydration protocol at home to arrive properly hydrated at the test location for each test day. This protocol included (1) no exercise 24 h before arrival, (2) drink ∼5–7 mL·kg−1 body weight water 4 h before arrival, and (3) drink another ∼3–5 mL·kg−1 body weight water when urine is still dark 2 h before arrival. It is also important that participants ate their breakfast or lunch at home (depending on a morning or afternoon test day). Hypobaric conditions can lead to an expansion of the stomach, which can feel slightly unpleasant when the stomach is empty.
In , the timeline of the protocol during each test day is shown. Upon arrival, the participants received instructions about the test day. At the start of each test day, female participants had to do a pregnancy test, and both male and female participants also had to do a drug test. This was followed by ingesting the capsule with some water for core temperature monitoring. Next, a familiarisation session with the computer tasks was conducted, consisting of three times a 5 min session of the VigTrack, MATB-II, and SYNWIN. Afterwards, the sensors for the SpO2, HR, and skin temperature were attached. Before putting on the Nomex flight suit, vests, and helmet, the participant was allowed to go to the toilet for the last time. These activities together are called the compliance part of the study (see ).
Figure 2. Timeline of the protocol. SpO2: oxygen saturation; HR: heart rate; TSK: mean skin temperature; TC: core temperature. Gradient indicates potential ambient temperature.
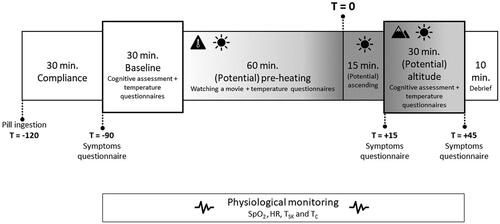
The baseline assessment (starting at T = −90) consisted of the cognitive assessment and subjective questionnaires. The order of the tasks was counterbalanced. Participants had to wear a headphone because some tests consisted of an auditory task and to prevent distraction. During the (potential) pre-heating phase (from T = −60 to T = 0), the participants were just sitting in the (heated, or not heated) environment while watching an episode of Planet Earth. The experimental leader checked the core temperature every 10 min. During the (potential) altitude phase (starting at T = 15) the same assessments were conducted as the assessment during baseline (starting at T = −90).
Stop criteria were determined by a medical doctor aiming to avoid medical complications. The main stop criteria comprised of TC exceeding 38.5 °C, SpO2 indicating a value of ≤65%, and complaints of the participant about dizziness, headache, hyperventilation, nausea, etc. The experiment was designed to minimise physical contact and proximity between the participants and the experimental leaders, taking into consideration COVID-19 regulations.
3. Results
A total of 15 participants completed the whole study. Due to the COVID-19 measures, nine of the 15 participants in this study participated in November 2020, and the other six participants in November 2021. One participant received oxygen during the combined heat load + hypobaric hypoxia condition because of complaints about nausea. Another participant received oxygen during both hypobaric hypoxia and combined heat load + hypobaric hypoxia conditions because of complaints about headache and dizziness. Therefore, missing data on cognitive performance and physiological measures exist for these two participants and were excluded from the dataset. Besides this, the thermal discomfort scale has only been filled in by the six participants of the second batch of participants.
For each measure, the means (M) with standard deviations (SD) in each of the four conditions are listed in . Besides this, an overview of the significant and non-significant results of the univariate multilevel analysis adjusted for repeated measurements within individuals are shown in .
Table 2. Descriptives (mean ± SD) for each measure in each of the four conditions.
Table 3. Overview of significant and non-significant results of heat load, hypobaric hypoxia and the interaction term using univariate multilevel analysis adjusted for repeated measurements within individuals. Fs and degrees of freedom for the fixed effects with corresponding p-values are shown. Grey highlighted statistic implies a significant result.
3.1. Cognitive task performance
Significant main and/or interaction effects of heat load and hypobaric hypoxia on cognitive task performance measures are shown in . In addition, shows an overview of descriptives for each cognitive performance measure. The next paragraphs describe the results of the statistical analysis of these measures (with M referring to mean and SE referring to standard error).
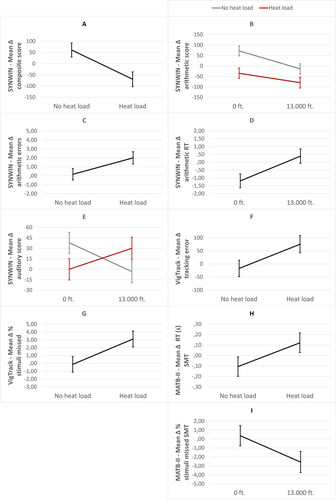
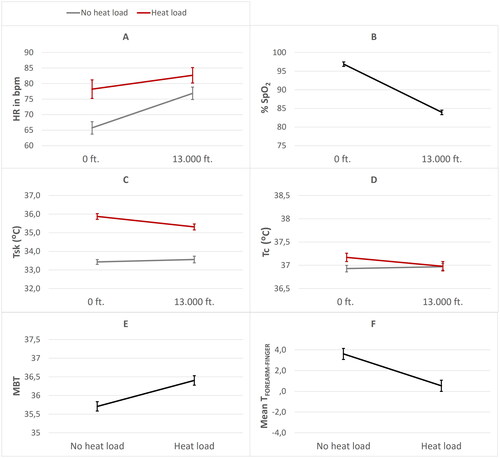
Figure 3. Significant main and/or interaction effects of heat load and hypobaric hypoxia with mean composite (A), mean arithmetic (B), and auditory score (E) on the SYNWIN, mean arithmetic error (C), and arithmetic reaction time (RT) (D) on the SYNWIN, mean tracking error (F) and percentage stimuli missed (G) on the VigTrack, mean reaction time (RT) in seconds (H) and mean percentage stimuli missed (I) on the system monitoring task (SMT) of the MATB-II. Error bars are ±1 SE (standard error).
3.1.1. SYNWIN
The composite score was significantly affected by heat load, with a lower increase of mean score in the presence of heat load (M = −69.46, SE = 33.17) compared to the absence of heat load (M = 61.03, SE = 31.44) (see ). Hypobaric hypoxia did not affect performance on the SYNWIN. Also, the interaction term for heat load and hypobaric hypoxia was not significant. When analysing the individual tasks of the SYNWIN in separate mixed models, the mean score on the arithmetic task was significantly affected by heat load, while a trend for number of errors was found. Decreased mean scores (M = −57.50, SE = 17.98) (see ) and increased number of errors (M = 1.99, SE = .687) (see ) were found in the presence of heat load compared to absence of heat load (scores: M = 29.00, SE = 17.04, errors: M = .167, SE = .637). Mean score and reaction time on the arithmetic task was also affected by hypobaric hypoxia, with decreased mean scores (M = −47.00, SE = 17.69) (see ) and increased reaction time (M = .392, SE = .456) (see ) in the presence of hypobaric hypoxia compared to the absence (scores: M = 18.50, SE = 17.34, reaction time: M = −1.187, SE = .438). The interaction term for heat load and hypobaric hypoxia was not significant for the arithmetic task. Furthermore, the interaction term for heat load and hypobaric hypoxia was significant for the auditory monitoring task. However, pairwise comparisons were not significant (see ).
3.1.2. VigTrack
Tracking error was significantly affected by heat load, with a higher increase of tracking error in the presence of heat load (M = 75.60, SE = 30.61) compared to the absence of heat load (M = −17.17, SE = 30.06) (see ). Tracking error was not affected by hypobaric hypoxia, neither by the interaction term for heat load and hypobaric hypoxia. The same effects were found in percentage stimuli missed. Percentage stimuli missed was significantly affected by heat load, with a higher increase of mean percentage stimuli missed in the presence of heat load (M = 3.10, SE = 1.01) compared to the absence of heat load (M = −.13, SE = .99) (see ). Percentage stimuli missed was not affected by hypobaric hypoxia, neither by the interaction term for heat load and hypobaric hypoxia. With regard to the reaction time, no effects of heat load, hypobaric hypoxia, or the interaction term were found.
3.1.3. MATB-II
Statistical analysis only showed an effect of heat load on reaction time on the system monitoring task, with a higher increase of reaction time in the presence of heat load (M = .122, SE = .09) compared to absence of heat load (M = −.106, SE = .09) (see ). In addition, an effect of hypobaric hypoxia on percentage stimuli missed on the system monitoring task was found, with a higher percentage decrease of stimuli missed in the presence of hypobaric hypoxia (M = −2.57, SE = 1.18) compared to the absence of hypobaric hypoxia (M = .37, SE = 1.13) (see ). However, when looking critically at the small differences in reaction times and percentage stimuli missed, these effects can be attributed to multiple testing. All other non-significant results can be found in .
3.1.3.1. Secondary task performance
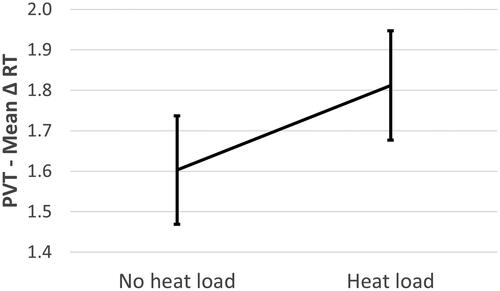
Reaction time on the PVT, as secondary attention task during the SYNWIN, was significantly affected by heat load, with higher mean reaction times in the presence of heat load (M = 1.812, SE = .135) compared to the absence of heat load (M = 1.603, SE = .134). No effect of hypobaric hypoxia was found, neither for the interaction term. The results of heat load affecting reaction time on the PVT are shown in .
Figure 4. Significant effect of heat load on mean reaction time (RT) on the PVT in milliseconds (s). Error bars are ±1 SE (standard error).
3.2. Physiological measures
shows the significant main and/or interaction effects of heat load and hypobaric hypoxia on the physiological measures. In addition, shows an overview of descriptives for each physiological measure. The next paragraphs describe the results of the statistical analysis of these measures.
Figure 5. Significant main and/or interaction effects of heat load and hypobaric hypoxia with mean HR in beats per minute (bpm) (A), percentage SpO2 (B), mean skin temperature (TSK) (C), mean core temperature (TC) (D), mean body temperature (MBT) (E) and mean forearm-fingertip gradient (TFOREARM-FINGER) (F). Error bars are ±1 SE (standard error).
3.2.1. HR
HR was significantly affected by heat load, with a higher mean HR in the presence of heat load (M = 80.43, SE = 2.17) compared to the absence of heat load (M = 71.28, SE = 2.18). HR was also affected by hypobaric hypoxia, with a higher mean HR in the presence of hypobaric hypoxia (M = 79.75, SE = 2.17) compared to the absence of hypobaric hypoxia (M = 71.96, SE = 2.18). In addition, the interaction term for heat load and hypobaric hypoxia was significant (see ). Pairwise comparisons showed that heat load (when present) increased HR more in the absence of hypobaric hypoxia.
3.2.2. % SpO2
% SpO2 was not affected by heat load. Hypobaric hypoxia significantly affected % SpO2, with a lower mean % SpO2 in the presence of hypobaric hypoxia (M = 83.93, SE = .59) compared to the absence of hypobaric hypoxia (M = 96.87, SE = .60) (see ). Furthermore, the interaction term for heat load and hypobaric hypoxia was not significant.
3.2.3. Thermoregulatory responses
TSK was significantly affected by heat load, with a higher mean TSK in the presence of heat load (M = 35.55, SE = .13) compared to the absence of heat load (M = 33.50, SE = .13). TSK was not affected by hypobaric hypoxia. However, the interaction term for heat load and hypobaric hypoxia on TSK was significant, where the pairwise comparisons showed that heat load (when present) increased TSK more in the absence of hypobaric hypoxia (see ).
TC was significantly affected by heat load, with a higher mean TC in the presence of heat load (M = 37.08, SE = .07) compared to the absence of heat load (M = 36.95, SE = .07) (see ). However, the absolute increase of TC (mean difference = .13) can be interpreted as negligible heat strain. TC was not affected by hypobaric hypoxia, while the interaction term for heat load and hypobaric hypoxia was significant. The latter implies that heat load (when present) increased TC more in the absence of hypobaric hypoxia.
Additionally, MBT was significantly affected by heat load, with a higher MBT in the presence of heat load (M = 36.40, SE = .13) compared to the absence of heat load (M = 35.71, SE = .13) (see ). MBT was not affected by hypobaric hypoxia, neither by the interaction term of heat load and hypobaric hypoxia. This absence of an interaction effect in MBT may indicate that both heat load conditions (only heat load and combined stressor condition) induced comparable heat strain, despite the differences found in WBGT measures during these conditions.
TFOREARM-FINGER was significantly affected by heat load, with a lower mean TFOREARM-FINGER gradient in the presence of heat load (M = .54, SE = .54) compared to the absence of heat load (M = 3.61, SE = .54) (see ). TFOREARM-FINGER was not affected by hypobaric hypoxia. The interaction term for heat load and hypobaric hypoxia was also not significant.
3.3. Subjective ratings
The subjective thermal sensation was significantly affected by heat load, with higher mean ratings in the presence of heat load (M = 2.63, SE = .16) compared to the absence of heat load (M = .57, SE = .16). Thermal sensation was not affected by hypobaric hypoxia, while the interaction term for heat load and hypobaric hypoxia was significant. The latter implies that heat load (when present) increased the thermal sensation rating more in the absence of hypobaric hypoxia (see ).
Figure 6. Significant effects of heat load and hypobaric hypoxia on subjective temperature sensation (A) and subjective thermal discomfort (B). Error bars are ±1 SE (standard error).
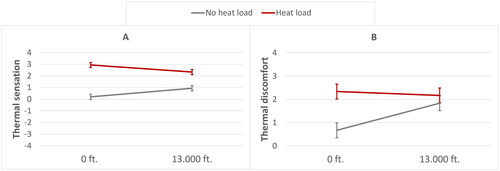
Subjective thermal discomfort was also significantly affected by heat load, with higher mean discomfort ratings in the presence of heat load (M = 2.25, SE = .26) compared to the absence of heat load (M = 1.25, SE = .26). Thermal discomfort was not affected by hypobaric hypoxia, while the interaction term for heat load and hypobaric hypoxia was significant. Pairwise comparisons showed that heat load (when present) increased thermal discomfort more in the absence of hypobaric hypoxia (see ).
In , the extent to which any possible hypoxia symptoms occurred in each condition for each phase are shown. Overall, participants rated the symptoms ‘heat’, ‘fatigue’, ‘dry mouth’, ‘yawning’, ‘sweating’, and ‘headache’ to a lower extent in the hypobaric hypoxia condition compared to the heat load and combined heat load + hypobaric hypoxia conditions.
Table 4. Median and range of reported hypoxia related symptoms on a scale from 0 (none) to 7 (extreme).
4. Discussion
The results show that heat load caused a significant cognitive performance decline on one of the multitasks (SYNWIN, but not MATB-II) and on the vigilance task (VigTrack). In contrast, hypobaric hypoxia did not affect the performance on these tasks, except for the arithmetic sub-task of the SYNWIN. The average performance of the latter test significantly declined due to heat load as well as hypobaric hypoxia, as reflected by two main effects. The lack of a significant two-way interaction suggests that the effects of both stressors were additive, and not synergistic as we had expected.
We collected physiological and subjective data to measure the effectiveness of both stressors to affect the participants’ physiological strain. The significant decrease in blood oxygen saturation (83.9% compared to 96.9% at sea level) confirms that the altitude of 13,000 ft induced mild hypobaric hypoxia. In heat load conditions, we found that skin temperature increased, as well as subjective ratings of heat load-related symptoms, i.e. temperature sensation and thermal discomfort. Contrary to our expectation, and model calculation, the rise in body core temperature during heat load was negligible. Apparently, the heat load in our study can be considered as compensable (Foster et al. Citation2020). A possible explanation is that the increased vasodilatation and associated increase in mean skin temperature and the sweat rate together allowed for sufficient convective and evaporative heat loss, preventing an increase in body core temperature. These thermoregulatory processes could in theory result in reduced cerebral blood flow, and thus reduced supply of oxygen to the brain (Nelson et al. Citation2011). However, we have not measured cerebral blood flow and we cannot make any conclusions about that mechanism. Another possible explanation is that the negative effects we found of heat load on cognitive performance can be attributed to increased thermal discomfort as indicated by the subjective ratings. This is in line with Gaoua et al. (Citation2012) who found that an increased skin temperature impaired cognitive performance, while body core temperature did not increase. According to these authors, thermal discomfort can draw cognitive resources away from the tasks, resulting in suboptimal task performance. Since the effects of heat load were indeed associated with thermal discomfort, the effects of heat load are not necessarily caused through the same mechanism as those of hypobaric hypoxia (i.e. reduced oxygen supply to the brain). This could explain why we found an additive and no interaction effect of both stressors.
Hypobaric hypoxia did not result in the expected performance decline on the majority of cognitive tasks. In literature also contrasting results at these altitude levels were found due to various factors, like the specific cognitive functions required by the task, the duration spent at altitude, and inter-individual differences (Martin et al. Citation2019; Petrassi et al. Citation2012). In our study, hypobaric hypoxia only affected the arithmetic sub-task of the SYNWIN, a task that continuously draws on one’s working memory (Malle et al. Citation2013). Besides a lower overall arithmetic performance score caused by both stressors leading to a lower number of correct responses, we observed that the participants responded slower in hypobaric hypoxia conditions but made more errors in the heat load conditions. These findings regarding hypobaric hypoxia are in line with Beer et al. (Citation2017), who also found slower and less correct responses on the arithmetic sub-task of the SYNWIN at altitudes of 18,000 ft or higher.
4.1. Sensitivity of the tasks
Except for the arithmetic sub-task of the SYNWIN, it is possible that the other cognitive tasks may not have been sensitive enough to detect performance decline for the mild hypoxia induced in this study. A suggestion would be to simulate higher altitudes to be able to show clear effects on cognitive performance. However, the operational relevance for helicopter aircrew has to be considered at higher altitudes, as they are not allowed to fly above 13,000 ft for a longer than 30 min. The lack of any observed effect of both stressors on the MATB-II, suggests that this type of task was not sensitive to the effects of the stressors. A possibility is that this task is more challenging, which may increase the participants’ motivation to perform. Furthermore, the subtasks of the MATB-II can be performed more easily in succession, which makes it less complex compared to the subtasks of the SYNWIN. Moreover, the secondary attention task (PVT) in the participants’ peripheral view during the MATB-II was also unaffected, indicating that participants were able to pay enough attention to both the primary and secondary tasks. Besides the sensitivity of the task itself, another explanation is that the total number of participants was not large enough to detect effects on the MATB-II.
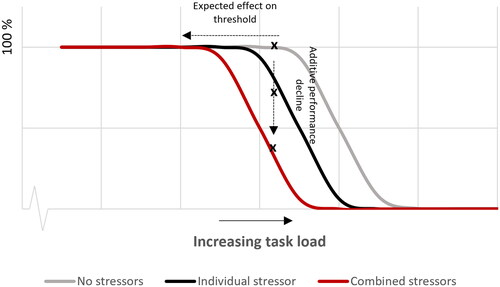
4.2. Theoretical model
In a previous study, Bottenheft et al. (Citation2020) proposed a theoretical model to describe the effect of a stressor on cognitive task performance. The model assumes that a stressor draws cognitive resources away from the cognitive task so that one can no longer achieve the maximum task load which can be achieved without a stressor. This is illustrated by the leftward shift of the performance curve in . The general idea is that, when task load increases, at some point the task becomes too difficult to be performed at maximum (100%) level. When task load further increases, the relative performance starts to decline, which explains the drop at the right hand side of the performance curve. In the presence of one (or two) stressor(s) that draw cognitive resources away from the task, the maximum task load that can be achieved (the ‘threshold’) is expected to shift to lower task load levels, indicated by the grey and black line, respectively. Because we did not vary the load of the task in this study, we cannot determine such a shift. Instead, we measured performance decline at a fixed task load, i.e. the arithmetic task, indicated by the vertical dotted line. To validate the predicted stressor-induced shift of the performance curve to lower task load levels, future research could measure the effect of a stressor on the cognitive performance as function of task load. Besides this, it is important to note that low performance due to an inattentive state at extreme low task load (left side) is not shown in . The impact of a stressor can be different at these lower task load levels, e.g. performance can increase instead of decrease due to higher arousal with a stressor (Bottenheft et al. Citation2020). Therefore, the left side of the performance curve must also be taken into account in future research.
Figure 7. Expected performance curves for conditions without stressors (most right line), with one stressor (middle line), and with two stressors (most left line) as function of increasing task load based on the results of the arithmetic subtask of the SYNWIN.
4.3. Conclusions and implications
It is remarkable that cognitive task performance was generally maintained during exposure to a combination of heat load and hypobaric hypoxia, despite the high physiological strain and subjective discomfort. Among the multitask test battery, only the arithmetic subtask was sensitive to the effects of hypobaric hypoxia, whereby hypobaric hypoxia caused a further performance decline in addition to the decline caused by heat load. This additive effect may be attributed to independent mechanisms of thermal discomfort and reduced oxygenated blood. Because the arithmetic subtask depends continuously on one’s working memory, this result is interesting for pilot performance in military operations, which, besides flying skills, involve various cognitive activities that appeal for the pilot’s working memory capacity.
Furthermore, this study showed that cognitive performance significantly declines under heat load. Thus, attention should be paid to the consequences of the rise of temperature in the cockpit during flight preparations. However, the participants in our study were not acclimatised to heat before the test days. Acclimatisation to heat results in various changes in physiological responses that can make it easier for the body, and therefore probably also for the cognitive state, to cope with warm climates. Therefore it is reasonable to assume that the results obtained in this study are not applicable to heat acclimatised people. Nevertheless, it is possible that personnel acclimatised to a hot climate can temporarily encounter even higher temperatures. For example, during the pre-takeoff check on the ground, the temperature inside a helicopter cockpit can increase significantly above the air temperature to which the aircrew has been acclimatised. The results of our study apply to such situations.
Acknowledgements
The authors want to thank our TNO team for their contributions to the setup of the experiment. Special thanks to the flight surgeons and aviation physiologists from the Centre for Man and Aviation (Royal Netherlands Air Force) for using their facilities and their contributions during the experiment.
Disclosure statement
No potential conflict of interest was reported by the author(s).
Additional information
Funding
References
- Alais, D., and, D. Burr. 2003. “The “flash-Lag” Effect Occurs in Audition and Cross-Modally.” Current Biology 13 (1): 59–63. doi:10.1016/S0960-9822(02)01402-1.
- Arnegard, Ruth J., and J.R. Comstock Jr. 1991. “Multi-Attribute Task Battery-Applications in Pilot Workload and Strategic Behavior Research.” In International Symposium on Aviation Psychology.
- Aldous, J.W.F., B.C.R. Chrismas, I. Akubat, B. Dascombe, G. Abt, and L. Taylor. 2015. “Hot and Hypoxic Environments Inhibit Simulated Soccer Performance and Exacerbate Performance Decrements When Combined.” Frontiers in Physiology 6: 421–414. doi:10.3389/fphys.2015.00421.
- Basner, M., and D.F. Dinges. 2011. “Maximizing Sensitivity of the Psychomotor Vigilance Test (PVT) to Sleep Loss.” Sleep 34 (5): 581–591. doi:10.1093/sleep/34.5.581.
- Beer, J.M.A., B.S. Shender, D. Chauvin, T.S. Dart, and J. Fischer. 2017. “Cognitive Deterioration in Moderate and Severe Hypobaric Hypoxia Conditions.” Aerospace Medicine and Human Performance 88 (7): 617–626. doi:10.3357/AMHP.4709.2017.
- Bongers, C.C.W.G., H.A.M. Daanen, C.P. Bogerd, M.T.E. Hopman, and T.M.H. Eijsvogels. 2018. “Validity, Reliability, and Inertia of Four Different Temperature Capsule Systems.” Medicine and Science in Sports and Exercise 50 (1): 169–175. doi:10.1249/MSS.0000000000001403.
- Bottenheft, C., A.-M. Brouwer, I. Stuldreher, E. Groen, and J. van Erp. 2020. “Cognitive Task Performance under (Combined) Conditions of a Metabolic and Sensory Stressor.” Cognition, Technology and Work 23(4): 805–817. doi:10.1007/s10111-020-00653-w.
- Bradbury, K.E., K.E. Coffman, K.M. Mitchell, A.J. Luippold, C.S. Fulco, and R.W. Kenefick. 2019. “Separate and Combined Influences of Heat and Hypobaric Hypoxia on Self-Paced Aerobic Exercise Performance.” Journal of Applied Physiology 127 (2): 513–519. doi:10.1152/japplphysiol.00023.2019.
- Bräuer, A. 2018. “Perioperative Temperature Management.” Anasthesiologie Und Intensivmedizin 59 (10): 587–596. doi:10.19224/ai2018.587.
- Broadbent, D. E. 1963. “Differences and Interactions between Stresses.” Quarterly Journal of Experimental Psychology 15 (3): 205–211. 10.1080/17470216308416325.
- Brothers, R.M., J.E. Wingo, K.A. Hubing, and C.G. Crandall. 2009. “The Effects of Reduced End-Tidal Carbon Dioxide Tension on Cerebral Blood Flow during Heat Stress.” The Journal of Physiology 587 (Pt 15): 3921–3927. doi:10.1113/jphysiol.2009.172023.
- Burr, D., and D. Alais. 2006. “Combining Visual and Auditory Information.” Progress in Brain Research 155: 243–258. doi:10.1016/S0079-6123(06)55014-9.17027392
- Corcoran, D.W.J. 1962. “Noise and Loss of Sleep.” Quarterly Journal of Experimental Psychology 14 (3): 178–182. doi:10.1080/17470216208416533.
- Elsmore, T. F. 1994. “SYNWORK1: A PC-Based Tool for Assessment of Performance in a Simulated Work Environment.” Behavior Research Methods, Instruments, and Computers 26 (4): 421–426.
- Faerevik, Hilde, and Randi Eidsmo Reinertsen. 2003. “Effects of Wearing Aircrew Protective Clothing on Physiological and Cognitive Responses under Various Ambient Conditions.” Ergonomics 46 (8): 780–799. doi:10.1080/0014013031000085644.
- Foster, J., S.G. Hodder, A.B. Lloyd, and G. Havenith. 2020. “Individual Responses to Heat Stress: Implications for Hyperthermia and Physical Work Capacity.” Frontiers in Physiology 11: 1–28. doi:10.3389/fphys.2020.541483.
- Froom, P., Y. Caine, I. Shochat, and J. Ribak. 1993. “Heat Stress and Helicopter Pilot Errors.” Journal of Occupational Medicine 35 (7): 720–724. doi:10.1097/00043764-199307000-00016.
- Gaoua, N., J. Grantham, S. Racinais, and F. El Massioui. 2012. “Sensory Displeasure Reduces Complex Cognitive Performance in the Heat.” Journal of Environmental Psychology 32 (2): 158–163. doi:10.1016/j.jenvp.2012.01.002.
- Gaoua, Nadia, S. Racinais, J. Grantham, and F. El Massioui. 2011. “Alterations in Cognitive Performance during Passive Hyperthermia Are Task Dependent.” International Journal of Hyperthermia 27 (1): 1–9. doi:10.3109/02656736.2010.516305.
- Gibbons, T.D., M.M. Tymko, K.N. Thomas, L.C. Wilson, M. Stembridge, H.G. Caldwell, C.A. Howe, R.L. Hoiland, A.P. Akerman, T.G. Dawkins, A. Patrician, G.B. Coombs, C. Gasho, B.S. Stacey, P.N. Ainslie, and J.D. Cotter. 2020. “Global REACH 2018: The Influence of Acute and Chronic Hypoxia on Cerebral Haemodynamics and Related Functional Outcomes during Cold and Heat Stress.” The Journal of Physiology 598 (2): 265–284. doi:10.1113/JP278917.
- Gibson, O.R., L. Taylor, P.W. Watt, and N.S. Maxwell. 2017. “Cross-Adaptation: Heat and Cold Adaptation to Improve Physiological and Cellular Responses to Hypoxia.” Sports Medicine 47 (9): 1751–1768. doi:10.1007/s40279-017-0717-z.
- Girard, O., and S. Racinais. 2014. “Combining Heat Stress and Moderate Hypoxia Reduces Cycling Time to Exhaustion without Modifying Neuromuscular Fatigue Characteristics.” European Journal of Applied Physiology 114 (7): 1521–1532. doi:10.1007/s00421-014-2883-0.
- Hambrick, D.Z., F.L. Oswald, E.S. Darowski, T.A. Rench, and R. Brou. 2010. “Predictors of Multitasking Performance in a Synthetic Work Paradigm.” Applied Cognitive Psychology 24 (8): 1149–1167. doi:10.1002/acp.1624.
- Hancock, P.A., and I. Vasmatzidis. 2003. “Effects of Heat Stress on Cognitive Performance: The Current State of Knowledge.” International Journal of Hyperthermia 19 (3): 355–372. doi:10.1080/0265673021000054630.
- House, J.R., and M.J. Tipton. 2002. “Using Skin Temperature Gradients or Skin Heat Flux Measurements to Determine Thresholds of Vasoconstriction and Vasodilatation.” European Journal of Applied Physiology 88 (1–2): 141–145. doi:10.1007/s00421-002-0692-3.
- International Organization for Standardization. 2019. Ergonomics of the Physical Environment—subjective judgement scales for assessing physical environments. (ISO standard no. 10551:2019). https://www.iso.org/standard/67186.html
- Keramidas, M.E., N.D. Geladas, I.B. Mekjavic, and S.N. Kounalakis. 2013. “Forearm-Finger Skin Temperature Gradient as an Index of Cutaneous Perfusion during Steady-State Exercise.” Clinical Physiology and Functional Imaging 33 (5): 400–404. doi:10.1111/cpf.12043.
- Lloyd, A., and G. Havenith. 2016. “Interactions in Human Performance: An Individual and Combined Stressors Approach.” Temperature 3 (4): 514–517. doi:10.1080/23328940.2016.1189991.
- Lloyd, A., M. Raccuglia, S. Hodder, and G. Havenith. 2016. “Interaction between Environmental Temperature and Hypoxia on Central and Peripheral Fatigue during High-Intensity Dynamic Knee Extension.” Journal of Applied Physiology 120 (6): 567–579. doi:10.1152/japplphysiol.00876.2015.
- Malle, C., P. Quinette, M. Laisney, C. Bourrilhon, J. Boissin, B. Desgranges, F. Eustache, and C. Piérard. 2013. “Working Memory Impairment in Pilots Exposed to Acute Hypobaric Hypoxia.” Aviation, Space, and Environmental Medicine 84 (8): 773–779. doi:10.3357/ASEM.3482.2013.
- Martin, K., E. McLeod, J. Périard, B. Rattray, R. Keegan, and D.B. Pyne. 2019. “The Impact of Environmental Stress on Cognitive Performance: A Systematic Review.” Human Factors 61 (8): 1205–1246. doi:10.1177/0018720819839817.
- McMorris, T., B.J. Hale, M. Barwood, J. Costello, and J. Corbett. 2017. “Effect of Acute Hypoxia on Cognition: A Systematic Review and Meta-Regression Analysis.” Neuroscience and Biobehavioral Reviews 74 (Pt A): 225–232. doi:10.1016/j.neubiorev.2017.01.019.
- Moore, L.G., S.M. Charles, and C.G. Julian. 2011. “Humans at High Altitude: Hypoxia and Fetal Growth.” Respiratory Physiology & Neurobiology 178 (1): 181–190. doi:10.1016/j.resp.2011.04.017.
- Muthuraju, S., and S. Pati. 2014. “Effect of Hypobaric Hypoxia on Cognitive Functions and Potential Therapeutic Agents.” Malaysian Journal of Medical Sciences 21 (13): 40–44.
- Nelson, M.D., M.J. Haykowsky, M.K. Stickland, L.A. Altamirano-Diaz, C.K. Willie, K.J. Smith, S.R. Petersen, and P.N. Ainslie. 2011. “Reductions in Cerebral Blood Flow during Passive Heat Stress in Humans: Partitioning the Mechanisms.” The Journal of Physiology 589 (Pt 16): 4053–4064. doi:10.1113/jphysiol.2011.212118.
- Notley, S.R., R.D. Meade, and G.P. Kenny. 2021. “Time following Ingestion Does Not Influence the Validity of Telemetry Pill Measurements of Core Temperature during Exercise-Heat Stress: The Journal Temperature Toolbox.” Temperature 8 (1): 12–20. doi:10.1080/23328940.2020.1801119.
- Organization for Standardization. 2004a. Ergonomics of the Thermal Environment—Analytical Determination and Interpretation of Heat Stress Using Calculation of the Predicted Heat Strain. (ISO Standard No. 7933:2004). https://www.iso.org/standard/37600.html#:∼:text=ISO%207933%3A2004%20specifies%20a,response%20to%20the%20working%20conditions.
- Organization for Standardization. 2004b. Ergonomics—Evaluation of Thermal Strain by Physiological measurements. (ISO Standard No. 9886:2004). https://www.iso.org/standard/34110.html
- Périard, J.D., S. Racinais, and M.N. Sawka. 2015. “Adaptations and Mechanisms of Human Heat Acclimation: Applications for Competitive Athletes and Sports.” Scandinavian Journal of Medicine and Science in Sports 25 (S1): 20–38. doi:10.1111/sms.12408.
- Petrassi, F.A., P.D. Hodkinson, P.L. Walters, and S.J. Gaydos. 2012. “Hypoxic Hypoxia at Moderate Altitudes: Review of the State of the Science.” Aviation, Space, and Environmental Medicine 83 (10): 975–984. doi:10.3357/ASEM.3315.2012.
- Piggott, J.J., C.R. Townsend, and C.D. Matthaei. 2015. “Reconceptualizing Synergism and Antagonism among Multiple Stressors.” Ecology and Evolution 5 (7): 1538–1547. doi:10.1002/ece3.1465.
- Piil, J.F., B. Kingma, N.B. Morris, L. Christiansen, L.G. Ioannou, A.D. Flouris, and L. Nybo. 2021. “Proposed Framework for Forecasting Heat-Effects on Motor-Cognitive Performance in the Summer Olympics.” Temperature 8 (3): 262–283. doi:10.1080/23328940.2021.1957367.
- Santiago-Espada, Y., R.R. Myer, K.A. Latorella, and J.R. Comstock. 2011. “The Multi-Attribute Task Battery II (MATB-II) Software for Human Performance and Workload Research: A User’s Guide.” NASA Technical Memorandum, July. http://www.sti.nasa.gov
- Shaw, D.M., G. Cabre, and N. Gant. 2021. “Hypoxic Hypoxia and Brain Function in Military Aviation: Basic Physiology and Applied Perspectives.” Frontiers in Physiology 12: 665821. doi:10.3389/fphys.2021.665821.
- Sihver, L., O. Ploc, M. Puchalska, I. Ambrožová, J. Kubancák, D. Kyselová, and V. Shurshakov. 2015. “Radiation Environment at Aviation Altitudes and in Space.” Radiation Protection Dosimetry 164 (4): 477–483. doi:10.1093/rpd/ncv330.
- Valk, P J., R. M. Simons, P. A. Struyvenberg, H. Kruit, and M T. Van Berge Henegouwen. 1997. “Effects of a Single Dose of Loratadine on Flying Ability under Conditions of Simulated Cabin Pressure.” American Journal of Rhinology 11 (1): 27–33. doi:10.2500/105065897781446838.9065344
- Valk, P. J. L, and M. Simons. 2009. “Effects of Loratadine/montelukast on Vigilance and Alertness Task Performance in a Simulated Cabin Environment.” Advances in Therapy 26 (1): 89–98. doi:10.1007/s12325-008-0127-6.
- Van Cutsem, J., N. Pattyn, D. Vissenaeken, G. Dhondt, K. De Pauw, C. Tonoli, R. Meeusen, and B. Roelands. 2015. “The Influence of a Mild Thermal Challenge and Severe Hypoxia on Exercise Performance and Serum BDNF.” European Journal of Applied Physiology 115 (10): 2135–2148. doi:10.1007/s00421-015-3193-x.
- Vrijkotte, S., P.J. Valk, B.J. Veenstra, and T. Visser. 2009. Monitoring physical and cognitive performance during sustained military operations. Netherlands: TNO Defence Security and Safety Soesterberg.
- Wilson, T.E., J. Cui, R. Zhang, and C.G. Crandall. 2006. “Heat Stress Reduces Cerebral Blood Velocity and Markedly Impairs Orthostatic Tolerance in Humans.” American Journal of Physiology-Regulatory Integrative and Comparative Physiology 291 (5): 1443–1448. doi:10.1152/ajpregu.00712.2005.
- Zijlstra, F.R.H., and L. Van Doorn. 1985. The Construction of a Scale to Measure Subjective Effort. Vol. 43, 124–139. Delft: Delft University of Technology.