
Abstract
Slips, trips, and falls (STFs) occur frequently at train stations and on trains, and result in passengers injuries. STFs underlying causes focussing on passengers with reduced mobility (PRM) were investigated. Mixed methods combining observation and retrospective interviews were used. Thirty-seven participants between 24 and 87 years of age completed the protocol. They navigated between three selected stations while wearing the Tobii eye tracker. In retrospective interviews, they were asked to explain their actions in selected video segments. The research identified the dominant risky locations and risk-taking behaviour in risky locations. For example: (i) risky locations were the vicinity of obstacles, (ii) risky behaviour was not looking at the gap between the platform and train. The dominant risky locations and behaviours could be considered as underlying causes of slips, trips, and falls for PRMs. They can be applied during planning and design of rail infrastructure to predict and mitigate STFs.
Practitioner summary: A significant number of slips, trips, and falls (STFs) occurs at railway stations, and often result in personal injury. This research identified the dominant risky locations and behaviour as underlying causes of STFs for people with reduced mobility (PRMs). The recommendations presented could be implemented to mitigate such risk.
1. Introduction and background
Public transport facilitates independence and social interaction (Church, Frost, and Sullivan Citation2000; Tilley et al. Citation2017), and we need to ensure that it is safe for and accessible to people of all ages, abilities, and mobility (Wilson and Norris 2006). Nevertheless, questions have been raised about how seriously public transport operators take the needs of ‘persons with reduced mobility’ (PRM) into account (Gilhooly et al. Citation2002).
The concept of ‘mobility’ is complex, and difficult to define (Metz Citation2000): it can be related to the effectiveness of a transport network, or to an individual’s ability to access and navigate the network (Church, Frost, and Sullivan Citation2000); it can be impacted by geographical location, socio-economic factors, and the needs and preferences of particular social groups (Church, Frost, and Sullivan Citation2000); and it can also be temporarily or permanently impaired (Ancell and Graham Citation2016).
Studies exploring the relationship between public transport and people with disabilities or limited mobility predominately focus on the needs of the ageing (Banister and Bowling Citation2004; Dickerson et al. Citation2007; Metz Citation2000; Waterson et al. Citation2016). Research does, however, encompass factors, such as vision impairment (Gallagher et al. Citation2011); obesity, and other conditions (Ancell and Graham Citation2016); and social, economic, temporal, and geographic considerations (Church, Frost, and Sullivan Citation2000). As do Ancell and Graham (Citation2016), we use the term ‘persons with reduced mobility’ (PRM) to include those with both temporary and permanent mobility impairment. In the former category, we included passengers travelling with luggage or pushing a pram, as they experience similar mobility challenges.
1.1. Slips, trips, and falls in urban transport
Despite the innovative accessibility and information provision afforded by digital technologies (dell’Olio, Ibeas, and Cecín Citation2010; Foell, Rawassizadeh, and Kortuem Citation2013; Paulley et al. Citation2006), urban transport systems are still complex sociotechnical environments, and include a range of components that can impact a person’s safety. Thus, a significant number of slips, trips, and falls (STFs) continue to occur, and often result in personal injury.
In a London Transport study, Church, Frost, and Sullivan (Citation2000) suggest that the simple nature of transport systems can create physical and psychological barriers for various groups of people, including passangers with reduced mobility (PRM), small children, and people who do not speak English. Studies examining the travel patterns of older people regularly point to concerns about disorientation, unreliable services, difficulties in accessing stops or stations, and fears of personal injury (Burkhardt, McGravock, and Nelson Citation2002; Wong et al. Citation2018).
Several factors could contribute to slips, trips and falls (STFs). Personal characteristics, such as age, height, fitness level, gait, and vision influence how people navigate obstacles or how they react to, and recover from a slip (Lockhart, Woldstad, and Smith Citation2003; Swensen et al. Citation1992). Physical disabilities could be another factor that affects the risk of a STF. Currently, there is a lack of research into whether there is an increased risk of STFs for people with reduced mobility in rail terminals or trains. Some studies, however, do indicate that building design and flooring should consider the needs of those with disabilities (Bird Citation2008; Gunatilaka, Clapperton, and Cassell Citation2005).
Items that people carry (e.g. mobile phone and/or luggage) and environmental elements (Larue et al. Citation2021; Cave et al. Citation2013, Citation2014) also influence safety. It is often difficult to apportion the relative influence of such factors on STFs, however, as the latter are usually due to a complex combination of factors. For example, a fall that occurred while going down stairs may be the result of the floor surface; inappropriate footwear; and/or personal health issues (Bowman Citation2000). Other factors—such as building design, the visual environment, and the intrinsic nature of the person—can also be important factors (Leamon Citation1992; Ozanne-Smith et al. Citation2008).
Waterson et al. (Citation2016) applied a system approach by studying the risk of slips, trips, and falls for an ageing population. They reported that the rushing behaviour on train platforms was one of the main concerns. The findings are summarised in a system model outlining priorities regarding STFs.
Feldman and Chaudhury (Citation2008) suggest that as mobility decreases—with age, for example—risk-taking behaviour increases; therefore, the risk of injury also increases. While other risk factors—such as an individual’s medication, perception of physical abilities, history of falls, and use of assistive devices—also need to be considered (Boelens, Hekman, and Verkerke Citation2013; Feldman and Chaudhury Citation2008), PRM is already somewhat predisposed to an increased risk of injury, as are those with good mobility but with higher risk-taking behaviour.
An earlier study explored the experiences and risk-taking behaviours of rail passengers without mobility issues (Larue et al. Citation2021). In this study, it was found that, while passengers exhibited some risky behaviours that could contribute to STFs, some changed their behaviour in risky locations. Despite being prompted to consider such behaviour in retrospective interviews, passengers rarely acknowledged their risky behaviour, and generally saw themselves as acting in a safe and courteous manner.
1.2. Safety and injury in the rail environment
There are well-established engineering mitigations and countermeasures on stations and trains to reduce STFs, such as handrails, suitable flooring and lighting, and a reduction in the need to run or rush (Gielo-Perczak, Maynard, and DiDomenico Citation2006; Li et al. Citation2004; McGorry, DiDomenico, and Chang Citation2010; Ozanne-Smith et al. Citation2008; Yeoh, Lockhart, and Wu Citation2013). The prevalence of STFs, however, suggests that existing solutions are simplistic or ineffective.
In an extensive international examination of metro railway systems, Kyriakidis, Hirsch, and Majumdar (Citation2012) note that passenger actions are the main cause of accidents. This was most evident in vulnerable groups, such as pregnant women, older people, and children. While they illustrate design and management initiatives aimed at reducing risk, they also found that better communication with passengers is the most effective strategy. Using the UK Safety Risk Model, the Office of the National Rail Safety Regulator (Citation2013) determined that STFs generally contribute to about a third of total rail safety risks, with more than half of these incidents resulting in minor injury. About 90 percent of minor injuries recorded annually by the Queensland Rail Safety Regulator are the result of STFs (Larue et al. Citation2021; Queensland Transport and Main Roads Citation2013).
Meanwhile, for older passengers and PRM, the risks and challenges are greater (Ferrari et al. Citation2014). The UK Rail Standards and Safety Board (RSSB Citation2014) reports that the rate of injury is five times higher for passengers over 70 years old. Given the increasing socio-cultural complexity of cites, and their need for safe and accessible transport, the prevention of injury needs to be a priority for rail operators. The available literature search demonstrated that there is considerable amount of research into STFs in other areas, such as (i) firefighters STFs accidents (Kong, Suyama, and HostlerCitation2013); workplace STFs (Bentley Citation2009); or (iii) the state of science regarding the occupational STFs on the same level (Chang et al. Citation2016). Nevertheless, there is no available research on the underlying risk-factors contributing to STFs, and we recognised this as a significant research gap that needed addressing. Therefore, this study aimed to understand how PRM navigate their journeys on an inner-city rail network (Brisbane, Australia), and to identify underlying STF risk factors. The goal was to understand and mitigate these risks and to inform the design of safer, more inclusive, and more accessible transport services.
1.3. Historical record examination
Historical records of STF incidents in Australia were first investigated to identify their most prevalent contributing factors. Incident records involving members of the public while at a railway station or on a train were obtained from two States: Queensland (2009–2013) and Western Australia (July 2009 to June 2015). These factors, combined with knowledge gained from the literature review, informed the mixed methods design in this study.
Specifically, we analysed Queensland (3828 STF incident reports) and Western Australian (936 incident reports) STF data from (Cave et al. Citation2015). Each record included location information (station, suburb, and specific location within the station or train), date and time of the incident. A text description of the event was also included, providing information on contributing factors. Queensland records also included gender and injury level. Our analysis was based on the interpretation of data that were likely to contribute to incidents and was conducted on a representative sample of approximately a third (N = 1247 out of 3828) of all incidents. Of these, 81.4% were Queensland incidents and 18.6% were Western Australian. Up to four contributory factors were identified and recorded for each event. To ensure inter-rater reliability, two of the authors independently coded a sample of 100 cases. Then, the research team met and discussed cases where disagreement was found and agreed on the most appropriate attributing factors. This consolidation process established the parameters for coding of the remaining cases by a single coder.
shows the incident description and coding samples of contributing factors. Differences in the involvement of prominent factors were tested for statistical significance using Pearson’s Chi-Square tests.
Table 1. Sample historical STF incident descriptions and coding for PRM.
An analysis of historical data showed that the most high-risk passenger categories were the elderly (21.3%) and those carrying luggage (6.9%). Indeed, a high proportion of incidents involved elderly passengers who were carrying luggage (43.6%, p < .001), and occurred on an escalator/travellator/elevator (19.2%, p < .001). Most incidents occurred when passengers were (i) moving between stations; (ii) moving between platform levels; or (iii) moving across bridges. Identified factors were attributed to passengers who were running, rushing, or carrying luggage during these activities.
We used these results to identify risky locations, to develop the coding scheme, and to select field study stations (Section 2.3). The literature review and the examination of historical records determined the specific scope of the research needed; in particular, they determined the research gap to investigate in further detail.
2. Methods
Our research employed a mixed methods approach using observations and retrospective interviews to explore STFs at train stations and on trains. Three stations—Fortitude Valley, Roma Street, and South Brisbane—were selected for investigation. Queensland Rail identified these stations as having recorded the most STFs in the Brisbane Central Busines District (CBD) zone. The research was approved by the Quensland University of Technology (QUT) Human Research Ethics Committee (1700000323). All participants were required to review and complete information and consent forms. The rational for participant selection was driven by the research aim to identify the underlying risk factors contributing to SFTs. Therefore, we decided to introduce ‘persons with reduce mobility’ (PMP) group to investigate. This is non-homogenous group of passengers experiencing similar mobility challenges and identified through the literature review and historical STFs records.
2.1. Participants
Thirty-seven (37) participants between 24 and 87 years of age completed the study protocol. Nearly two-thirds of these were female, and the average age was 49.8 years. Participants included older people (a person who is over 65 years of age) {10}; some with luggage and bags (13); some pushing a pram (8); and some using mobility aids (wheelchair {2}, and walking stick {4}). One blind individual did not complete the protocol and did not wear the eye-tracking glasses. However, they did walk through the stations and participated in an interview. Three participants’ video-recordings were corrupted. The data for these three participants and for the blind participant were excluded from the risky behaviours and locations analyses. The participants’ familiarity with the stations was assessed on a 10-point Likert scale (from 0 ‘Not at all’ to 10 ‘Extremely familiar’). Participant demographics and familiarity are reported in .
Table 2. Participant demographics and familiarity with field study stations (N = 37).
2.2. Protocol
Recruited participants navigated and travelled by train between the three selected stations. The participants wore the Tobii eye tracker (Tobii Technology Citation2019), which continuously video recorded the participant’s line of vision. A researcher followed a few metres behind. Observations occurred during the stations’ busy times (6:30–10:00 a.m. and 3:30–6:30 p.m.), but outside of peak hours). Each recorded episode was around 45 min duration. Each participant was interviewed within a week of the video recorded observation. While being shown sections of the recorded videos, they were asked to talk about where they were looking, what they were doing, and in some instances, why. Interviews provided qualitative information about the behaviour observed. Participants were each given a prepaid card to enable them to purchase a ticket. They were asked to do what they normally did during their journey (e.g. read and find information).
2.3. Analysis and coding
A comprehensive coding scheme was developed for the analysis of eye tracker video data (Larue et al. Citation2021). This scheme combined factors identified in the literature and historical data, and was refined based on what participants did while navigating the station (as observed by the researcher who was following them) and researchers’ pre-coding of three video recordings. (Refer to Appendix A for more details.) The main themes that guided the coding scheme were:
Participants’ location (e.g. stairs)
Participants’ gaze fixation on various elements of the train station (e.g. information screens, wall signage, floor signage, ceilings, and mobile devices)
Participants’ movements (walking or running)
Participants’ head direction (up, down, straight, back, left, right)
Video data were coded by one coder using the Observer software (Noldus Citation2018). Each theme was coded in sequence for the selected video segment, recording the start and end of each event, and allowing us to identify when participants engaged in particular behaviours (or combination of behaviours) as well and their duration.
Videos were first divided into segments where STFs were known to occur, and these locations were referred to as ‘risky locations’. They included elevators, stairs, escalators, ramps, obstacles (e.g. bypassing an obstacle, travelling through a wet area), and platforms when boarding or alighting from the train. Obstacles were further classified based on their size (higher or lower than ‘waist height’) as above waist height obstacles are safer than below waist height obstacles. Indeed, the literature shows that when a participant holds a box at waist height, stability is reduced (DavisCitation1993), and slips, trips and falls can be identified through acceleration measured at the waist (Aziz and Robinovitch Citation2011). For example, an unexpected trip when walking results in a forward shift in the centre of mass velocity (Wang et al. Citation2012) and can be identified through acceleration measured at the waist (Aziz and Robinovitch Citation2011). Unless the individual regains stability, a fall occurs. It is known that reducing excessive forward trunk angle and angular velocity (Crenshaw et al. Citation2012; Grabiner et al. Citation2012) can reduce the likelihood of a fall after a trip. Given that obstacles higher than waist provide an opportunity to regain stability using hands, it was considered that as above waist height obstacles are safer than below waist height obstacles, and obstacles were further classified based on their size (higher or lower than ‘waist height’).
These video segments are referred to as ‘within risky location’ in the remainder of the manuscript. It has to be noted that while these locations are locations where slips, trips and falls are known to be more likely to occur, risks within the various risky locations can be different. For example, while a fall may be avoided with obstacles taller than waist (hands can reach such obstacles), this is not the case with smaller obstacles.
The approach to the risky location was also used as a segment (15 s before reaching the risky location) and is referred to as ‘before risky location’. This allowed us to investigate changes in behaviour between an area of reduced STF occurrence and one of higher risk of occurrence.
Further to the known risky locations, additional sections of the videos were coded when participants’ actions were classified as ‘risky behaviour’. For their action to be classified as ‘risky’, they had to have engaged in a task that took their visual attention away from the path in front of them for two or more consecutive seconds while moving (either walking or running), reducing their ability to detect or react to a condition that could lead to a slip, trip or fall. The following behaviours were identified in the recorded videos:
Looking down at non-hazardous elements of their location
Looking down at a mobile phone, their hand, a watch, or ticket in their hand
Looking behind or back over their shoulder
Looking up while walking or running on escalators or stairs; changing trajectory due to an obstacle; boarding or alighting from a train
Not looking in their direction of travel while examining non-hazardous elements of their location
Walking faster than normal, or running
Not looking in their direction of travel or down when boarding or alighting from a train, or changing their trajectory due to an obstacle.
Participants’ risk-taking behaviours were compared in two ways. First, risk-taking rates before entering risky locations and while in these locations were compared. This comparison provided an indication of whether the participants recognised (consciously or unconsciously) that they were at higher risk and would change their behaviour accordingly. Second, risk-taking behaviours prior to boarding a train and those after alighting from a train were compared. This comparison indicated whether the participants were performing to ensure that they were able to board the next available train. These rates of risk-taking behaviours of the PRM group were also compared to those of the regular passenger group reported in Larue et al. (Citation2021).
The comparisons were made by calculating the ratio of the two rates (rate ratio or RR) and 95% confidence interval for the rate ratio. The null hypothesis for this comparison is that the rate ratio has a value of one (the rates are equal) against an alternative hypothesis that the rate ratio does not have a value of one (the rates are not equal). If the null value (RR = 1) is not contained in the 95% confidence interval, it suggests that the two rates are statistically significantly different.
The verbal data from the retrospective interviews were transcribed verbatim, and coded using Atlas.ti data analysis software (2018). The coding scheme was based on video data codes established in our first study with regular rail passengers (Larue et al. Citation2021). In the verbal data, participants described activities that were grouped into the categories of Planning, Experience, Looking/Using, Passengers, and Behaviour (). The sub-codes in this scheme were extended slightly (in , with * bold and italics) to provide more detail on participant activities, particularly in relation to the elements in the environment they were in. For example, with the code Station Signage, we sought to make distinctions between the use of Concourse Signage and Platform Signage, and to identify features, such as Maps.
Planning codes refer to the navigation, information seeking, and confirmation work required of passengers throughout their rail journey (This navigation/information/confirmation included: the train they needed to get on; the time it was coming; the platform it came on; and the location of that platform.)
Looking/Using codes identify both physical elements within the environment and participants’ actions during their journey.
Experience codes reflect elements of the journey that contributed to both positive and negative experiences, and the knowledge from these various experiences that participants used during the journey.
Passenger codes identify various levels of confidence that participants expressed while navigating their journeys.
Behaviour codes identify participants’ risky or safe actions.
Table 3. Verbal data coding scheme samples (Note: Verbal data are grouped into categories of planning, experience, looking/using, passengers, and behaviour; sub-codes provide more details of participant activities).
Transcripts were coded following a process described by Saldaña (Miles, Huberman, and Saldana Citation2014; Saldaña Citation2009). Saldaña’s process outlines qualitative data analysis strategies, organisation of data, coding and analysis approaches. The results presented in the following section are supported with excerpts from the data. (Refer to Appendix B for more details.)
3. Results
Our analysis looked at the risky locations where participants spent most of their time (as a measure of exposure to the different types of known risky locations); participants’ most common risky behaviours; and the behaviours that took up most of their time. Descriptive statistics highlight the behaviours and locations most related to STFs. Rates of risky behaviour were used to compare participants’ behaviour changes.
Across all stations, the types of risky locations that participants were most exposed to are presented in and were: permanent, taller than waist-height obstacles, such as ATMs and ticket gates (median: 0.31%; interquartile range: 0.14–0.48%; mean: 2.19 occurrences per journey); temporary, taller than waist-height obstacles, such as other people in the way (median: 0.21%; interquartile range: 0.10–0.48%; mean: 1.57 occurrences per journey); and temporary, shorter than waist- height obstacles, such as chairs, tables, and wet floor warning posts (median: 0.17%; interquartile range: 0.07–0.30%; mean: 1.76 occurrences per journey).
Table 4. Exposure to risky locations for persons with reduced mobility.
The risky behaviours that participants spent the most time engaging in are shown in and were: not looking straight ahead (median: 0.63%; interquartile range: 0.45–0.89%; mean: 2.70 occurrences per journey); looking up in a risky location (median: 0.61%; interquartile range: 0.40–0.93%; mean: 0.30 occurrences per journey); and not looking at the gap between the platform and train (median: 0.51%; interquartile range: 0.40–0.76%; mean: 1.68 occurrences per journey). Such values, while appearing low, represent undesirable behaviours that can lead to slips, trips, and falls and are occurring often when considering the number of journeys on the rail network.
Table 5. Proportion of time spent engaging in risky behaviours for persons with reduced mobility.
Analysing in more detail the risky behaviours that participants engaged in whilke walking (), we found that the most frequent one was looking up for information for long durations (33.1%). Looking for information was also done by looking to the side (14.4%). Their next most frequent risky behaviour was looking to the side to non-hazardous elements outside their field of view for long durations (23.2%). The third most common risky behaviour was looking down at a distractive element for long durations (9.9%). The ranking of these behaviours was consistent across each of the three stations and the high-risk participant groups.
Table 6. Types of elements persons with reduced mobility look at while walking when not looking straight.
3.1. Risky locations and behaviors
Across the group, the risky location that participants were most exposed to was the vicinity of permanent obstacles that were taller than waist-high, which represents the approximate height of a person’s centre of gravity (e.g. Automated Teller Machines (ATMs), ticket gates). Older participants and those encumbered by luggage spent most of their time in the vicinity of taller, temporary obstacles (e.g. other people). For those who were using a mobility aid or motorised wheelchair, the risky location they spent most time in was the gap between the train and the platform. For those pushing a pram, the risky location they spent the most time in was the vicinity of taller permanent obstacles. Their next most risky location was crossing the gap between train and platform.
To understand what elements in the station may be contributing to STFs, a combination of participants’ head direction and the elements they were looking at when engaged in a risky behaviour were also analysed. When they were looking downward, they were primarily looking at a ticket, or a watch on their arm. When looking up, they were most often looking at signage as a source of information; when looking to their left or right, they were most often looking at signage. These patterns were consistent across each of the three stations.
When older participants were looking downward, they were primarily looking at a ticket, or watch on their arm. When looking up, they were most often looking at signage as a source of information, and when looking to the side, they were looking at signage. Similarly, when participants who were encumbered by luggage were looking downward, they were most often looking at a watch or an item in their hand. If they were looking up or to the side, they were most often looking at signage. When individuals using a mobility aid were not looking straight ahead in the direction of travel (down, up, or to the side), they were looking at signage. When the participant using a motorised wheelchair was looking down, it was at an elevator; when looking up, it was at a Queensland Rail staff member; and when looking to the side, it was at supports within a train. When participants pushing a pram looked down, they were most likely looking at a ticket, a watch, or their hand; when looking up or to the side of their direction of movement, they were examining signage.
Participants in each of the reduced mobility groups tended to have a higher rate of engaging in risky behaviours before entering a risky location (2.84 times per minute on average) than when they were in those locations (0.85 times per minute). The details for each PRM group are presented in . With the exception of participants using a mobility aid, a motorised wheelchair, and those pushing a pram, these differences in rates were statistically significant (). This indicates that participants reduced engaging in risky behaviours at risky locations.
Table 7. Comparison of risk-taking behaviours of PRM in risky locations (Note: PRM tended to have a higher rate of engaging in risky behaviours before entering a risky location).
With the exception of participants using a motorised wheelchair, other PRM tended to have a higher rate of risky behaviour before they boarded a train than after they alighted. However, with the exception of the result for those encumbered by luggage and the result for the whole PRM group, these differences in rates were not statistically significant. This indicates that participants were more likely to engage in risky behaviour before boarding a train (no doubt, to avoid missing it) than they were in the period after alighting from a train ().
Table 8. Comparison of risk-taking behaviours of PRM when boarding and alighting (Note: PRM demonstrated a higher rate of risky behaviour before they boarded a train than after they alighted).
3.2. Intra-rater reliability analysis
The video coder recoded their first video after having coded all the videos. This was used to estimate intra-rater reliability. Intra-rater reliability was calculated using the Observer software and two metrics were considered: first, the percentage of agreement in terms of frequency and sequence of events was 52.3%; then, the percentage of agreement in terms of durations of events was 92.8%. This suggests that while there was a relatively low reliability in the timing or sequence of events, there was high reliability for the duration of coded events between the initial and second set of observations. This outcome was more critical to the analysis performed in this study. The low reliability in timing suggests that the coder did not code the start time of an event with high accuracy; however, there was a high level of consistency in the duration of the events that were compared. Given that the analysis conducted in this study focussed on event durations and not when they started, it is expected that the low reliability found for the timing component does not affect the results presented in this paper.
4. Retrospective interview analysis
Verbal data analysis provides contextual information, and creates an overview of passengers’ rail experiences and information needs. The results () show that PRM felt that they demonstrated safe behaviour and consideration of others during their journeys, and that these journeys are overwhelmingly dominated by planning and visual searches (with the Looking/Using codes accounting for 38% of total codes). This suggests that train travel requires a high level of cognitive work and visual processing.
Figure 1. Frequency of individual codes within the data (Note: PRM demonstrated that their journey was dominated by getting through the station or navigating the rail network).
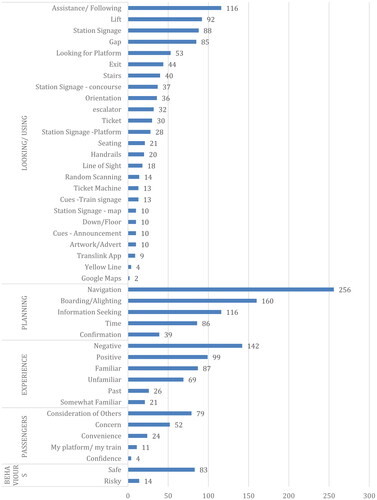
This cognitive work and visual processing are shown by the high volume of elements that passengers chose to, or were required to interact with during their journeys (i.e. the Looking/Using category). outlines the most prominent of these elements in all the main categories. These data further support the finding that older people often spend time near other people, by illustrating that PRM frequently asked for help or followed the crowd (i.e. Assistance/Following, n116).
I prefer to ask staff because it was much easier and it was less complicated to honest. [p109]
Of note in , however, is that Navigation (n256) far outweighs any other code. This suggests that journeys for PRM are dominated by the physical act of getting through the station or navigating the overall rail network.
4.1. Navigation
During navigation, participants relied heavily on knowledge from familiar experiences (n43) and the assistance of others (n28). They acknowledged that the process would be difficult without that experience:
…I think if you were to be a first time traveller you’d have to ask someone. It’s very confusing, but as I've caught trains in the past I know – I have some idea of where trains are going to and where they’re going from, but if you had no experience, especially if you were a tourist, it’s very confusing. [p124]
… I want to find the signs, the lift signs. It would’ve been a little bit more useful if there was some signage kind of pointing me in the right direction. I had to wait until I found the sign, like that was actually on the lift. [p118]
…I knew generally which way was the way out but because I've never been there with a pram before, I was kind of walking towards the exit thinking in my mind, am I going to be able to get out here or am I going to get to the exit and realize that it’s stairs and go and have to find another way? [p126]
Participants expressed an expectation that there would be a gap to negotiate. They described it in terms of the width of the space between the train and the platform, as well as the difference in height between the two. In this respect, inconsistencies across the network were a cause for concern. What would the gap be like at this station?
the platforms differ between stations… first I look at the gap and then I work out how far down it is, whether or not I need to put my foot on the- the basket of the pram to have to lift it up or I can’t really get the pram out of there, out of the train without it falling in between…[p130]
Time was of concern for participants during boarding and alighting. Participants found it difficult to determine how much time they had when getting on and off trains. They expressed a sense of urgency and a lack of information when trying to negotiate young children, walking aids, or luggage. They frequently made decisions ‘on-the-fly’ in response to questions, such as ‘How long before the doors close?’ and ‘How long before the next train arrives?’ Some participants decided that rather than trying to rush and board the train, it was better to wait for the next one.
I wasn’t sure if we were gonna catch it in time. I wasn’t sure how much time we had, and I didn’t want the doors to shut on us both… so I thought, “No, I won’t take the chance. Wait for the next one. The next one won’t be much longer anyway. [p131]
The participants described a higher number of negative (n142) than positive experiences (n99) (). Negative experiences were tied to looking for the Lifts (n92) and use of Station Signage (n92).
…because what you’re doing is you’re looking for a little sign somewhere that says lift- And they’re not necessarily always in the most umm prominent position… sometimes there will be a little sign against the wall and yet people are waiting to catch a train and they are standing in front of the sign. And you don’t even see it. [p121]
This results section concludes with a brief comparison of the main results for the regular passengers in our earlier study (Larue et al. Citation2021) and for the PRM in this study. For the verbal data, only the codes used in both studies are included. The comparison shows slight differences between the two study cohorts.
4.2. A comparison of regular passengers and PRM
highlights the most dominant differences in STF-related behaviours and locations between regular passengers (Larue et al. Citation2021) and PRM. Risks associated with regular passengers are related to using their mobile phone, moving (stairs and elevators), and moving faster than normal. By contrast, PRM is observed spending more time next to obstacles, and not looking straight ahead or at the gap between platform and train.
Table 9. Comparison between behaviours of PRM and those of regular passengers (Note: The differences are that the regular passengers were moving faster than normal, while PRM were spending more time next to obstacles or not looking straight ahead).
The risk-taking behaviours of regular passengers and those with reduced mobility were compared in two ways: the risk-taking rates before entering risky locations, and while in them (); and the risk-taking rates before boarding and after alighting from a train ().
Regular and PRM passengers tended to have a similar rate of risk-taking behaviour before entering risky locations; the slight difference between the two groups being not statistically significant (one is within the confidence interval of the ratio of the two rates). In contrast, the regular passengers had a statistically significant higher rate of risk-taking behaviour when in risky locations than those in the PRM group ().
Table 10. Comparison of risk-taking behaviour of regular passengers and PRM before entering, and while in risky locations (Note: Rates of risk-taking behaviour before entering risky location were similar for PRM and regular passengers; PRM passengers had lower rate of risk-taking behaviour when in risky location).
The ratio of rates of risky behaviour showed that the regular passengers had a statistically significant higher rate of risky behaviour than the PRM group both before boarding and after alighting from a train ().
Table 11. Comparison of risk-taking behaviour of regular passengers and PRM before boarding and after alighting from a train (Note: The regular passengers had a higher rate of risky behaviour than the PRM group).
A comparison of verbal data () also shows that regular passengers were more confident than the PRM (2 vs. 0%) and had more time for looking around during their journey (Random Scanning 3 vs. 1%). PRM, on the other hand, expressed more concern over Time (4 vs. 2%) than regular passengers. PRM also expressed more Positive (4 vs. 1%) and Negative (6 vs. 3%) experiences overall. The most notable difference between the regular traveller and reduced mobility traveller relates to Information Seeking and Navigation.
Figure 2. Comparison of results for regular passengers and PRM (Note: Regular passengers demonstrated more planning/information seeking (14%), while PRM showed more planning/navigation (11%) during the journey.
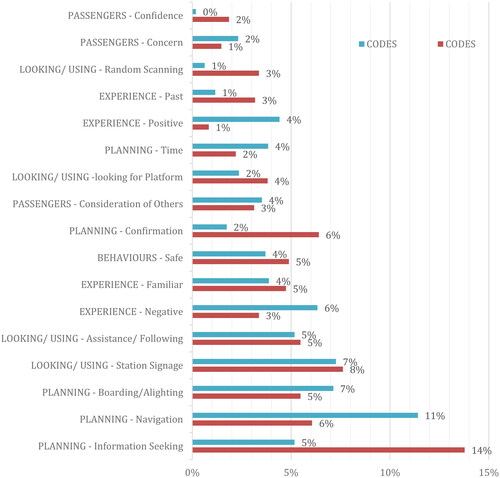
Regular passengers did more Information Seeking (14 vs. 5%) and Confirmation of that information (6 vs. 2%) during their journey than PRM. Journeys for PRM, on the other hand, were dominated by the process of Navigation (11 vs. 6%).
Despite some of these differences, the results from verbal data analysis generally follow similar patterns overall: Both studies were dominated by the Looking/Using and Planning categories. Passengers were endlessly seeking the information necessary to complete their journey successfully; for many, this information was related to the Platform or the Lift. In both studies, passengers used a variety of sources to meet their information needs, relying on Station Signage and the Assistance of others. There was very little evidence of the use of travel apps by either group. As a result of having to consult a variety of sources, participants in both studies felt that they had to piece together somewhat disconnected information during their journey.
A similar occurrence of (what we coined) Line vs. Destination in our earlier study (Larue et al. Citation2021) appeared in over 40% of transcripts for PRM. Passengers needed to know the name of the train line (the final destination) to find the station they wanted to get to.
Yeah and for me it’s a bit confused because… the screen shows all the destination but not the– the stops between this point and the destination [p103]
…obviously doesn’t say Fortitude Valley on the signs so just going yep, well… I need to find north line and– But it– Yeah, I know Brisbane pretty well, so it was probably okay, but for someone that doesn’t know they’d probably have to look at a map or find more information I guess. [125]
5. Discussion
A recent Deloitte report (2019) that evaluates the mobility of cities worldwide (Dixon et al. Citation2019) specifically points out aspects of service and inclusion. The authors say that exemplary cities are those which offer ‘widespread public transit coverage, affordable options, and user-friendly ways to access a variety of transportation modes’ (2) and that all urban residents should have access to transport. For PRM, access to transport is vital to quality of life (Church, Frost, and Sullivan Citation2000; Metz Citation2000; Tilley et al. Citation2017; Wilson and Norris 2006). Appropriate design of these environments to remove hazards and reduce the risk of injury is vital to the successful and sustainable growth of cities (Victorian Department of Health Citation1996; Zacharias, Zhang, and Nakajima Citation2011).
The observations and retrospective interviews used to investigate train station characteristics and passenger behaviour point to some underlying causes of STFs for PRM during train travel. Our study supports the need to recognise that individuals’ intrinsic nature, their behaviour, and even the objects they carry (Cave Citation2016; Feldman and Chaudhury Citation2008; Ozanne-Smith et al. Citation2008), are factors that impact safety in urban transport environments. This may explain why attempts to improve safety through simple engineering solutions may be ineffective. We suggest that the likelihood of a PRM enduring an STF incident depends on how accessible the environment is.
Out of the known risky locations, participants were most exposed to obstacles. The most common obstacles were taller than waist-height obstacles. The literature suggests (DavisCitation1993; Aziz and Robinovitch Citation2011) that such obstacles may not result in the highest risk of slip, trips, and falls. However, participants also had to navigate around a significant number of shorter than waist-height obstacles, such as chairs, tables, and wet floor warning posts. These may be of higher concern for safety, given their higher likelihood to result in a slip, trip, or fall, with exposure only slightly lower than other obstacles. They are even more concerning as such objects are temporary and their location varies. Wet floor warning signs suggest also a heightened risk due to wet surfaces. Our findings suggest that rail operators should consider obstacles, particularly lower and temporary ones to mitigate slips, trips, and falls.
There are often other people present at the railway stations. They may help (e.g. provide correct directions), play no meaningful role, or distract a passenger’s navigation (e.g. blocking a person’s vision) (Bird Citation2008). They should be considered as potential obstacles (Rossmore MCA Limited Citation2005) distracting a passenger’s navigation, potentially leading to unseen hazards and increased possibility for STFs.
While our research illustrates high risk-taking behaviour by PRM, we suggest that this is not an intentional disregard for safety. Our participants essentially saw themselves as acting in a safe manner, and this was apparent in their lower rates of risk-taking behaviour when they were in risky locations. This is also supported by this study’s finding indicating that PRM passengers generally take fewer risks when navigating stations as compared to regular passengers. While they were mindful of the gap and identified strategies to reduce its risk, they expressed concern and frustration caused by inconsistencies in the gap across the network. Risky behaviours, such as time spent in the vicinity of perceived obstacles (e.g. other people) may be explained by the finding that our passengers’ journeys were dominated by navigation in which they frequently sought help from others. In addition, they described piecemeal information provision where relevant travel information, such as train times and platform numbers and locations, was gathered from several different locations and was not presented in the format that passengers expected. PRM in this study, for example, often struggled to locate the location of the exit or the lift, or even the signs for the lift. This might explain why regular passengers show greater confidence and more looking around for information than PRM passengers.
We now turn to focus on the barriers created for various groups of people by the very nature and complexity of transport systems. Our results point to poor signage, poor information dissemination, and inconsistences across the network as factors that contribute to STFs. In this way, our research supports the notion that the barriers experienced may relate to, ‘network coverage and service patterns, personal security’ (Church, Frost, and Sullivan Citation2000, 198) and concerns about the risk of injuries (Burkhardt, McGravock, and Nelson Citation2002; Church, Frost, and Sullivan Citation2000; Wong et al. Citation2018). In agreement with Kyriakidis, Hirsch, and Majumdar (Citation2012), we suggest that improved information provision and/or placement within stations may be an effective way to reduce the risk of STFs.
Thus, the four main recommendations to improve safety, accessibility, and mobility for PRM are as follows:
Consideration of the navigation paths across train stations for PRM
Improvement of line of sight in station design and information provision (both aspects should prioritise the lift and platforms)
Provision of ‘safe spaces’ out of the flow of traffic, with good line of sight to allow people to stop and gather their bearings in unfamiliar locations
Consistency in physical infrastructure across the network (in particular, levelling of the gap between the platform and the train where possible).
There are many new digital solutions aimed at improving accessibility and information provision in urban transport systems (dell’Olio, Ibeas, and Cecín Citation2010; Foell, Rawassizadeh, and Kortuem Citation2013; Paulley et al. Citation2006). Digital services for accessibility and independent mobility are becoming widely available. Different frameworks have been developed. However, they must be implemented carefully (Pihlajamaa et al. Citation2020). We recommend that several of these be maintained and/or leveraged for future applications. They include multiple methods of information communication, such as auditory communication; visual text and icons; and multiple information displays and locations. However, in light of the fact that potential solutions are automated, we also recommend that transport services maintain staff levels for the provision of personal assistance.
Our research contributes to knowledge in safety domain in two main ways. First, we describe a non-homogenous group of people that all have some level of reduced mobility. In this way, we broaden the understanding of what it means to experience urban travel with reduced mobility. In some instances, reduced mobility may be caused by ageing or by a temporary injury. However, the same challenges can be experienced by people who negotiate this travel with luggage or small children. These perspectives are important to the development of sustainable mobility solutions that reduce the barriers to travel for PRM (Steg and Gifford Citation2005; Tilley et al. Citation2017). Our study also compliments the work of Waterson et al. (Citation2016) by identifying the dominant risky locations and behaviours as possible underlying causes of STFs for people with reduced mobility. This can also be applied to predict the potential risk based on underlying causes of STFs.
Second, while many other studies use self-reporting techniques, such as questionnaires or diary studies, our video observations and retrospective protocol provide firsthand accounts of the travel experience. Our study highlights behavioural activities and strategies, such as standing off to one side, asking for help, and using the lift. It also highlights needs that go beyond spatial interior architecture and engineering mitigations; for example, passengers’ need to have information presented in a cohesive and accessible way that supports the successful navigation of their journey.
While data was collected in Queensland, this research—including its methodology, design, data analysis, and general findings—is transferable to other inner-city train stations. Future work should consider the impact of travel during peak-hours, longer journeys to outer-suburban stations, or journeys that require connections across the integrated urban transport network.
Future work may also seek a deeper understanding of some of the differences in travel for PRM and others. For example, such differences may simply be the result of the predisposition of passengers or of their varying levels of familiarity, experience, need, or pre-planning. It is not known how much planning may have been undertaken by passengers of these studies before leaving home. Other areas for future work may focus specifically on distinct elements of information provision, such as the impact of station/destination names versus line names; platform information; departure times (time to board/alight); and lift location. We also suggest further consideration of the importance and impact of line of sight in navigation.
6. Limitations
This research has its limitations, and we acknowledge these as follows:
Participant bias: at times, participants stated that when choosing between the stairs, lift, or escalator, their choice was based on providing a variety of information ‘for the study’.
Researcher prompts: Given the focus on STFs, participants were specifically asked about their experience of boarding and alighting from the train. It could be argued that researcher prompts about The Gap during the interviews may have increased the instances of The Gap code in the data. Limited information: It is not known how much pre-planning (e.g. at-home use of travel apps) passengers might have undertaken.
Retrospective interviews: The limits of recall of subjective past information were considered. To alleviate this (i) each participant was interviewed within a week of the video recording and (ii) the method was used in combination with observations and quantitative methods.
Coding by only one coder: Video data were coded by one researcher only. This should have had limited effects on the findings, given that this researcher had used the coding scheme in a previous study. That study was coded by multiple researchers (Larue et al. Citation2021) and was shown to have an effective level of inter-rater reliability.
Experience/familiarity: Passenger experience/familiarity with the stations and their journeys was not measured.
7. Conclusion
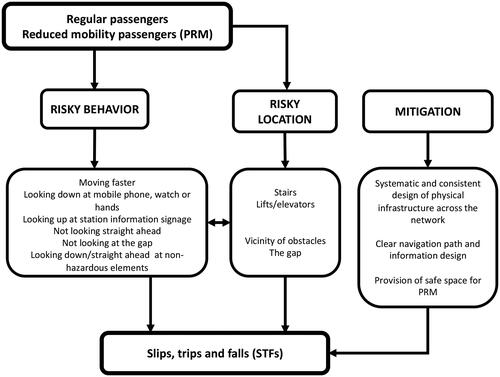
Our study identified the dominant risky locations and behaviours during urban rail travel—factors that could be considered as underlying causes of slips, trips, and falls for people with reduced mobility. Risky locations identified include the gap between the train and the platform, and the vicinity of obstacles. Risky behaviours include not looking straight ahead, looking up in a risky location, and not looking at the gap between the platform and train. While the people with reduced mobility in this study demonstrated high risk-taking behaviour, they personally felt that they demonstrated safe behaviours and consideration of others, and were frustrated by inconsistencies in both the visual and physical infrastructure across the system. On a positive note, however, passengers were appreciative of the assistance and advice they received from rail staff. This is sumarised in the STFs conceptual model in . This model addresses both regular and reduced mobility passengers. It stands on the premise that planning and design should satisfy needs of all passengers. It should be inclusive and systematic across the rail network.
Figure 3. Conceptual model of STFs and recommended approach to mitigate their underlying factors.
Safe and accessible transport services connect people to opportunities and activities. Such services are fundamental to supporting and encouraging the inclusion, involvement, and participation of people in their communities. To reduce the risk and potential for slips, trips, and falls, we suggest that transport operators can do more to support the mobility needs and, ultimately, the quality of life of people with reduced mobility.
Acknowledgements
The team also thanks the participants who took part in this study and Queensland Rail for their assistance with the organization of data collection on their premises. We would like to acknowledge Dr. Andrew Cave and Dr. Shital Desai for their contribution during the early stage of this project, and Ms. Alana Hawkins who participated in data collection for this stage. The team acknowledges Ms. Denise Scott for helping in editing this manuscript.
No potential conflict of interest was reported by the author(s).
Disclosure statement
Additional information
Funding
References
- Aziz, O., and S.N. Robinovitch. 2011. “An Analysis of the Accuracy of Wearable Sensors for Classifying the Causes of Falls in Humans.” IEEE Transactions on Neural Systems and Rehabilitation Engineering 19 (6): 670–676. doi:10.1109/TNSRE.2011.2162250.
- Ancell, D., and A. Graham. 2016. “A Framework for Evaluating the European Airline Costs of Disabled Persons and Persons with Reduced Mobility.” Journal of Air Transport Management 50: 41–44. doi:10.1016/j.jairtraman.2015.10.001.
- Atlas.ti. 2018. “Qualittaive Data Analisis Software.” https://atlasti.com/
- Banister, D., and A. Bowling. 2004. “Quality of Life for the Elderly: The Transport Dimension.” Transport Policy 11 (2): 105–115. doi:10.1016/S0967-070X(03)00052-0.
- Bentley, T. 2009. “The Role of Latent and Active Failures in Workplace Slips, Trips and Falls: An Information Processing Approach.” Applied Ergonomics 40 (2): 175–180. doi:10.1016/j.apergo.2008.04.009.
- Bird, S. 2008. “The Risk of Tripping Accidents on Public Footways.” Proceedings of the Institution of Civil Engineers-Municipal Engineer 161 (2): 129–136. doi:10.1680/muen.2008.161.2.129.
- Boelens, C., E.E. Hekman, and G.J. Verkerke. 2013. “Risk Factors for Falls of Older Citizens.” Technology and Health Care 21 (5): 521–533. doi:10.3233/THC-130748.
- Bowman, R. 2000. “Slip Resistance—Adjusting to a New Paradigm.” Proceedings of the Human Factors and Ergonomics Society Annual Meeting 44 (28): 490–493. doi:10.1177/154193120004402820.
- Burkhardt, J., A. McGravock, and C. Nelson. 2002. Improving Public Transit Options for Older Persons. Technical Report Transit Cooperative Research Program Report No. 82, Transportation Research Board, Washington, DC, USA.
- Cave, A.R. 2016. “Passengers’ Intuitive Navigation in Airports.” PhD diss., Queensland University of Technology. Retrieved from https://eprints.qut.edu.au/94935/
- Cave, A., A. Blackler, V. Popovic, and B. Kraal. 2013. “Passenger Familiarity and Intuitive Navigation within Airport Environments.” Consilience and Innovation in Design, Shibaura Institute of Technology, Tokyo, Japan. https://eprints.qut.edu.au/62601/
- Cave, A., A. Blackler, V. Popovic, and B. Kraal. 2014. “Examining Intuitive Navigation in Airports.” Design Research Society Conference DRS2014, Umea, Sweden. https://eprints.qut.edu.au/71897/
- Cave, A., R. Blackman, G. Larue, and V. Popovic. 2015. “Slips, Trips and Falls on Trains and at Railway Stations.” Stage 1. ACRI (Research Report Unpublished).
- Chang, W.R., S. Leclercq, T.E. Lockhart, and R. Haslam. 2016. “State of Science: Occupational Slips, Trips and Falls on the Same Level.” Ergonomics 59 (7): 861–883. doi:10.1080/00140139.2016.1157214.
- Church, A., M. Frost, and K. Sullivan. 2000. “Transport and Social Exclusion in London.” Transport Policy 7 (3): 195–205. doi:10.1016/S0967-070X(00)00024-X.
- Crenshaw, J.R., N.J. Rosenblatt, C.P. Hurt, and M.D. Grabiner. 2012. “The Discriminant Capabilities of Stability Measures, Trunk Kinematics, and Step Kinematics in Classifying Successful and Failed Compensatory Stepping Responses by Young Adults.” Journal of Biomechanics 45 (1): 129–133. doi:10.1016/j.jbiomech.2011.09.022.
- Davis, F.D. 1993. “User Acceptance of Information Technology: System Characteristics, User Perceptions and Behavioral Impacts.” International Journal of Man-Machine Studies 38 (3): 475–487. doi:10.1006/imms.1993.1022.
- dell’Olio, Luigi, Angel Ibeas, and Patricia Cecín. 2010. “Modeling User Perception of Bus Transit Quality.” Transport Policy 17 (6): 388–397. doi:10.1016/j.tranpol.2010.04.006.
- Dickerson, Anne E., Lisa J. Molnar, David W. Eby, Geri Adler, Michel Bédard, Marla Berg-Weger, Sherrilene Classen, Daniel Foley, Amy Horowitz, Helen Kerschner, Oliver Page, Nina M. Silverstein, Loren Staplin, and Leonard Trujillo. 2007. “Transportation and Aging: A Research Agenda for Advancing Safe Mobility.” The Gerontologist 47 (5): 578–590. doi:10.1093/geront/47.5.578.
- Dixon, S., H. Irshad, D.M. Pankratz, and J. Bornstein. 2019. “The 2019 Deloitte City Mobility Index.” Deloitte Insights 2–11.
- Feldman, F., and H. Chaudhury. 2008. “Falls and the Physical Environment: A Review and a New Multifactorial Falls-Risk Conceptual Framework.” Canadian Journal of Occupational Therapy 75 (2): 82–95. doi:10.1023/A:1022687727493.
- Ferrari, L., M. Berlingerio, F. Calabrese, and J. Reades. 2014. “Improving the Accessibility of Urban Transportation Networks for People with Disabilities.” Transportation Research Part C: Emerging Technologies 45: 27–40. doi:10.1016/j.trc.2013.10.005.
- Foell, S., R. Rawassizadeh, and G. Kortuem. 2013. “Informing the Design of Future Transport Information Services with Travel Behaviour Data.” Paper Presented at the Proceedings of the 2013 ACM Conference on Pervasive and Ubiquitous Computing Adjunct Publication, Zurich, Switzerland. doi:10.1145/2494091.2499219.
- Gallagher, B.A., P.M. Hart, C. O'Brien, M.R. Stevenson, and A.J. Jackson. 2011. “Mobility and Access to Transport Issues as Experienced by People with Vision Impairment Living in Urban and Rural Ireland.” Disability and Rehabilitation 33 (12): 979–988. doi:10.3109/09638288.2010.516786.
- Gilhooly, M., K. Hamilton, M. O'Neill, J. Gow, N. Webster, F. Pike, and D. Bainbridge. 2002. “Transport and Ageing: Extending Quality of Life for Older People via Public and Private Transport.”
- Gielo-Perczak, K., W.S. Maynard, and A. DiDomenico. 2006. “Multidimensional Aspects of Slips and Falls.” Reviews of Human Factors and Ergonomics 2 (1): 165–194. doi:10.1177/1557234X0600200107.
- Grabiner, M.D., M.L. Bareither, S. Gatts, J. Marone, and K.L. Troy. 2012. “Task-Specific Training Reduces Trip-Related Fall Risk in Women.” Medicine and Science in Sports and Exercise 44 (12): 2410–2414. doi:10.1249/MSS.0b013e318268c89f.
- Gunatilaka, A., A. Clapperton, and E. Cassell. 2005. “Preventing Home Fall Injuries: structural and Design Issues and Solutions.” Hazard 59: 1–24. http://webfarm.its.monash.edu.au/miri/research/research-areas/home-sport-and-leisure-safety/visu/hazard/haz59.pdf
- Kong, P.W., J. Suyama, and D. Hostler. 2013. “A Review of Risk Factors of Accidental Slips, Trips, and Falls among Firefighters.” Safety Science 60: 203–209. doi:10.1016/j.ssci.2013.07.016.
- Kyriakidis, M., R. Hirsch, and A. Majumdar. 2012. “Metro Railway Safety: An Analysis of Accident Precursors.” Safety Science 50 (7): 1535–1548. doi:10.1016/j.ssci.2012.03.004.
- Larue, G., V. Popovic, M. Legge, C. Brophy, and R. Blackman. 2021. “Safe Trip: Factor Contributing to Slip, Trip and Fall Risk at Train Stations.” Applied Ergonomics 92: 103316. doi:10.1016/j.apergo.2020.103316.
- Leamon, T.B. 1992. “The Reduction of Slip and Fall Injuries: Part I-Guidelines for the Practitioner.” International Journal of Industrial Ergonomics 10 (1–2): 29–34. doi:10.1016/S1572-347X(00)80012-9.
- Li, K.W., W.R. Chang, T.B. Leamon, and C.J. Chen. 2004. “Floor Slipperiness Measurement: Friction Coefficient, Roughness of Floors, and Subjective Perception under Spillage Conditions.” Safety Science 42 (6): 547–565. doi:10.1016/j.ssci.2003.08.006.
- Lockhart, T., J. Woldstad, and J. Smith. 2003. “Assessment of Slip Severity Among Different Age Groups.” Metrology of Pedestrian Locomotion and Slip Resistance, ASTM STP 1424 (0118): 17–32.
- McGorry, R.W., A. DiDomenico, and C.C. Chang. 2010. “The Anatomy of a Slip: Kinetic and Kinematic Characteristics of Slip and Non-Slip Matched Trials.” Applied Ergonomics 41 (1): 41–46. doi:10.1016/j.apergo.2009.04.002.
- Metz, D.H. 2000. “Mobility of Older People and Their Quality of Life.” Transport Policy 7 (2): 149–152. doi:10.1016/S0967-070X(00)00004-4.
- Miles, M., M. Huberman, and J. Saldana. 2014. Qualitative Data Analysis: A Sourcebook of New Methods. 3rd ed. London: Sage Publication.
- Noldus. 2018. “The Observer XT.” http://www.noldus.com/human-behavior-research/products/1/the-observer-xt
- Office of the National Rail Safety Regulator. 2013. “Annual Safety Report, 2012–13.” https://www.onrsr.com.au/__data/assets/pdf_file/0016/4930/NRSR017-Annual-Safety-Report-FA-web.pdf
- Ozanne-Smith, J., J. Guy, M. Kelly, and A. Clapperton. 2008. The Relationship Between Slips, Trips and Falls and the Design and Construction of Buildings.
- Paulley, Neil, Richard Balcombe, Roger Mackett, Helena Titheridge, John Preston, Mark Wardman, Jeremy Shires, and Peter White. 2006. “The Demand for Public Transport: The Effects of Fares, Quality of Service, Income and Car Ownership.” Transport Policy 13 (4): 295–306. doi:10.1016/j.tranpol.2005.12.004.
- Pihlajamaa, O., Kostiainen, J. Federley, M. Kuusisto, and Luhtala, M. 2020. “Framework for Developing Solutions for Accessible Mobility: Potential of IoT Solutions in Public Transportation.”. Proceedings of 8th Transport Research Arena TRA, 27–30.
- Queensland Transport and Main Roads. 2013. “Rail Safety Regulator’s Report 2012–13.”
- RSSB (Rail Standards Safety Board) 2014. “Annual Safety Performance Report.” Accessed March 2, 2015. http://www.rssb.co.uk/Library/risk-analysis-and-safety-reporting/ 2014-07-aspr-2013-14-full-report.pdf
- Rossmore MCA Limited. 2005. Research into the Behavioural Aspects of Slips and Trip Accidents and Incidents. HSE Books.
- Saldaña, J. 2009. The Coding Manual for Qualitative Researchers. Sage [EBL version]. http://www.qut.eblib.com.ezp01.library.qut.edu.au/patron
- Steg, L., and R. Gifford. 2005. “Sustainable Transport and Quality of Life.” Journal of Transport Geography 13 (1): 59–69. doi:10.1016/j.jtrangeo.2004.11.003.
- Swensen, E.E., J.L. Purswell, R.E. Schlegel, and R.L. Stanevich. 1992. “Coefficient of Friction and Subjective Assessment of Sliper Work Surfaces.” Human Factors 34 (1): 67–77. doi:10.1177/001872089203400108.
- Tilley, S., C. Neale, A. Patuano, and S. Cinderby. 2017. “Older People’s Experiences of Mobility and Mood in an Urban Environment: A Mixed Methods Approach Using Electroencephalography (EEG) and Interviews.” International Journal of Environmental Research and Public Health 14 (2): 151. doi:10.3390/ijerph14020151.
- Tobii Technology. 2019. https://www.tobii.com/
- Victorian Department of Health. 1996. Preventing Falls in Public Places: Challenge and Opportunity for Local Government. Lismore: Victorian Department of Health.
- Wang, T.-Y., T. Bhatt, F. Yang, and Y.C. Pai. 2012. “Adaptive Control Reduces Trip-Induced Forward Gait Instability among Young Adults.” Journal of Biomechanics 45 (7): 1169–1175. doi:10.1016/j.jbiomech.2012.02.001.
- Waterson, P.E., V.L. Kendrick, B. Ryan, G.T. Jun, and R.A. Haslam. 2016. “Probing Deeper into the Risks of Slips, Trips and Falls for an Ageing Rail Passenger Population.” IET Intelligent Transport Systems 10 (1): 25–31. doi:10.1049/iet-its.2015.0047.
- Wilson, J.R., and B.J. Norris. 2006. “Human Factors in Support of a Successful Railway: A Review.” Cognition, Technology & Work 8 (1): 4–14. doi:10.1007/s10111-005-0016-6.
- Wong, R.C.P., W.Y. Szeto, L. Yang, Y.C. Li, and S.C. Wong. 2018. “Public Transport Policy Measures for Improving Elderly Mobility.” Transport Policy 63: 73–79. doi:10.1016/j.tranpol.2017.12.015.
- Yeoh, H.T., T.E. Lockhart, and X. Wu. 2013. “Non-Fatal Occupational Falls on the Same Level.” Ergonomics 56 (2): 153–165. doi:10.1080/00140139.2012.746739.
- Zacharias, J., T. Zhang, and N. Nakajima. 2011. “Tokyo Station City: The Railway Station as Urban Place.” URBAN DESIGN International 16 (4): 242–251. doi:10.1057/udi.2011.15.
Appendix A. Coding scheme for video data (Larue et al. Citation2021 updated)
Appendix B. Coding scheme for verbal data (Larue et al. Citation2021 updated)