
 ?Mathematical formulae have been encoded as MathML and are displayed in this HTML version using MathJax in order to improve their display. Uncheck the box to turn MathJax off. This feature requires Javascript. Click on a formula to zoom.
Abstract
The Sustainable system-of-systems (SSoS) approach, complemented with econometric analysis was used to address China’s decarbonisation problem, i.e. selecting fossil fuel consumption sources to be reduced in various regions to meet CO2 reduction targets with minimal effect on population and economic growth. In the SSoS, the micro-level system is represented by residents’ health expenditure, the meso-level system by industry’s CO2 emissions intensity, and the macro-level system by the government’s achievement of economic growth. Regional panel data from 2009 to 2019 were used in an econometric analysis conducted using structural equation modelling. The results show that health expenditure was affected by CO2 emissions from the consumption of raw coal and natural gas. To support economic growth, the government should reduce raw coal consumption. For CO2 emissions reduction, industry in the eastern region should reduce raw coal consumption. The key advantage is SSoS with econometrics offers a way to reach a common goal among stakeholders.
Practitioner summary: This research shows that the use of the SSoS approach, complemented with an econometric analysis of key social, economic, and natural capital data, can address a complex decarbonisation problem facing a nation (China, in the present case) while considering the goals of all stakeholders (the government, industrial communities, and residential communities).
Abbreviations: CEADs: Carbon Emissions Accounts and Datasets for Emerging Countries; CEIC: CEIC Global Database; GRPS: World Economic Forum’s Global Risks Perception Survey; HFE: human factors/ergonomics; ML-SEM: maximum likelihood estimation method; NDRC: National Development and Reform Commission of China; SEM: structural equation modelling; SSoS: Sustainable system-of-systems; TBL: triple bottom line
1. Introduction
China, as the world’s leading industrial economic powerhouse, is facing more frequent extreme weather events, with heatwaves, heavy rainstorms, and rising sea levels in coastal regions due to climate change. Years of rapid urbanisation and industrial growth have made China one of the world’s largest sources of primary greenhouse gas emissions (Yu, Zhai, and Chen Citation2018). The World Economic Forum’s Global Risks Perception Survey (GRPS) indicates that climate-related risks are clear and present dangers in the short term, and existential threats in the long term (World Economic Forum Citation2021). Despite China’s many investments in infrastructure aimed at mitigating the harm of natural disasters, concerns have been raised about how the country is tackling climate change.
Prior research indicates that the consumption of fossil fuels plays a vital role in economic growth (Al-mulali and Binti Che Sab Citation2012; Luqman, Ahmad, and Bakhsh Citation2019; Magazzino and Elliott Citation2016). However, the research also shows that fossil fuel combustion is the main source of global greenhouse gas emissions (Tong et al. Citation2019). Greenhouse gas emissions from fossil fuel combustion in China show an elevated level of CO2, which exacerbates climate change. Key CO2 emitters include electric power plants, chemical manufacturing facilities, mining operations, deforestation, and petroleum-powered vehicles (He et al. Citation2022). The impact of climate change in the form of natural disasters can be felt across entire regions, leading to a cascading loss of economic and social welfare, including deterioration of public health with increased levels of disease and death (Zhao Citation2020). Hence, there is a need to devise and implement feasible climate change mitigation policies that can tackle extreme weather risks. Such policies are critical for China’s sustainable socio-economic development (Cai et al. Citation2017).
While policymaking that responds effectively to climate change is perhaps the most pressing social challenge of recent decades, it can have unexpected and undesirable results. One example of this is the industrial powerhouse supply crisis of September 2021, which was caused by an extreme case of energy rationing. Sixteen provincial-level jurisdictions in China’s south and northeast regions, tasked with meeting the Chinese government’s annual carbon emission reduction targets, began to ration electricity without giving adequate warning to industry and the public (Wang and Zhou Citation2021), resulting in wholesale power cuts. The case is an example of how China’s local governments have been forced to implement rushed measures to meet decarbonisation targets. It has also raised concerns about how China can transition to a low-carbon economy without interrupting the country’s economic production activities.
The concept of green ergonomics, proposed by Thatcher (Citation2013), calls for an emphasis on sustainable connections between human and natural systems, hence, natural capital should not be seen as existing independently of the social and economic capital that facilitates sustainable connections. In addressing a range of human factors/ergonomics (HFE) responses to how sustainable development of humans and nature might be achieved, thereby mitigating risk events, Thatcher and Yeow (Citation2016a, 2016Citationb) proposed the sustainable system-of-systems (SSoS) approach, which addresses the role of HFE in dealing with extreme natural risk events. The SSoS approach offers a broader approach that is necessary for dealing with the intertwined complex relationships when addressing sustainability issues such as global climate change (Thatcher and Yeow Citation2016b). It draws from the green ergonomics concept that integrates the ecological model with the social models of HFE systems to create a new approach that includes the sustainability concept into HFE (Thatcher Citation2013; Thatcher and Yeow Citation2018). The SSoS approach has been applied in many HFE studies, e.g. studies related to electric vehicle design (Thatcher and Yeow Citation2016a); the HFE issues faced by raft fishermen and the HFE responses in extreme natural events (Thatcher and Yeow Citation2016b); the HFE issues on organisational sustainability reporting (Samudhram et al. Citation2016); the design of workplace layout in green building (Thatcher and Yeow Citation2018) and the design of greywater treatment system (Thatcher Citation2021).
As written in the call for this special issue entitled ‘Applying E/HF systems thinking to complex global problems,’ systems ergonomics has a critical role to play in addressing the complex global problems reported by the World Economic Forum such as climate change, human-led environmental damage, pandemic disease, digital inequality, etc. (Bolis et al. Citation2023; Thatcher et al. Citation2018; World Economic Forum Citation2021; Salmon et al. Citation2022). Despite this role, empirical and practical studies that consider broader issues, such as those related to climate change, are lacking (Thatcher et al. Citation2018; Thatcher et al. Citation2020). Few studies have proposed systems ergonomics approaches to address climate change issues. For instance, Meshkati et al. (Citation2016) proposed a macro-systems ergonomics conceptual framework to illustrate the importance of regional interoperability and resilience in energy. Siemieniuch, Sinclair, and Henshaw (Citation2015) illustrated different scenarios of systems ergonomics to emphasise the importance of sustainable manufacturing processes in mitigating carbon emissions and low energy consumption efficiency. Some of the studies used the SSoS approach. For example, Sinclair, Henshaw, and Henshaw (Citation2021) adopted the SSoS approach to construct a conceptual framework of a sustainable community to address the issue of climate change. Zarte, Pechmann, and Nunes (Citation2019) adopted the SSoS approach to construct their conceptual framework of sustainable production planning and controlling in manufacturing enterprises, which considers the well-being of local and global communities, fossil fuel consumption efficiency, and carbon emissions. Cheah et al. (Citation2018) adopted the SSoS approach to construct a conceptual framework to reduce CO2 emissions by reducing the waste of household electricity. Their research offered strategies to overcome impediments and improve motivations to engage in responsible electricity consumption practices. Guibourdenche et al. (Citation2019) adopted the SSoS approach for their qualitative study on intra- and inter-organisational electricity consumption efficiency by including various stakeholders such as residential users and electricity service providers.
This study fills the research gap by extending an existing systems ergonomics approach and providing an empirical and practical study of its application to solve the climate change issue of China’s decarbonisation problem. The study’s objective is to determine which sources of fossil fuel energy consumption (i.e. raw coal, crude oil, and natural gas) in three regions of China (i.e. Eastern, Central and Western) should be reduced to meet the country’s decarbonisation target. To make this determination, the study extends the SSoS approach by combining it with econometric analysis. This study is useful for policymakers and ergonomists as it devises a method of meeting decarbonisation targets that assists all stakeholders (government, industry, and residential communities) in achieving a common goal so that the implementation of a decarbonisation policy becomes a collective endeavour. It enables decarbonisation decisions to balance conflicting economic and public health issues in the transition to a low-carbon economy. The parent-child concept in the nested hierarchy of systems and the revolt and remember processes in the complex adaptive cycles of the SSoS approach were utilised to establish the conceptual framework of this study (Thatcher and Yeow Citation2016a, 2016Citationb, Citation2019). Additionally, structural equation modelling (SEM) was used to conduct the econometric analysis. This study is in line with the call of the special issue as we apply existing HFE systems thinking, the SSoS approach, to solve the complex problem of how to decarbonise. This study also contributes a research case that bridges the cross-disciplinary fields of HFE and economics, integrating HFE with other disciplines as encouraged by Thatcher et al. (Citation2018).
The rest of this paper is organised as follows. Section 2 presents a literature review while Section 3 outlines the research methodology, including the SSoS framework and empirical modelling, used in this study. Section 4 presents the results of the data samples, SEM models, and the regression analysis. Section 5 offers a discussion of the solution to the decarbonisation problem and the advantage of the SSoS approach complemented with econometric analysis. Finally, Section 6 provides the paper’s conclusion, limitations, and suggestions for future research.
2. Literature review
2.1. China’s decarbonisation objectives and target
In 2021, the Chinese government issued the National Working Guidance for Carbon Dioxide Peaking and Carbon Neutrality to tackle climate change. The objectives and timing for achieving decarbonisation and carbon dioxide peaking and carbon neutrality were established with three implementation phases as shown in (National Development and Reform Commission of China (NDRC) Citation2021). China’s CO2 emission peaking target is to achieve climate neutrality, where the country’s CO2 emissions do not exceed the maximum level deemed conducive to human survival, by 2030. China’s target for carbon neutrality is to achieve net-zero carbon dioxide emissions before 2060 by attaining a balance between anthropogenic CO2 emissions and carbon dioxide removal from the natural environment through the use of carbon sinks (Zou et al. Citation2021). As depicted in the objectives of each phase, the Chinese government emphasised the optimisation of the efficient use of energy by key industries as an important foundation of the country’s CO2 peaking and carbon neutrality efforts.
Table 1. Main measures in China’s National Working Guidance for carbon dioxide peaking and carbon neutrality.
In addition, the Chinese government is required to fulfil its commitment to the Paris Agreement by increasing the share of non-fossil fuels used in its domestic energy consumption to 20% by 2025 (Zhou et al. Citation2019). The government has undertaken other endeavours to stem the tide of climate change. For instance, it established the national carbon emission trading exchange in Shanghai in July 2021. It has also been implementing a nationwide reforestation program to help attain its carbon neutrality target. Driven by afforestation and other forest protection policies such as natural forest protection, returning farmland to forests, and shelterbelt construction, China’s forest coverage gradually expanded to 21.6% in 2017 (Liu et al. Citation2020).
Despite these positive activities, the Chinese government has been criticised for poor environmental safety standards and insufficient investment in infrastructure for the transition to a green economy. This is because the majority of China’s fiscal policies related to economic stimulus over the past decades have targeted the development of coal-fired power plants (Tracy et al. Citation2017). The country has generated massive CO2 emissions from burning coal, mostly to generate electricity for heavy industry and residential heating (Zhao. et al. Citation2020). Thus, the Chinese government now faces the dilemma of balancing provincial economic growth while transitioning to a low-carbon economy (Wang et al. Citation2015).
2.2. China’s energy management policies
China’s energy management policies are mainly implemented through a top-down approach (i.e. a command-and-control process), with the central government imposing administrative assessments of how local governmental cadres are reducing greenhouse gas emissions (Lo, Li, and Chen Citation2020). To obtain high assessment scores and avoid penalties from the central government, local government cadres tend to pursue activities that have a short-term impact, such as closing industries that show inefficient energy consumption. The implementation of such policies eventually led to the shutdown of an inordinate amount of industrial production capacity, which harmed national economic growth targets (Wang and Chen Citation2015). One important question for the top-down approach would be how decision-making and accompanying action plans can balance and effectively manage China’s energy consumption efficiency against economic growth and public health. Studies show that the effectiveness of the implementation of environmental policies in China remains low (Yang et al. Citation2018). The Chinese government tends to respond to public opinion in a somewhat limited manner (Meng and Su Citation2021). To be effective, the top-down approach must consider all stakeholders (government, industry, and residential communities).
2.3. Relationship between CO2 emissions, economic growth, and healthcare expenditure
The literature shows a positive bi-directional causal link between CO2 emissions and economic growth in OECD countries and countries of sub-Saharan Africa (Wang, Hsueh, et al. Citation2019; Zaidi and Saidi Citation2018). There is also evidence of uni-directional causality from GDP growth to CO2 emissions in Malaysia (Saboori, Sulaiman, and Mohd Citation2012), while a significant, long-run, non-linear relationship exists between CO2 emissions and economic growth in Singapore and Thailand (Saboori and Sulaiman Citation2013) and 25 OECD countries (Jebli, Youssef, and Ozturk Citation2016). Likewise, there is evidence of long-term and short-term relationships between economic growth and CO2 emissions among the G7 nations (Cai, Sam, and Chang Citation2018).
Regarding healthcare expenditure and economic growth, previous research shows that these are cointegrated in the OECD countries (Baltagi and Moscone Citation2010; Gerdtham and Löthgren Citation2002). However, Wang (Citation2011) found that the correlation between healthcare expenditure and economic growth is mixed among the OECD countries. Murthy and Okunade (Citation2016) and Hao et al. (Citation2018) found that healthcare expenditure continues to grow significantly with economic growth, improvements in medical care technology, and an ageing demographic structure. Nonetheless, Ke, Saksena, and Holly (Citation2011) state that healthcare expenditure can be negatively associated with GDP when economic growth is declining.
Furthermore, a strand of research shows that CO2 emissions degrade environmental quality and attenuate public health by increasing the presence of greenhouse gases. For instance, CO2 emissions and other environmental pollutants were found to exert negative health effects on the Chinese population (Lu et al. Citation2017), thus, increasing public healthcare expenditure per capita (Chaabouni and Saidi Citation2017; Chaabouni, Zghidi, and Mbarek Citation2016). While the findings may be piecemeal, it is clear from them that research investigating the relationship between CO2 emissions and healthcare expenditure remains underdeveloped (Wang, Asghar, et al. Citation2019).
2.4. Sustainable system-of-Systems (SSoS)
Thatcher and Yeow (Citation2016b) propose the SSoS as a sustainability approach that emphasises the importance of working with a broad understanding of the complex, mutualistic relationships between the various levels (micro, meso, and macro) of sustainable systems. Sustainable systems can be referred to as system that reach their full or expected lifespan. A target system can be referred to as a system under investigation in a sustainable system. Any threat to the system that causes it to not reach its potential lifespan (e.g. natural disasters if the target system is referring to climate change) means that the system is not sustainable. Notably, the SSoS approach is a systems ergonomics approach as it adopts Wilson’s (Citation2014) systems ergonomics concept of the ‘parent-sibling-child’ system that emphasises on how each succeeding broader scope of consideration encapsulates smaller scopes (Thatcher and Yeow Citation2016a; Siemieniuch and Sinclair Citation2014). It also includes notions/features in systems ergonomics such as systems focus, interactions, and emergence (Thatcher and Yeow Citation2016a, 2016Citationb; Wilson Citation2014).
Thatcher and Yeow (Citation2019) state that, in the best-case scenario, an intervention using the SSoS approach can be executed when a target system is late in the conservation stage and the intervention will move the target system into the release stage. The intervention may cause the target system to reorganise existing relationships and lose its existing structure. To solve the sustainability problem, nested systems should align their goals with the sustainability of the larger natural system. If the target system in the SSoS is not in or near the release stage, then it will be necessary to look at interventions with the parent (top-down), child (bottom-up), or sibling (horizontal) systems, depending on the stage of the target system.
As child systems have an adaptive cycle that is faster than the target system, natural adaptive changes in the child systems can be leveraged to prompt changes in the target system (Thatcher and Yeow Citation2019). Holling, Gunderson, and Ludwig (Citation2002) referred to the stabilising influence from parent systems as a ‘remember’ process and the disruption from child systems as a ‘revolt’ process. The nested hierarchy of interacting adaptive cycles is a ‘panarchy’ that, in SSoS nomenclature, is analogous to the child systems that revitalise the target system, and the parent systems that stabilise the target system. Hence, given the SSoS framework, policies to deal with climate change risks can be devised to reflect the impacts or negative externalities of climate change events. The SSoS framework elucidates that it is not always necessary for policymakers to focus on intervening directly in a target system. Making changes to child systems that are ripe for change and reorganisation, once the driving factors have been correctly identified, will result in revolt processes that encourage the target system to shift in predictable ways (Thatcher and Yeow Citation2019).
3. Research methodology
3.1. SSoS framework
Following the SSoS approach of Thatcher and Yeow (Citation2016b), we developed the SSoS framework shown in for this study. The nested hierarchy of systems constitutes government as the parent system (the macro level), residential communities that might be affected by CO2 emissions as the child system (the micro level), and industrial communities that emit CO2 through their production activities as the target system (the meso level). The triple bottom line (TBL) goals are shown in the Figure. First, we consider energy consumption in the socio-economic sectors to represent the types of natural resources consumed in the economy, thus, we use the regional energy consumption of raw coal, crude oil, and natural gas-related fossil fuels as variables that represent types of natural capital. Second, we consider provincial GDP to lead to national economic growth. As such, we use the provincial GDP of the socio-economic sectors as a variable to represent economic capital. Finally, we assign healthcare expenditure to represent public health that can be negatively affected by CO2 emissions; thus, we use regional healthcare expenditure as a proxy variable to represent social capital. The key objective of this framework is to decide which fossil fuel sources (raw coal, crude oil, and natural gas) should be reduced to meet the country’s decarbonisation targets.
Figure 1. SSoS framework to address China’s decarbonisation problem.
(Note: The equations for the econometric analysis for each level are presented in the Section 3.3).
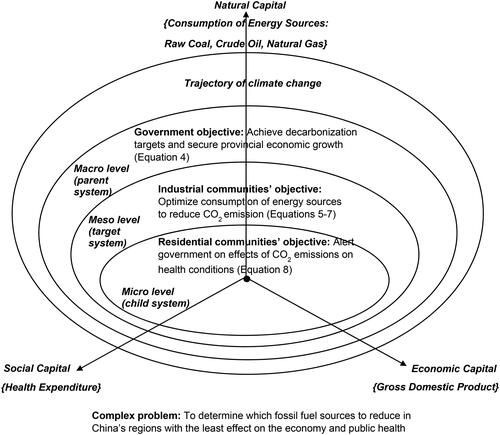
In this SSoS framework, none of the stakeholders should have dominant control over the others in the systems. Every stakeholder in the systems is interconnected when responding to the complex and changing circumstances that characterise climate change issues, and this reciprocal relationship coevolves within the systems. Each stakeholder develops a strong trust in the need for social participation and regards the implementation of the decarbonisation policy as a matter of stewardship. Each stakeholder will also have their own goals and conflicts of goals can increase the complexity of coordination across levels. Therefore, the challenge is to find a sufficient balance between the conflicting goals of achieving economic growth and protecting public health in the transition to a low-carbon economy.
Notably, the SSoS approach can guide decarbonisation policymakers to shift their focus from a conventional top-down approach to a wider bi-directional, bottom-up approach that involves interactions between each stakeholder at the macro, meso, and micro levels. Interaction between the various levels in the SSoS framework is vital, as this can generate transformational new outcomes. Notwithstanding that policymakers might be establishing genuine goals and measurements, their policymaking may be hampered by incomplete information if they have not acknowledged the missing components in the interactions between the levels in the SSoS framework.
3.2. Measurements
In this section, we present the comprehensive conceptual models that envisage a scenario of interactions between the variables at the macro, meso, and micro levels in the SSoS framework. First, we followed the current research by adopting the extended form of the Cobb-Douglas production function in economic theory to construct the production model of an economy (Akalpler and Hove Citation2019; Bloom, Canning, and Sevilla Citation2004; Chaabouni and Saidi Citation2017; Chaabouni, Zghidi, and Mbarek Citation2016; Lu et al. Citation2017; Oryani et al. Citation2021). The extended form of the Cobb-Douglas production function can be expressed as:
(1)
(1)
where Y denotes economic production output, A stands for the technology advancement level, K stands for capital, L represents labour force, and F represents energy consumption.
and
denote the output elasticity of capital, labour force, and energy consumption, respectively.
The literature shows that technological advancement can progress in tandem with stakeholders’ initiatives to fulfil the obligation to reduce CO2 emissions, promote green energy solutions, improve public health in society, and ensure sustainable economic growth (Oryani et al. Citation2021; Wang, Zeng, and Liu Citation2019). Following Oryani et al. (Citation2021), we defined technology advancement as a function of CO2 emissions E, and healthcare expenditure H, expressed as:
(2)
(2)
where
is a time-invariant constant, and
and
denote the technology advancement marginal propensity of CO2 emissions (E), and healthcare expenditure (H). By substituting EquationEquation (2)
(2)
(2) with EquationEquation (1)
(1)
(1) , and dividing both sides of EquationEquation (1)
(1)
(1) by labour force to obtain all series in per capita terms and emphasise the intervention in the socioeconomic activities, we further derived the extended form of the Cobb-Douglas production function as:
(3)
(3)
where
and
denote the GDP per capita marginal propensity of CO2 emissions, healthcare expenditure, stock of capital, and energy consumption, respectively.
3.3. Empirical model specification
Shan et al. (Citation2019) proposed a carbon balance assumption that assumes CO2 emissions from the three primary fossil fuels of raw coal, crude oil, and natural gas to be equal to the carbon contained in their total energy consumption. To explore the interrelationship between energy consumption and the CO2 emissions of the three primary fossil fuels, we followed Shan et al. (Citation2019) and applied the carbon balance assumption, decomposing each and
variable into three variables that denote the CO2 emissions and energy consumption of raw coal-, crude oil-, and natural gas-related fossil fuels, respectively.
Further, we drew on the extended form of the Cobb-Douglas production function to measure the marginal effects of the interrelationships of the variables, taking the natural logarithm of both sides of EquationEquation (3)(3)
(3) to gauge the marginal effects of the interrelationships. Subsequently, we constructed the following corresponding simultaneous EquationEquations (4)
(4)
(4) to Equation(8)
(8)
(8) for our econometric regression analysis. Specifically, EquationEquation (4)
(4)
(4) , EquationEquations (5)
(5)
(5) to Equation(7)
(7)
(7) , and EquationEquation (8)
(8)
(8) depict the interaction of the factors at the micro, meso, and macro levels, respectively, in our SSoS framework.
Micro level:
(4)
(4)
Meso level:
(5)
(5)
(6)
(6)
(7)
(7)
Macro level:
(8)
(8)
where in the corresponding province-j,
and
is the gross domestic product (
);
is the CO2 emissions of fossil fuels;
is the healthcare expenditure;
represents total provincial industrial assets;
is the energy consumption of fossil fuels;
is the provincial population;
is the GDP per capita;
is the CO2 emissions of fossil fuels per capita;
is the healthcare expenditure per capita;
is the stock of capital per capita, and
is the energy consumption of fossil fuels per capita.
EquationEquation (4)(4)
(4) illustrates a model at the micro level in the SSoS framework (see ), where the health of residential communities, represented by healthcare expenditure per capita as a proxy variable, is monitored by the residential communities’ leaders to track whether the CO2 emissions from any of the three primary fossil fuels are causing a deterioration of public health. EquationEquations (5)
(5)
(5) to Equation(7)
(7)
(7) illustrate the models at the meso level (see ), where industrial communities coordinate with government policymakers to optimise energy consumption efficiency to reduce the intensity of CO2 emissions and ensure a smooth transition towards a low-carbon economy. Finally, EquationEquation (8)
(8)
(8) illustrates the model at the macro level (see ) where the government policymaker analyzes the interrelationships between GDP, energy consumption, CO2 emissions, and healthcare expenditure.
3.4. Econometric analysis using SEM
SEM has been applied in some prominent ergonomics research studies involving the associations between lean manufacturing, human factors, and ergonomics (Sakthi Nagaraj and Jeyapaul Citation2021), health and safety in the petrochemical sector (Azadeh et al. Citation2015), the effect of positive reinforcement of safety participation on coal-fired power plant workers (Abella et al. Citation2022), the effects of noise on self-rated job satisfaction and health in open plan offices (Lee et al. Citation2016), the assessment of operators’ competence in the vigilant monitoring of military tasks (Matthews et al. Citation2014), and the relationship between ergonomics issues and the intention to use smart national identity cards for homeland security (Yeow, Yuen, and Loo Citation2013). One of SEM’s strong advantages is that it can estimate the interdependence among factors simultaneously (Hair et al. Citation2010). The variables in the SEM can influence each other directly or indirectly through feedback loops among the variables (Lei and Wu Citation2007). SEM is capable of analysing sophisticated measurement models and structural paths involving a multitude of variables and levels of constructs, thus, enabling researchers to examine complex and intricate relationships (Astrachan, Patel, and Wanzenried Citation2014). From Equationequations (4)(4)
(4) to Equation(8)
(8)
(8) , the dependent variable in one equation is used as the independent variable in another.
To investigate the interdependence of the factors at the micro, meso, and macro levels in the relationships among CO2 emissions, energy consumption, healthcare expenditure, and GDP for the three energy sources in the three regions in China in the research framework in , we employed SEM to estimate Equationequations (4)(4)
(4) to Equation(8)
(8)
(8) . At the micro level, to achieve the objective of alerting the government to the effects of CO2 emissions on public health (see ), models of EquationEquation (4)
(4)
(4) provide an understanding of the relationship between the CO2 emissions of various energy sources and health expenditure per capita. At the meso level, to achieve the objective of optimising the consumption of energy sources to reduce CO2 emissions (see ), models of EquationEquations (5)
(5)
(5) to Equation(7)
(7)
(7) provide an understanding of the relationship between CO2 emissions and consumption of energy sources. At the macro level, to achieve the objective of achieving carbon emission reduction targets with the least amount of interruption to the economy (see ), models of EquationEquation (8)
(8)
(8) provide an understanding of the relationship between GDP and CO2 emissions and the energy consumption of energy sources. Additionally, the overlapping variables show that the three levels are interconnected. For example, the CO2 emission variable appears at all levels and the consumption of energy sources variable appears at the meso and macro levels.
In this study, we applied the maximum likelihood estimation method (ML-SEM) in our SEM. This method considers any unobservable factors with unchanged characteristics in the panel data over time, such as the social development level across provinces/cities (Allison, Williams, and Moral-Benito Citation2017). In addition, ML-SEM is appropriate for panel data with a larger number of provinces/cities relative to the number of years (Allison, Williams, and Moral-Benito Citation2017). The SEM econometric analysis in this study was conducted using the statistical software Stata 15.0 (StataCorp. 2017).
4. Results
4.1. Data sample
China’s industrial structure is undergoing rapid changes that have created significant disparities between the various regions’ socioeconomic development, stages of industrialisation, and CO2 emission patterns (Tian et al. Citation2019). In particular, differences in the level of economic development, industrial structure, and resource endowment across the regions have contributed to different CO2 emission patterns in China (Zhang and Zhao Citation2014). Hence, we used Chinese regional panel data for our regression test to gauge the interrelationships between the variables across regions. To create the Chinese regional panel data sample for the study, we followed Zhang and Zhao (Citation2014) in dividing the 30 provincial databases into three subsamples. These are the Eastern Region (comprising Beijing, Tianjin, Hebei, Liaoning, Shanghai, Jiangsu, Zhejiang, Fujian, Shandong, Hainan, and Guangdong provinces), the Central Region (comprising Shanxi, Anhui, Jilin, Heilongjiang, Jiangxi, Henan, Hubei, Chongqing, and Hunan provinces), and the Western Region (comprising Sichuan, Guizhou, Yunnan, Shaanxi, Gansu, Qinghai, Ningxia, Xinjiang, Guangxi, and Inner Mongolia provinces).
The annual data sample of province-specific CO2 emissions (measured in million tonnes) and energy consumption (measured in metric tonnes of coal equivalent, or mtce) of the three primary fossil fuel sources across 30 provinces/cities in China was downloaded from the Carbon Emissions Accounts and Datasets for Emerging Countries (CEADs) website (www.ceads.net). The provincial-level data available from 2009 to 2019 for GDP (measured in billion yuan), healthcare expenditure per capita (measured in yuan), industrial total assets (measured in million yuan), and population were downloaded from the CEIC Global Database (CEIC, www.ceicdata.com). A list of the provinces/cities in the respective regions and the descriptive statistics of the variables for the 30 provinces in China are reported in and , respectively.
Table 2. Provinces/cities in the Eastern Region, Central Region, and Western Region of China.
Table 3. Descriptive statistics of the variables for 30 provinces in China, 2009–2019.
4.2. SEM model and regression
presents the results of the econometric analysis of the three regions of China defined for this study. The regression results are for EquationEquations (4)(4)
(4) to Equation(8)
(8)
(8) at the regional level. We also summarised the results of in the SEM output diagram included in Appendix 1 to capture the flows of each equation from (4) to (8).
Table 4. Econometric analysis results.
5. Discussion
5.1. Solution to the decarbonisation problem
The objective of this study is to suggest which fossil fuel/fuels should have their consumption reduced by industrial communities in the three regions (i.e. the meso-level target system) to meet China’s CO2 emission reduction targets (see ). We must consider the interactions of the child system (the micro-level residential communities) and the parent system (the macro-level government) (see ). Starting at the micro level (the child system), for the Eastern Region, the results of EquationEquation (4)(4)
(4) reveal that a 1% increase in CO2 emissions per capita from the consumption of raw coal- and natural gas-related fossil fuels (
and
) is significant, leading to an increase of between 0.09% (p < .05) and 0.17% (p < .01) in healthcare expenditure per capita (
), respectively, at the micro level. Meanwhile, the results of EquationEquation (4)
(4)
(4) for the Central Region reveal that a 1% increase in CO2 emissions per capita from the consumption of raw coal- and crude oil-related fossil fuels (
) is significant, leading to a 0.31% (p < .01) and 0.14% (p < .05) increase in healthcare expenditure per capita (
), respectively. Note that EquationEquation (4)
(4)
(4) shows no evidence that the CO2 emissions per capita of any primary fossil fuel in the Western Region significantly affect healthcare expenditure per capita at the micro level.
At the macro level (the parent system), to alleviate the negative impact of CO2 emissions on public health, the policymaker can determine which fossil fuels should be reduced and in which region with the least effect on GDP by referring to the empirical results of EquationEquation (8)(8)
(8) . For the Eastern Region, a 1% increase in energy consumption per capita of raw coal-related fossil fuels (
) is significant, leading to a 0.17% (p < .01) decrease in GDP per capita (
). However, for the same region there is no evidence that this is the case for the energy consumption per capita of natural gas-related fossil fuels (
). Meanwhile, for the Central Region, there is no evidence that energy consumption per capita of raw coal- and crude oil-related fossil fuels (
) is significant and leads to a decrease in GDP per capita. However, there is evidence that for the Central Region, a 1% increase in CO2 emissions per capita of raw coal-related fossil fuels is significant (p < .01), leading to a 0.59% decrease in GDP per capita at the macro level.
Thus, to meet the requirements of both the child and parent systems, the results show that the Chinese government should give priority to reducing the energy consumption of raw coal-related fossil fuels and switch to other energy sources in the Eastern and Central regions. Interestingly, the results corroborate recent research that shows that China has generated massive CO2 emissions from burning coal to generate electricity for its heavy industries (Zhao. et al. Citation2020).
On the other hand, the results of EquationEquation (5)(5)
(5) at the meso (target system) level reveal that the energy consumption per capita of raw coal-related fossil fuels in the Eastern Region is significant, exerting a multiplier of approximately two times the CO2 emissions per capita (0.91) compared to the same case in the Central Region (0.49) (both at p < .01). Therefore, industrial communities should give priority to reducing the energy consumption of raw coal-related fossil fuels in China’s Eastern Region compared to the Central Region, and switch to other energy sources. This solution also achieves a common goal among the three system levels, as the individual requirement/goal of the parent, child, and target systems has been fulfilled.
5.2. Advantage of using the SSoS approach complemented with econometric analysis
Global problems like climate change are complex because of the many stakeholders involved at many levels, and because each stakeholder has its own goals related to the TBL of producing social, economic, and natural capital (Thatcher and Yeow Citation2016a, 2016Citationb). Furthermore, the goals of the stakeholders are interconnected as there are linkages among the levels. The key challenge is to reach a common goal that meets the goal of each level so that systems at all levels can cooperate to address the climate change problem (Thatcher and Yeow Citation2018, Citation2019). This research shows that using the SSoS approach complemented with econometric analysis has the advantage of helping China reach a common goal in addressing its decarbonisation problem.
The SSoS approach defines the three levels of the nested hierarchy of systems (the macro-level government, meso-level industrial communities, and micro-level residential communities) to identify the key stakeholders and their TBL goals, i.e. healthcare expenditure (social capital), GDP (economic capital), and energy sources (natural capital) (see ). The econometric analysis of data for several regions in China showed the relationships of key variables (the three capitals and CO2 emissions) to achieve goals at each level. The econometric analysis also showed the interlinkages of all three levels to reach a common goal. For example, the econometric analysis at the micro level (child system) revealed that CO2 emissions degrade public health in residential communities (see the prior section), which evokes ‘revolt change’ aimed at industrial communities at the meso level (target system) to reduce emissions. The econometric analysis at the macro level (parent system) showed that the consumption of raw coal in China’s Eastern and Central regions has the most negative effect on GDP. Thus, under this macro-level conditional constraint, the policymaker can evoke the ‘remember’ process to prioritise a reduction in energy consumption of only the fossil fuels that have a significant negative impact on economic growth. Finally, at the meso level (target system), the econometric analysis revealed that CO2 emissions can be lowered more effectively in the Eastern Region than in the Western Region through a reduction in the energy consumption of raw coal. Thus, the use of the SSoS approach with econometric analysis offers a way to achieve a common goal among the three levels.
This method of reaching a common goal follows the complex adaptive cycle of the SSoS (Thatcher and Yeow Citation2019). There is a revolt change at the lower level, while the higher level ‘remembers’ or sets conditional constraints by following a natural process that considers the interests of all the stakeholders. Ultimately, the solution for the target system is not permanent but instead involves a continuous adaptation and co-evolution that is co-dependent on the revolt and remember mechanism so that the sustainability of the SSoS is maintained (Thatcher, Nayak, and Waterson Citation2020).
As shown in this study, we complemented SSoS with econometric analysis because the latter can define the relationships between the three capitals and CO2 emissions on a large scale, that of three regions in China in this case. The analysis provides solid empirical evidence as it makes use of large panel data to develop robust SEM models, thus, ensuring that decisions regarding which fuel source(s) should be reduced for a specific region can be made accurately. Econometric analysis is most useful when applied to a complex problem that involves a large amount of geographical panel data (Andreß, Golsch, and Schmidt Citation2013).
6. Conclusion
This study has shown that a systems ergonomics approach, specifically, the SSoS approach complemented with econometric analysis, can be used to address a complex problem, such as helping China decide which fuel sources to reduce to meet its decarbonisation targets. This study adds to the literature to compensate for the lack of empirical and practical studies of the application of systems ergonomics to complex global issues (Thatcher et al. Citation2018; Salmon et al. Citation2022). The key advantage of using the SSoS approach complemented with econometric analysis is that it offers a way to reach a common goal among stakeholders. In this study, at the micro level, carbon emissions from raw coal-, crude oil-, and natural gas-related fossil fuels harm the health of residential communities. At the macro level, the government should prioritise the reduction of raw coal consumption in the Eastern and Central regions to maintain economic growth. At the meso level, industrial communities should prioritise a reduction in raw coal consumption in the Eastern Region, rather than the Central Region, to achieve an effective reduction in CO2 emissions. Thus, to reach a common goal for all stakeholders, China should prioritise the reduction of raw coal consumption in the Eastern Region.
Our findings provide policy implications for policymakers, practitioners, and academics concerned with climate change mitigation. Our findings suggest that Chinese policymakers and industrial and residential community leaders should consider adopting the SSoS approach complemented with econometric analysis when devising decarbonisation policies since the approach can help all stakeholders reach a common goal. As shown in the literature review, the existing top-down approach has been ineffective, as it failed to address the interests of all stakeholders and resulted in power shutdowns affecting economic growth and causing disruptions to residential communities. Academics can consider extending the use of the SSoS approach with econometric analysis to other complex global problems, such as the water and hunger crises, and biodiversity loss and species extinction since it can model real-world problems with large data across countries and regions.
One limitation of this study is that the regression test was deployed at the regional level rather than the city level, so the results may not be generalisable to a specific city. Additionally, as China’s economy is currently in a developmental stage, this study’s findings should be confined to the context of developing economies; the findings may not be generalisable to developed economies because of disparities in institutional and social contexts.
For future studies, there is much potential to use the SSoS approach complemented with econometric analysis to address other complex decarbonisation problems. For example, future studies can drill down to develop decarbonisation policy frameworks for cities or countries, instead of regions, by using sector-specific data to determine which energy consumption sources should be optimised to achieve decarbonisation targets. Additionally, technological development measures, such as renewable energy technology diffusion, can be included in an econometric analysis as they reduce CO2 emissions.
Ethical statement
Not applicable as the secondary panel data was utilised in this paper.
Acknowledgment
The authors would like to thank the contributors of Carbon Emissions Accounts and Datasets for Emerging Countries (CEADs) for sharing the data of our research.
Disclosure statement
On behalf of all authors, the corresponding author states that there is no conflict of interest.
Additional information
Funding
References
- Abella, A. A., Y. T. Prasetyo, M. N. Young, R. Nadlifatin, S. F. Persada, A. Redi, and T. Chuenyindee. 2022. “The Effect of Positive Reinforcement of Behavioral-Based Safety on Safety Participation in Philippine Coal-Fired Power Plant Workers: A Partial Least Squares Structural Equation Modeling Approach.” International Journal of Occupational Safety and Ergonomics 2022: 1–12. doi:10.1080/10803548.2022.2089474.
- Akalpler, E., and S. Hove. 2019. “Carbon Emissions, Energy Use, Real GDP per Capita and Trade Matrix in the Indian Economy-an ARDL Approach.” Energy 168: 1081–1093. doi:10.1016/j.energy.2018.12.012.
- Allison, P. D., R. Williams, and E. Moral-Benito. 2017. “Maximum Likelihood for Cross-Lagged Panel Models with Fixed Effects.” Sociological Research for a Dynamic World 3: 237802311771057. doi:10.1177/2378023117710578.
- Al-Mulali, U., and C. N. Binti Che Sab. 2012. “The Impact of Energy Consumption and CO2 Emission on the Economic Growth and Financial Development in the Sub Saharan African Countries.” Energy 39 (1): 180–186. doi:10.1016/j.energy.2012.01.032.
- Andreß, H. J., K. Golsch, and A. W. Schmidt. 2013. Applied Panel Data Analysis for Economic and Social Surveys. Berlin: Springer.
- Astrachan, C. B., V. K. Patel, and G. Wanzenried. 2014. “A Comparative Study of CB-SEM and PLS-SEM for Theory Development in Family Firm Research.” Journal of Family Business Strategy 5 (1): 116–128. doi:10.1016/j.jfbs.2013.12.002.
- Azadeh, A., M. Saberi, M. Rouzbahman, and F. Valianpour. 2015. “A Neuro-Fuzzy Algorithm for Assessment of Health, Safety, Environment and Ergonomics in a Large Petrochemical Plant.” Journal of Loss Prevention in the Process Industries 34: 100–114. doi:10.1016/j.jlp.2015.01.008.
- Baltagi, B. H., and F. Moscone. 2010. “Health Care Expenditure and Income in the OECD Reconsidered: Evidence from Panel Data.” Economic Modelling 27 (4): 804–811. doi:10.1016/j.econmod.2009.12.001.
- Bloom, D. E., D. Canning, and J. Sevilla. 2004. “The Effect of Health on Economic Growth: A Production Function Approach.” World Development 32 (1): 1–13. doi:10.1016/j.worlddev.2003.07.002.
- Bolis, I., T. Sigahi, A. Thatcher, P. Saltorato, and S. N. Morioka. 2023. “Contribution of Ergonomics and Human Factors to Sustainable Development: A Systematic Literature Review.” Ergonomics 66 (3): 303–321. doi:10.1080/00140139.2022.2079729.
- Cai, W., K. Li, H. Liao, H. Wang, and L. Wu. 2017. “Weather Conditions Conducive to Beijing Severe Haze More Frequent under Climate Change.” Nature Climate Change 7 (4): 257–262. doi:10.1038/nclimate3249.
- Cai, Y., C. Y. Sam, and T. Chang. 2018. “Nexus between Clean Energy Consumption, Economic Growth and CO2 Emissions.” Journal of Cleaner Production 182: 1001–1011. doi:10.1016/j.jclepro.2018.02.035.
- Chaabouni, S., and K. Saidi. 2017. “The Dynamic Links between Carbon Dioxide (CO2) Emissions, Health Spending and GDP Growth: A Case Study for 51 Countries.” Environmental Research 158: 137–144. doi:10.1016/j.envres.2017.05.041.
- Chaabouni, S., N. Zghidi, and M. B. Mbarek. 2016. “On the Causal Dynamics between CO 2 Emissions, Health Expenditures and Economic Growth.” Sustainable Cities and Society 22: 184–191. doi:10.1016/j.scs.2016.02.001.
- Cheah, S. K. A., P. H. P. Yeow, S. R. Nair, and F. B. Tan. 2018. “Behavioural Modification Framework to Address Wastage in Household Electricity Consumption.” Ergonomics 61 (5): 627–643. doi:10.1080/00140139.2017.1397200.
- Gerdtham, U. G., and M. Löthgren. 2002. “New Panel Results on Cointegration of International Health Expenditure and GDP.” Applied Economics 34 (13): 1679–1686. doi:10.1080/00036840110116397.
- Guibourdenche, J., C. Poret, G. Poizat, F. Motté, Y. Haradji, P. Salembier, and M. Galbat. 2019. “Sustainable Development and Energy Systems Design: Issues and Perspectives from a Francophone Activity-Centered Approach.” In Human Factors for Sustainability Theoretical Perspectives and Global Applications, edited by T. A., K. J. Zink, and K. Fischer, 335–363. Boca Raton: CRC Press.
- Hair, J. F., W. C. Black, B. J. Babin, and R. E. Anderson. 2010. Multivariate Data Analysis. 7th Edition. New York: Pearson.
- Hao, Y., S. Liu, Z. N. Lu, J. Huang, and M. Zhao. 2018. “The Impact of Environmental Pollution on Public Health Expenditure: Dynamic Panel Analysis Based on Chinese Provincial Data.” Environmental Science and Pollution Research International 25 (19): 18853–18865. doi:10.1007/s11356-018-2095-y.
- He, Y., Y. Xing, X. Zeng, Y. Ji, H. Hou, Y. Zhang, and Z. Zhu. 2022. “Factors Influencing Carbon Emissions from China’s Electricity Industry: Analysis Using the Combination of LMDI and K-Means Clustering.” Environmental Impact Assessment Review 93: 106724. doi:10.1016/j.eiar.2021.106724.
- Holling, C., L. Gunderson, and D. Ludwig. 2002. “Panarchy: Understanding Transformations in Systems of Humans and Nature.” In Resilience Adaptive Cycles, 25–62. Washington: Island Press.
- Jebli, M. B., S. B. Youssef, and I. Ozturk. 2016. “Testing Environmental Kuznets Curve Hypothesis: The Role of Renewable and Non-Renewable Energy Consumption and Trade in OECD Countries.” Ecological Indicators 60: 824–831. doi:10.1016/j.ecolind.2015.08.031.
- Ke, X., P. Saksena, and A. Holly. 2011. “The Determinants of Health Expenditure: A Country-Level Panel Data Analysis.” World Health Organization 26: 1–28.
- Lee, P. J., B. K. Lee, J. Y. Jeon, M. Zhang, and J. Kang. 2016. “Impact of Noise on Self-Rated Job Satisfaction and Health in Open-Plan Offices: A Structural Equation Modelling Approach.” Ergonomics 59 (2): 222–234. doi:10.1080/00140139.2015.1066877.
- Lei, P. W., and Q. Wu. 2007. “Introduction to Structural Equation Modeling: Issues and Practical Considerations.” Educational Measurement 26 (3): 33–43. doi:10.1111/j.1745-3992.2007.00099.x.
- Liu, Y., D. Sun, H. Wang, X. Wang, G. Yu, and X. Zhao. 2020. “An Evaluation of China’s Agricultural Green Production: 1978–2017.” Journal of Cleaner Production 243: 118483. doi:10.1016/j.jclepro.2019.118483.
- Lo, K., H. Li, and K. Chen. 2020. “Climate Experimentation and the Limits of Top-down Control: Local Variation of Climate Pilots in China.” Journal of Environmental Planning and Management 63 (1): 109–126. doi:10.1080/09640568.2019.1619539.
- Lu, Z.-N., H. Chen, Y. Hao, J. Wang, X. Song, and T. M. Mok. 2017. “The Dynamic Relationship between Environmental Pollution, Economic Development and Public Health: Evidence from China.” Journal of Cleaner Production 166: 134–147. doi:10.1016/j.jclepro.2017.08.010.
- Luqman, M., N. Ahmad, and K. Bakhsh. 2019. “Nuclear Energy, Renewable Energy and Economic Growth in Pakistan: Evidence from Non-Linear Autoregressive Distributed Lag Model.” Renewable Energy. 139: 1299–1309. doi:10.1016/j.renene.2019.03.008.
- Magazzino, C., and C. Elliott. 2016. “The Relationship between Real GDP, CO2 Emissions, and Energy Use in the GCC Countries: A Time Series Approach.” Cogent Economics & Finance 4 (1): 1152729. doi:10.1080/23322039.2016.1152729.
- Matthews, G., J. S. Warm, T. H. Shaw, and V. S. Finomore. 2014. “Predicting Battlefield Vigilance: A Multivariate Approach to Assessment of Attentional Resources.” Ergonomics 57 (6): 856–875. doi:10.1080/00140139.2014.899630.
- Meng, T., and Z. Su. 2021. “When Top-down Meets Bottom-up: Local Officials and Selective Responsiveness within Fiscal Policymaking in China.” World Development 142: 105443. doi:10.1016/j.worlddev.2021.105443.
- Meshkati, N., M. Tabibzadeh, A. Farshid, M. Rahimi, and G. Alhanaee. 2016. “People-Technology-Ecosystem Integration: A Framework to Ensure Regional Interoperability for Safety, Sustainability, and Resilience of Interdependent Energy, Water, and Seafood Sources in the (Persian) Gulf.” Human Factors 58 (1): 43–57. doi:10.1177/0018720815623143.
- Murthy, V. N. R., and A. A. Okunade. 2016. “Determinants of U.S. health Expenditure: Evidence from Autoregressive Distributed Lag (ARDL) Approach to Cointegration.” Economic Modelling 59: 67–73. doi:10.1016/j.econmod.2016.07.001.
- National Development and Reform Commission of China (NDRC). 2021. “Working Guidance for Carbon Dioxide Peaking and Carbon Neutrality in Full and Faithful Implementation of the New Development Philosophy.” Retrieved from https://en.ndrc.gov.cn/policies/202110/t20211024_1300725.html
- Oryani, B., Y. Koo, S. Rezania, and A. Shafiee. 2021. “Investigating the Asymmetric Impact of Energy Consumption on Reshaping Future Energy Policy and Economic Growth in Iran Using Extended Cobb-Douglas Production Function.” Energy 216: 119187. doi:10.1016/j.energy.2020.119187.
- Saboori, B., and J. Sulaiman. 2013. “CO2 Emissions, Energy Consumption and Economic Growth in Association of Southeast Asian Nations (ASEAN) Countries: A Cointegration Approach.” Energy 55: 813–822. doi:10.1016/j.energy.2013.04.038.
- Saboori, B., J. Sulaiman, and S. Mohd. 2012. “Economic Growth and CO2 Emissions in Malaysia: A Cointegration Analysis of the Environmental Kuznets Curve.” Energy Policy 51: 184–191. doi:10.1016/j.enpol.2012.08.065.
- Sakthi Nagaraj, T., and R. Jeyapaul. 2021. “An Empirical Investigation on Association between Human Factors, Ergonomics and Lean Manufacturing.” Production Planning & Control 32 (16): 1337–1351. doi:10.1080/09537287.2020.1810815.
- Salmon, P. M., G. J. Read, G. H. Walker, N. J. Stevens, A. Hulme, S. McLean, and N. A. Stanton. 2022. “Methodological Issues in Systems Human Factors and Ergonomics: Perspectives on the Research–Practice Gap, Reliability and Validity, and Prediction.” Human Factors and Ergonomics in Manufacturing & Service Industries 32 (1): 6–19. doi:10.1002/hfm.20873.
- Samudhram, A., E. G. Siew, J. Sinnakkannu, and P. H. Yeow. 2016. “Towards a New Paradigm: Activity Level Balanced Sustainability Reporting.” Applied Ergonomics 57: 94–104. doi:10.1016/j.apergo.2016.03.004.
- Shan, Y., Y. Zhou, J. Meng, Z. Mi, J. Liu, and D. Guan. 2019. “Peak Cement‐Related CO2 Emissions and the Changes in Drivers in China.” Journal of Industrial Ecology 23 (4): 959–971. doi:10.1111/jiec.12839.
- Siemieniuch, C. E., and M. A. Sinclair. 2014. “Extending Systems Ergonomics Thinking to Accommodate the Socio-Technical Issues of Systems of Systems.” Applied Ergonomics 45 (1): 85–98. doi:10.1016/j.apergo.2013.03.017.
- Siemieniuch, C. E., M. A. Sinclair, and M. J. Henshaw. 2015. “Global Drivers, Sustainable Manufacturing and Systems Ergonomics.” Applied Ergonomics 51: 104–119. doi:10.1016/j.apergo.2015.04.018.
- Sinclair, M. A., M. J. D. Henshaw, and S. L. Henshaw. 2021. “On Building Sustainable Communities: A Perspective for HFE Practitioners.” Applied Ergonomics 96: 103476. doi:10.1016/j.apergo.2021.103476.StataCorp.
- Thatcher, A. 2021. “Uncovering Sustainable System-of-Systems Elements in the Design of a Greywater Treatment System for Urban Informal Settlements.” In Proceedings of the 21st Congress of the International Ergonomics Association. Vol. II: Inclusive Design, edited by N. L. Black, W. P. Neumann, I. Noy, 611–619. Berlin: Springer.
- Thatcher, A. 2013. “Green Ergonomics: Definition and Scope.” Ergonomics 56 (3): 389–398. doi:10.1080/00140139.2012.718371.
- Thatcher, A., R. Nayak, and P. Waterson. 2020. “Human Factors and Ergonomics Systems-Based Tools for Understanding and Addressing Global Problems of the Twenty-First Century.” Ergonomics 63 (3): 367–387. doi:10.1080/00140139.2019.1646925.
- Thatcher, A., P. Waterson, A. Todd, and N. Moray. 2018. “State of Science: Ergonomics and Global Issues.” Ergonomics 61 (2): 197–213. doi:10.1080/00140139.2017.1398845.
- Thatcher, A., and P. H. P. Yeow. 2018. “A Sustainable System-of-Systems Approach: Identifying the Important Boundaries for a Target System in Human Factors and Ergonomics.” In Ergonomics and Human Factors for a Sustainable Future, edited by A. Thatcher and P. H. P. Yeow, 23–45. Singapore: Palgrave Macmillan.
- Thatcher, A., and P. H. P. Yeow. 2016a. “Human Factors for a Sustainable Future.” Applied Ergonomics 57: 1–7. doi:10.1016/j.apergo.2016.05.007.
- Thatcher, A., and P. H. P. Yeow. 2016b. “A Sustainable System of Systems Approach: A New HFE Paradigm.” Ergonomics 59 (2): 167–178. doi:10.1080/00140139.2015.1066876.
- Thatcher, A., and P. H. P. Yeow. 2019. “Factors to Consider in the Application of the Sustainable System-of-Systems Model for Human Factors and Ergonomics Interventions.” In Human Factors for Sustainability, 217–236 Boca Raton: CRC Press.
- Tian, X., F. Bai, J. Jia, Y. Liu, and F. Shi. 2019. “Realizing Low-Carbon Development in a Developing and Industrializing Region: Impacts of Industrial Structure Change on CO2 Emissions in Southwest China.” Journal of Environmental Management 233: 728–738. doi:10.1016/j.jenvman.2018.11.078.
- Tong, D., Q. Zhang, Y. Zheng, K. Caldeira, C. Shearer, C. Hong, Y. Qin, and S. J. Davis. 2019. “Committed Emissions from Existing Energy Infrastructure Jeopardize 1.5 Degrees C Climate Target.” Nature 572 (7769): 373–377. doi:10.1038/s41586-019-1364-3.
- Tracy, E. F., E. Shvarts, E. Simonov, and M. Babenko. 2017. “China’s New Eurasian Ambitions: The Environmental Risks of the Silk Road Economic Belt.” Eurasian Geography and Economics 58 (1): 56–88. doi:10.1080/15387216.2017.1295876.
- Wang, K. 2011. “Health Care Expenditure and Economic Growth: Quantile Panel-Type Analysis.” Economic Modelling 28 (4): 1536–1549. doi:10.1016/j.econmod.2011.02.008.
- Wang, Z., M. M. Asghar, S. A. H. Zaidi, and B. Wang. 2019. “Dynamic Linkages among CO2 Emissions, Health Expenditures, and Economic Growth: Empirical Evidence from Pakistan.” Environmental Science and Pollution Research International 26 (15): 15285–15299. doi:10.1007/s11356-019-04876-x.
- Wang, Q., and X. Chen. 2015. “Energy Policies for Managing China’s Carbon Emission.” Renewable and Sustainable Energy Reviews 50: 470–479. doi:10.1016/j.rser.2015.05.033.
- Wang, C., H. P. Hsueh, F. Li, and C. F. Wu. 2019. “Bootstrap ARDL on Health Expenditure, CO2 Emissions, and GDP Growth Relationship for 18 OECD Countries.” Frontiers in Public Health 7: 324. doi:10.3389/fpubh.2019.00324.
- Wang, Y., Q. Song, J. He, and Y. Qi. 2015. “Developing Low-Carbon Cities through Pilots.” Climate Policy 15 (sup1): S81–S103. doi:10.1080/14693062.2015.1050347.
- Wang, S., J. Zeng, and X. Liu. 2019. “Examining the Multiple Impacts of Technological Progress on CO2 Emissions in China: A Panel Quantile Regression Approach.” Renewable and Sustainable Energy Reviews 103: 140–150. doi:10.1016/j.rser.2018.12.046.
- Wang, O., and C. Zhou. 2021, September 28. What has caused China’s electricity shortages, and is Beijing’s carbon-neutral goal solely to blame? South China Morning Post. Retrieved from https://www.scmp.com/economy/china-economy/article/3150313/what-has-caused-chinas-electricity-shortages-and-beijings
- Wilson, J. R. 2014. “Fundamentals of Systems Ergonomics/Human Factors.” Applied Ergonomics 45 (1): 5–13. doi:10.1016/j.apergo.2013.03.021.
- World Economic Forum. 2021. The Global Risks Report 2021 (16th edition). Accessed from https://www3.weforum.org/docs/WEF_The_Global_Risks_Report_2021.pdf
- Yang, T., W. Chen, K. Zhou, and M. Ren. 2018. “Regional Energy Efficiency Evaluation in China: A Super Efficiency Slack-Based Measure Model with Undesirable Outputs.” Journal of Cleaner Production 198: 859–866. doi:10.1016/j.jclepro.2018.07.098.
- Yeow, P. H. P., Y. Y. Yuen, and W. H. Loo. 2013. “Ergonomics Issues in National Identity Card for Homeland Security.” Applied Ergonomics 44 (5): 719–729. doi:10.1016/j.apergo.2012.04.017.
- Yu, R., P. Zhai, and Y. Chen. 2018. “Facing Climate Change-Related Extreme Events in Megacities of China in the Context of 1.5 °C Global Warming.” Current Opinion in Environmental Sustainability 30: 75–81. doi:10.1016/j.cosust.2018.03.008.
- Zaidi, S., and K. Saidi. 2018. “Environmental Pollution, Health Expenditure and Economic Growth in the Sub-Saharan Africa Countries: Panel ARDL Approach.” Sustainable Cities and Society 41: 833–840. doi:10.1016/j.scs.2018.04.034.
- Zarte, M., A. Pechmann, and I. L. Nunes. 2019. “System-of-Systems Approach for Sustainable Production Planning and Controlling in Manufacturing Companies.” In Advances in Human Factors and Systems Interaction (Proceedings of the AHFE 2019 International Conference on Human Factors and Systems Interaction, July 24–28, 2019, Washington D.C., USA), edited by I. L. Nunes, 413–421. Cham: Springer.
- Zhang, C., and W. Zhao. 2014. “Panel Estimation for Income Inequality and CO2 Emissions: A Regional Analysis in China.” Applied Energy 136: 382–392. doi:10.1016/j.apenergy.2014.09.048.
- Zhao, W. 2020. “Extreme Weather and Climate Events in China under Changing Climate.” National Science Review 7 (5): 938–943. doi:10.1093/nsr/nwaa069.
- Zhao, Yuhuan, Ye Cao, Xunpeng Shi, Hao Li, Qiaoling Shi, and Zhonghua Zhang. 2020. “How China’s Electricity Generation Sector Can Achieve Its Carbon Intensity Reduction Targets?” The Science of the Total Environment 706: 135689. doi:10.1016/j.scitotenv.2019.135689.
- Zhou, N., L. Price, D. Yande, J. Creyts, N. Khanna, D. Fridley, H. Lu, W. Feng, X. Liu, A. Hasanbeigi, Z. Tian, H. Yang, Q. Bai, Y. Zhu, H. Xiong, J. Zhang, K. Chrisman, J. Agenbroad, Y. Ke, R. McIntosh, D. Mullaney, C. Stranger, E. Wanless, D. Wetzel, C. Yee, and E. Franconi. 2019. “A Roadmap for China to Peak Carbon Dioxide Emissions and Achieve a 20% Share of Non-Fossil Fuels in Primary Energy by 2030.” Applied Energy 239: 793–819. doi:10.1016/j.apenergy.2019.01.154.
- Zou, C., H. Xue, B. Xiong, G. Zhang, S. Pan, C. Jia, Y. Wang, F. Ma, Q. Sun, C. Guan, and M. Lin. 2021. “Connotation, Innovation and Vision of “Carbon Neutrality.” Natural Gas Industry B 8 (5): 523–537. doi:10.1016/j.ngib.2021.08.009.
Appendix 1.
The output diagram of structural equation modelling (SEM) using the maximum likelihood estimation method
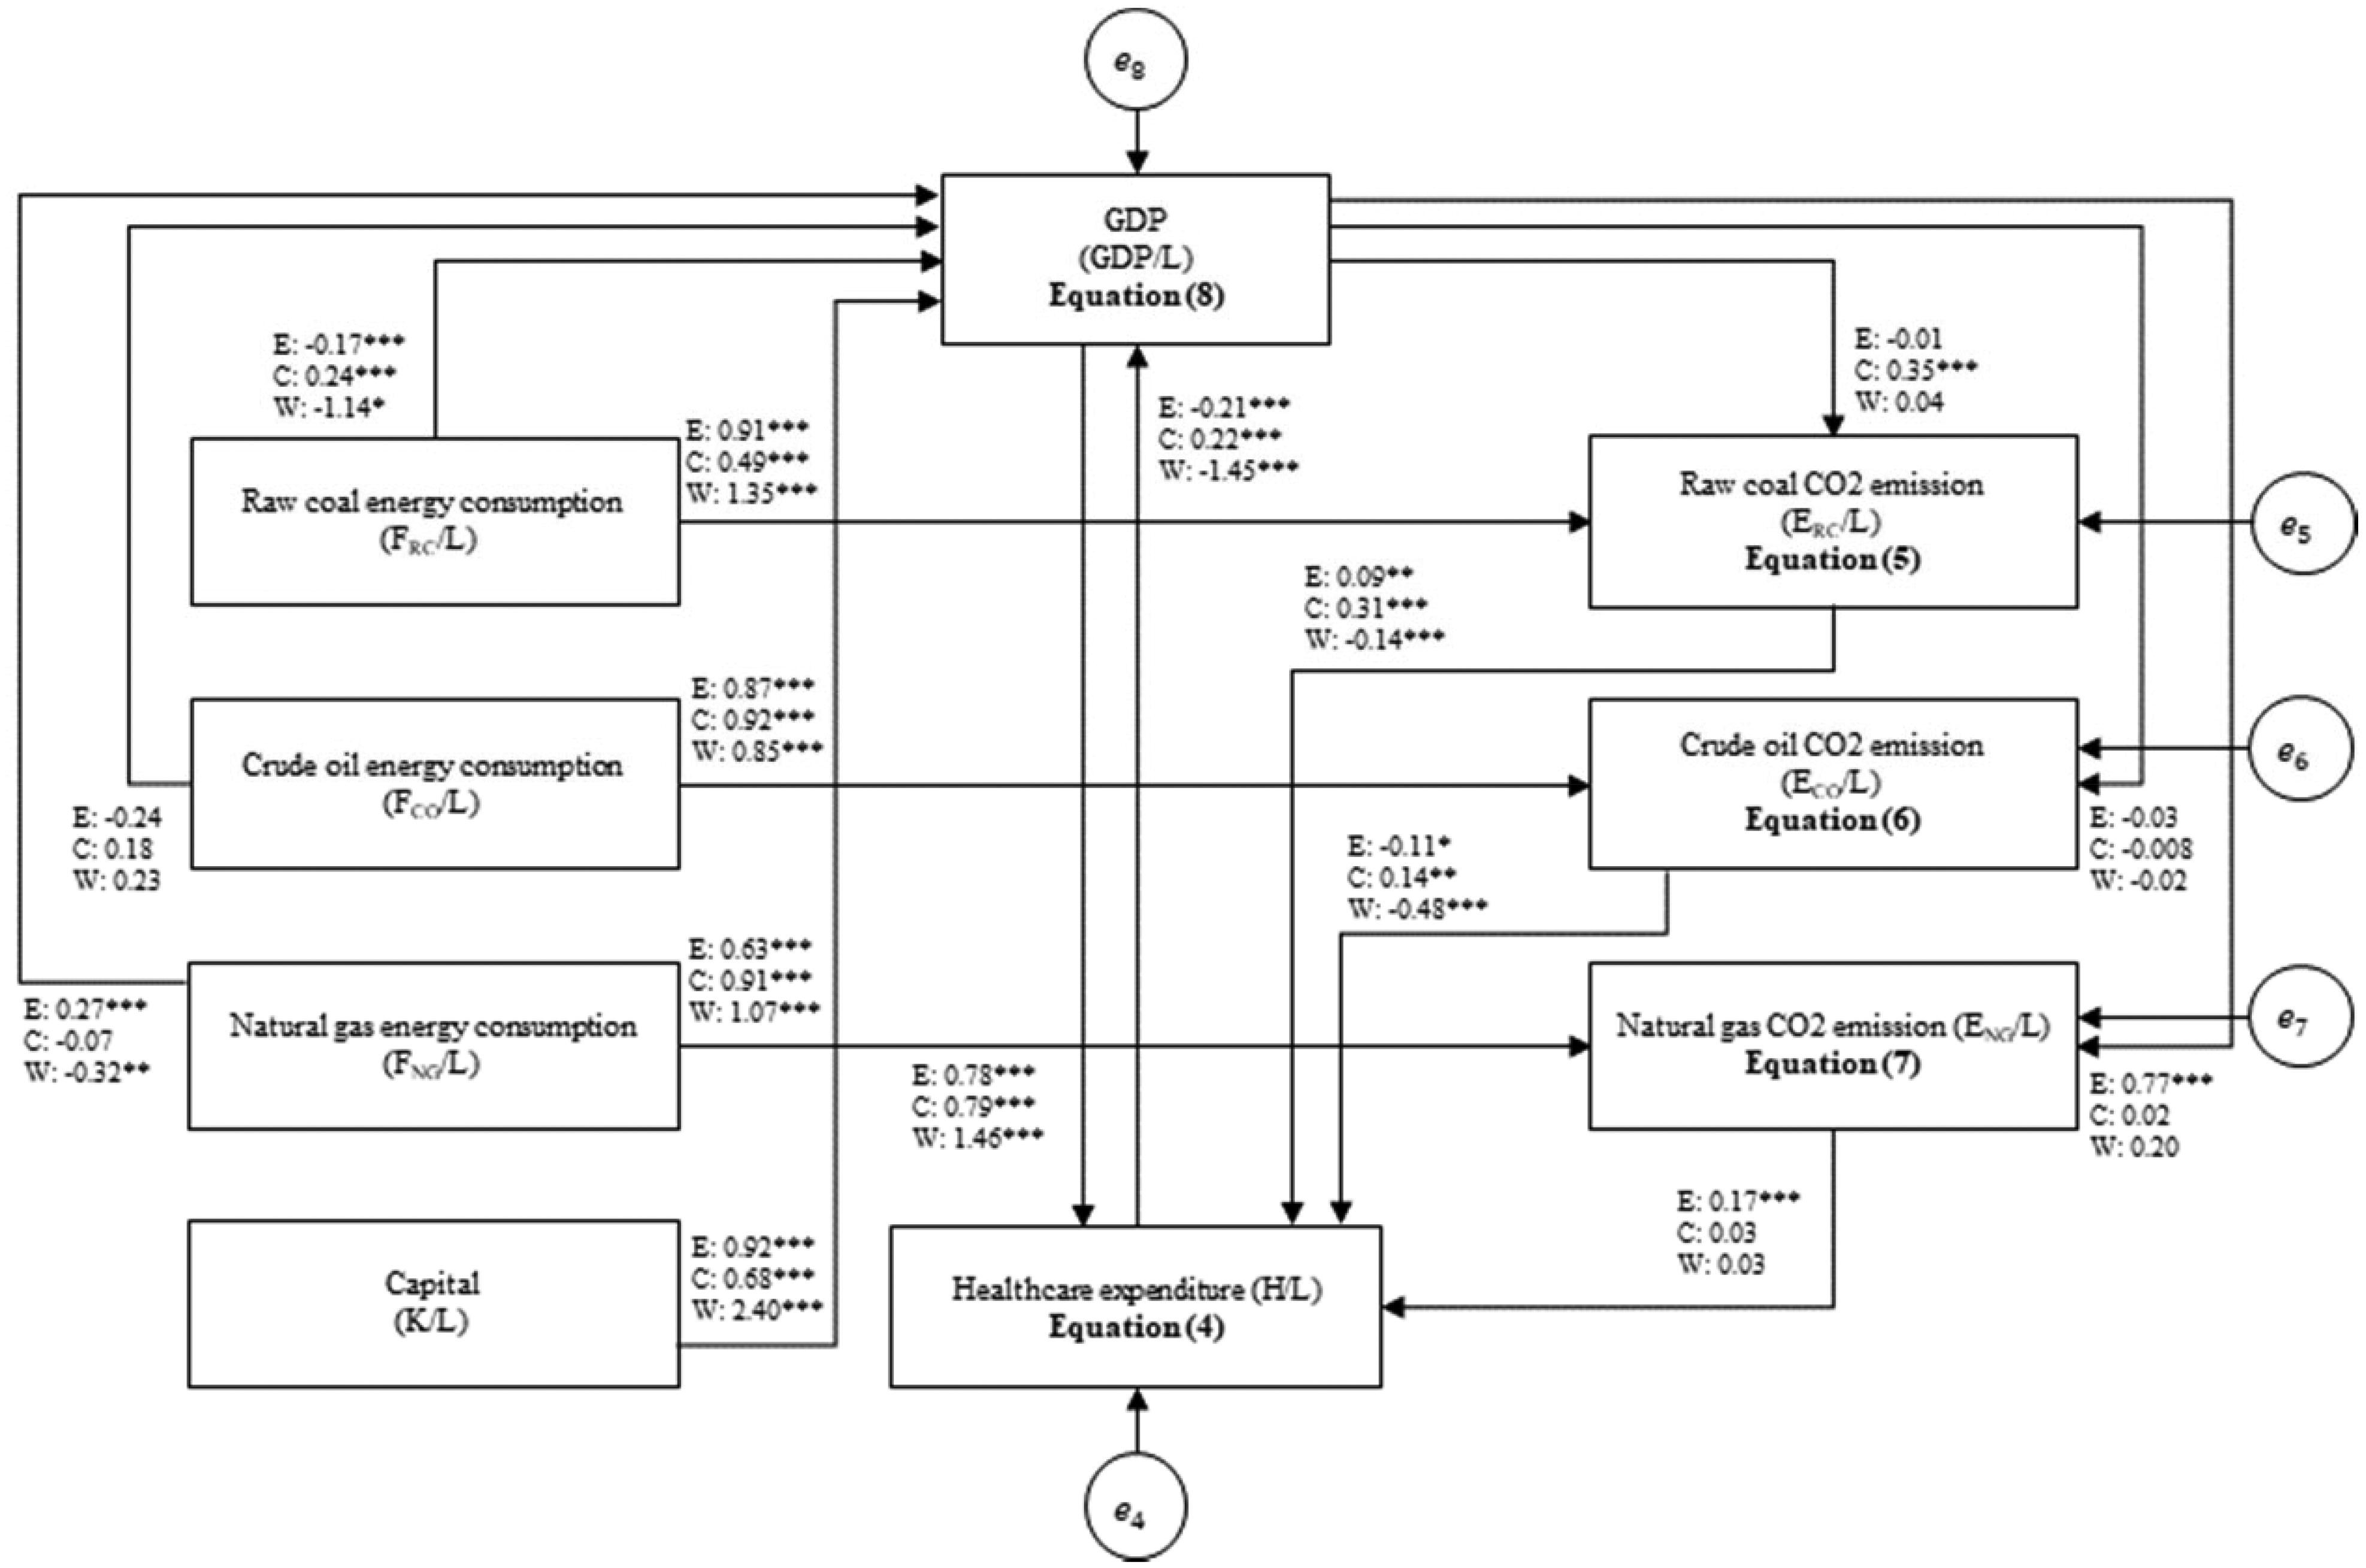
***, **, * denotes the significance at 1%, 5%, and 10% levels, respectively; E, C, and W denote the Eastern, Central, and Western regions of China, respectively.
The diagram shows the relationships between the variables in Equations (4)–(8) together with their coefficient values for the Eastern, Central, and Western regions of China, respectively.