
Abstract
The unexpected spread of the pandemic raised concerns regarding pilots’ skill decay resulting from the significant drops in the frequency of flights by about 70%. This research retrieved 4761 Flight Data Monitoring (FDM) occurrences based on the FDM programme containing 123,140 flights operated by an international airline between June 2019 and May 2021. The FDM severity index was analysed by event category, aircraft type, and flight phase. The results demonstrate an increase in severity score from the pre-pandemic level to the pandemic onset on events that occurred on different flight phases. This trend is not present in the third stage, which indicates that pilots and the safety management system of the airline demonstrated resilience to cope with the flight disruptions during the pandemic. Through the analysis of event severity, FDM enables safety managers to recommend measures to increase safety resilience and self-monitoring capabilities of both operators and regulators.
Practitioner summary: The onset of the pandemic led to a rise in the severity of flight data monitoring events in a large airline, likely linked to a lack of operational practice and skills decay. This was demonstrated across different flight phases and aircraft types. In the settled pandemic period, the severity index returned to pre-pandemic levels, indicating that the resilience of individual pilots and safety management systems is critical to operational safety.
The FDM event severity scores significantly increased following the pandemic onset, especially for event categories involving pilot core competencies.
The FDM event severity scores stagnated or decreased during the later pandemic stage indicating resilience among the airline pilots and the airline’s safety management system.
The airline and pilots demonstrated resilience by effectively mitigating the effects of proficiency decay which took place as the pandemic started.
FDM analysis has shown to be effective in establishing a proactive SMS programme to mitigate the negative impacts of the pandemic on aviation safety.
HIGHLIGHTS
1. Introduction
The spread of the COVID-19 pandemic hit the aviation industries rapidly and unexpectedly. New operation models had to be set up (e.g. repatriation flights) which induced novel tasks for many aviation personnel (Christidis and Christodoulou Citation2020). Pilots were suspended and crew rosters were changed on a significant scale, such as fewer flights and longer duty times, particularly on long-haul flights. Crews at some airlines would perform an outbound long-haul flight and fly back deadhead (flying as passengers) or vice-versa. Some countries required crew members to be COVID-19 tested upon arrival and then be placed in quarantine at their hotel before flying back. This has had a negative impact on the general morale, stress, and fatigue levels in addition to lack of practice, raising concerns about a possible decrease in the level of aviation safety (Jarry, Delahaye, and Feron Citation2021; Sew et al. Citation2022). Pilot proficiency decay can induce safety risks, such as operational procedures related to automation, in-flight decision-making, and accuracy on task performance which could deteriorate with the lack of practice in the flight deck (EASA Citation2020). Some pandemic-related effects on pilots’ performance were already under investigation, such as increases in unstable approaches as possible factors in accidents and incidents, and disruptions to airport ground operations (Jarry, Delahaye, and Feron Citation2021; Werfelman Citation2021). An effective way of investigating pilots’ skill fade is the use of Flight Data Monitoring (FDM). Flight Data Monitoring, or Flight Operation Quality Assurance (FOQA), focuses on the process of recording and analysing flight parameters from the aircraft’s Quick Access Recorder (QAR) to enhance aviation safety. The analysis of FDM data can be compared to a quality assurance process forming part of an airline’s commitment to improving overall safety in flight operations. Since 2008, operators of aircraft with a certificated take-off weight higher than 27,000 kg must maintain a flight data analysis programme as per ICAO Annexe 6 (ICAO Citation2010). The data collected through an FDM programme can help airlines to identify safety trends as well as monitor emerging risks. By analysing the frequency and especially the severity of FDM occurrences and their type, emerging topics of concern (such as the consequences of a sharp reduction in the number of flights) can be addressed through operational changes and training. It is important to note that it is crucial for an airline to reduce the FDM event severity rather than the number of FDM events. As such, an FDM programme not only forms part of the safety management system (SMS) for monitoring occurrences, but it also can help to increase resilience and identify operational risks through proactive measures (EASA Citation2016; Hollnagel Citation2018; Lager and Melin Citation2022).
2. Literature review
2.1. Lack-of-practice effects in flight operations related to pandemic disruptions
According to the International Air Transport Association (IATA), the full-year global passenger traffic results for 2020 indicated a sharp decline of 65.9% compared to 2019. This raised concerns regarding pilots’ abilities to maintain proficiency, Standard Operating Procedures (SOPs), and flying skills on significantly reduced flights. The unpredictability of the COVID-19 pandemic spread put the aviation sector under increased operational risks and created new safety threats, such as increased fatigue and low morale. In addition, direct skill degradation has become a paramount topic due to grounded aircraft and crews, as pilot proficiency is directly correlated to recency (Ebbatson et al. Citation2010). The European Aviation Safety Agency (EASA) and IATA published additional guidance and policies for airlines on how to maintain flight crew proficiency (EASA Citation2020; IATA Citation2020). Decay can affect manual flying skills, but also the ability to use automation, follow operational procedures, and recall aircraft-specific knowledge (Childs and Spears Citation1986; Mengelkoch, Adams, and Gainer Citation1971). The consequences are multiple including decreased adherence to SOPs, and increased slips, lapses, and data entry errors (Reason Citation1990; Rasmussen Citation1983). Pilots operating modern aircraft require various sets of skills, both in terms of technical skills and non-technical skills. Knowledge about aircraft systems, procedures, and manual flying skills are examples of technical skills that are needed by pilots to safely operate their aircraft. In addition, as these aircraft are mostly multi-crew aircraft, non-technical skills, such as situation awareness, leadership, and teamwork are also required. Situation awareness also comprises understanding and interacting with the automation modes to ‘stay ahead’ of the aircraft, both during multi-pilot and single-pilot flight operations (EASA Citation2020; Endsley Citation1995). In addition, the question can be raised if the mitigation measures are sufficient to cope with skill decay. Olaganathan and Amihan (Citation2021) proposed that there was a significant increase in Air Safety Reports (ASRs) during the pandemic period which demonstrated pilots’ proficiency had been significantly affected. Previous research found that 47% of pilots did not engage in self-study to keep their proficiency up during grounding due to the pandemic, as reduced flying schedules regarding the COVID-19 grounding periods had been reported to influence performance (Mizzi, Lohmann, and Carim Junior Citation2022).
2.2. Identifying operational risks using an FDM programme
FDM is considered an efficient method for aircraft operators to monitor their operational safety. A possible reason is that it helps estimate the probabilities of specific events occurring within the airline to develop an effective safety management system (Chaves Citation2020; Lager and Melin Citation2022). The FDM events are classified into different categories according to EASA guidance: runway excursion (RE), mid-air collision (MAC), controlled flight into terrain (CFIT), and loss of control inflight (LOC-I). While some categories are linked to the flying environment (mid-air collision risks), others are more directly linked to the crew’s flying abilities non-technical skills (e.g. runway excursion, which can have a broader range of causal factors, EASA Citation2016; Fang, Zhang, and Zhao Citation2020). FDM captures only a deviation, therefore, the reasons behind the pilots’ inputs cannot be analysed per se (Cahill et al. Citation2016). However, each event can be classified within a risk matrix or attributed a severity score and be related to specific risks. As the recorded data of FDM focuses on flight parameters and not directly on human performance, it is usual to compare FDM events to Air Safety Reports (ASRs) reported by pilots to provide a deeper observation of a situation beyond the raw data (Walker Citation2017). In today’s operations, FDM has become mandatory for every major airline’s safety and reporting culture. It results in a regular feedback process within an airline between the flight safety department, pilot unions, airline management, and the training department. It may be useful not only to consider risks per flight but to perform an aggregated risk index for a specific type of event that would span over many flights (Fang, Zhang, and Zhao Citation2020; Verstraeten et al. Citation2016). Identifying risk from an organisational perspective can be challenging: assessing and comparing the severity of different mishaps can prove difficult. Moreover, safety practitioners need to identify if a specific event is singular or part of an ongoing trend, which needs to be addressed (Macrae Citation2009). This would also enable a broader learning opportunity from these events (Stogsdill Citation2022; Madsen, Dillon, and Tinsley Citation2016). As the crews are monitored on each flight by the QARs, and as air safety reports can help to understand some FDM occurrences better, it is therefore paramount that a climate of trust exists between pilots and the airline’s safety department and that FDM is processed according to just culture (Grell et al. Citation2021; Walker Citation2017). This emphasises the role of the Gatekeeper (responsible for a secure and confidential follow-up with the crews concerned on an event), the need to ensure clear communication, and the ecologically valid handling of FDM (Lager and Melin Citation2022). Pilot’s trust in both FDM programme and airline safety management system is paramount in ensuring its effectiveness (Leva et al. Citation2010; Wolf Citation2012). Insights of FDM data are typically integrated with those from air safety reports to shape a clearer picture of safety issues to improve the practice via changes to operating procedures, manuals, and crew training (Kluge and Frank Citation2014; Walker Citation2017). Airline safety departments can take the required actions to minimise risks when a particular event was highlighted by the FDM programme. The appropriate statistical analyses can be employed to assess whether an event was isolated or belongs to part of a curve using cross-checks techniques to compare the qualitative information from ASRs. Appropriate action can then be taken either via training or revising SOPs to increase safety resilience via the safety management system.
2.3. FDM’s contribution to improving flight safety
The aviation sector has multiple measures in place to ensure its safety resilience. An important part of building resilience is done through training and management. It is an ongoing process where both professional skills in terms of knowledge and practice are being acquired in addition to non-technical skills (such as leadership, communication, decision-making, and stress management) are gained (Chialastri and Pozzi Citation2008; Li, Nichanian, et al. Citation2023). Individual resilience can be developed through training and operational experience, but it also depends on an organisation’s capacity to deal with changes and disturbances. The organisational resilience is a broader construct and consists of maintaining resilience within the operations as well as adaptability towards change (Suddaby Citation2010). This requires the ability to adjust an organisational functioning before, during, and following changes and disturbances so that the organisation can overcome both expected and unexpected events (Woods Citation2017). FDM is a useful tool to help airlines and regulators analyse operational risks. The type of exceedance events can provide information about the crew’s skills, knowledge, and competencies (Li, Zhang, et al. Citation2023). An FDM event that occurred while the aircraft is being flown manually can provide information regarding manual flying skills whereas an event related to flight path management can provide information related to the crew’s automation use and aircraft energy management (Bromfield and Landry Citation2019; Sumwalt, Cross, and Lessard Citation2015). Most FDM-based research focuses on the descent, approach, and landing phases since they are the most dynamic flight phases where deviations are likely to occur (Robinson et al. Citation2021; Smart, Brown, and Denman Citation2012). Moreover, the aforementioned flight phases impose a higher cognitive complexity on the crews, compared to other flight phases. Therefore, it requires considerable handling skills. Deviations from the ILS glideslope, stable approach criteria, dual pilot inputs, and touchdown points are examples of values that can be used to analyse manual flying skills (Casner et al. Citation2014; Haslbeck et al. Citation2014). These parameters are directly managed by the pilots and involve using technical skills as well as non-technical skills. Deviations from acceptable performance for these values would typically fall into the LOC-I and RE categories as per the EASA classification (EASA Citation2016). Therefore, analysing the severity of FDM RE precursors can help determine a possible loss of skills among pilots. Despite the mentioned facts, FDM still makes contributions to improving resilience in terms of adding capabilities of self-monitoring for operators and regulators in cases where the data is shared. Moreover, the recorded data can also be transferred to the safety management team and pilots providing additional insights (Maille Citation2015; Walker Citation2017). In this regard, the measures help to construct a system with high resilience in terms of operational safety.
3. Methods
3.1. FDM dataset
The FDM exceedance data was collected from June 2019 to May 2021 for 24 months process which has been divided into three stages. The first stage starts eight months before the pandemic (6/2019–1/2020) and contains 82,819 flights (referred as stage 1—before pandemic); the second stage lasts eight months pandemic starting on 2/2020 to 9/2020 and comprises 26,128 flights (referred as stage 2—initial pandemic); the third stage lasts eight months after the pandemic already spread-out (10/2020–5/2021) and contains 14,193 flights (referred as stage 3—settled pandemic). FDM data is saved as comma-separated values (i.e. a CSV format) file comprising the events and comprising the total number of flights. The data includes a classification according to EASA standards into five main categories, that are Runway Excursion (RE), Mid-Air Collision (MAC), Controlled Flight into Terrain (CFIT), Loss of Control In-flight (LOC-I), and Go-Around (GA). The Research Ethics Committee granted in advance of the research taking place.
3.2. Procedure
The data analysis consists of three steps. In step 1, FDM data was collected by an airline with a time frame of 24 months. A confidentiality agreement has been signed accordingly. Also, the data analysed in this study is available to the authors and stored based on the United Kingdom Ethical Code and the Data Protection Act. In step 2, the data was pre-processed by SAS and re-constructed to meet the requirement of statistical analyses. Descriptive statistics were calculated. In step 3, statistical analyses were conducted to examine the effects of design factors in response to the research questions in this study. All procedures were developed by the authors.
3.3. Data analysis choice and statistics
3.3.1. Severity index on FDM events
The software applied to retrieve the FDM exceedance events is called Special Event Search and Master Analysis (SESMA) in which is aircraft types are variables that allows comparisons among various fleets. Raw data retrieved from the Quick Access Recorder (QAR) was first processed by the FDM experts using SESMA. When a value is higher than the specific threshold, an FDM event is created accordingly. The detected exceedance values of the relevant parameters are saved in a database and are used to calculate a severity index (SI) with a specific algorithm for each event. The severity index (SI) measures the impact of an event (e.g. a high approach speed) that is dangerous for a flight. High SI suggested a specific event that is more likely to impact flight safety. Each SI score is calculated based on two methods: either a specific score is attributed to a defined event (which leads to each same type of event having the same SI score) or a score based on the magnitude of the deviation. A higher magnitude of deviation would lead to a higher SI score. The steepness of the SI increase based on the magnitude of the deviation is adapted for each type of event. Different events present different types of risks (as a high approach speed presents different risks compared to a mid-air collision). However, the magnitude of the risk (major, hazardous, or catastrophic) remains the same for all types of events, hence this procedure harmonises the level of risk among the different events. The methodology for this SI analysis is based on EASA guidance which indicates that severity is proportional to the extent of a deviation from acceptable parameters. There are 89 specific algorithms to calculate SI for FDM precursors (EASA Citation2019). Analysis of those severity index scores enables a continuous comparison of flight profile, engine, and systems operation with a set of defined parameters for diagnostics, research, and incident investigation. SI analyses were conducted for each event and each aircraft type using an optimal analysis technique. The range of severity index from 0 which represents no risk in normal aircraft operation to above 100, which implies an impending risk for which immediate action is required to preserve the safety of flight operations. For instance, an onset of a hard EGPWS warning (terrain avoidance system requiring an immediate maximum climb effort) is graded as 100. In some cases, the severity index may be >100 (e.g. the SI is 100 on the High Normal Acceleration at Landing at 2.2-g). In this scenario, the higher acceleration at landing the higher severity, SI will be 120 for 2.3-g accelerations at landing. It should be noted, that overall, reducing the severity levels is more crucial than the number of events (Holtom Citation2007).
3.3.2. Statistical analyses
The raw data from the QARs was first processed by the airline’s FDM department using the internal SESMA software and downloaded in the form of CSV files. The SESMA software collects the data from the aircraft’s QARs and processes them. A two-way analysis of variance (ANOVA) was conducted to assess the interaction effect between the three pandemic stages, FDM events, and the main effects on the severity index for testing three hypotheses. Statistical analyses in this study were performed using General linear Modelling (GLM) of SPSS 23 (IBM Inc.). Before conducting the analysis, the assumptions of homogeneity were examined by Levene’s statistics (Yitnosumarto and O’Neill Citation1986). If the assumption of homogeneity is violated (i.e. heterogeneity), post-hoc would be conducted through Games-Howell tests which do not assume equal variances and sample sizes (Ramsey et al. Citation2009) to prevent potential Type I error (Gastwirth, Gel, and Miao Citation2009). The Bonferroni tests were adopted otherwise. The effect size, an indicator measuring the strength of main effects and interactions, was measured in terms of partial eta square (Haase Citation1983). The significant level is set at α = .05.
3.4. Hypotheses
Lack of practicing both standard operational procedures and manual flying skills in the flight deck may increase the operational risk related to proficiency after the impacts of the pandemic. Therefore, there are three hypotheses to be tested as follows:
H1: There is a significant interaction in severity index between the three stages of the pandemic and five categories of FDM events.
H2: There is a significant interaction in severity index between the three stages of the pandemic and seven flight phases of FDM events.
H3: There is a significant interaction in severity index between the three stages of the pandemic and five fleets of FDM events.
4. Results
4.1. Sample characteristics
The frequency of flights in each stage was tabulated with a two-way table in which the fleets and the stage were the categorical variables. It is observed that the number of flights dropped by ∼70% when the pandemic began and continued to drop by ∼50% after the 8-month pandemic started. The SI scores and FDM occurrences increased with higher monthly variations at the beginning of COVID-19 while both total flight numbers significantly decreased compared to before the pandemic (). Furthermore, the SI and frequency of FDM exceedances among five categories are shown in and ; seven flight phases are shown in and ); and five fleets are shown in and , respectively.
Figure 1. (a) The fluctuations of the number of flights and SI values among the three stages. The scale on the left-hand (10 per scale) side displays the average monthly SI score (blue line). The scale on the right-hand side (2000 per scale) shows the number of flights (red line). (b) The fluctuations of the number of FDM events and SI values among the three stages. The scale on the left-hand (10 per scale) side displays the average monthly SI score (blue line). The scale on the right-hand side (100 per scale) shows the average monthly number of FDM events (orange line).
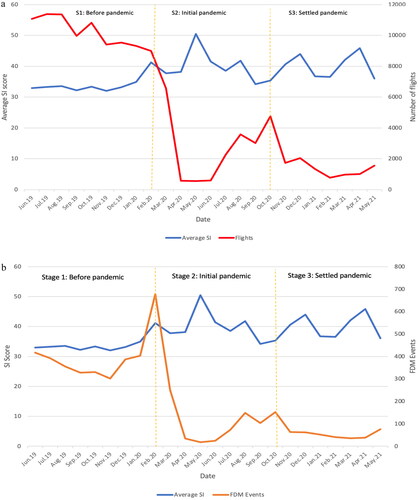
Figure 2. Trends of severity index on FDM exceedances among five event categories across three stages of the pandemic.
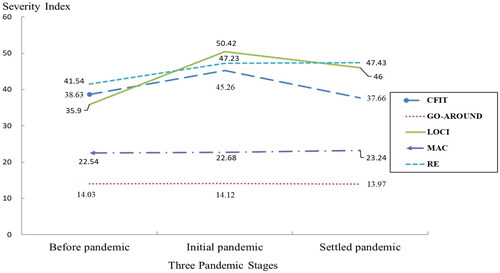
Figure 3. Trends of severity index on FDM exceedances among seven flight phases across three stages of the pandemic.
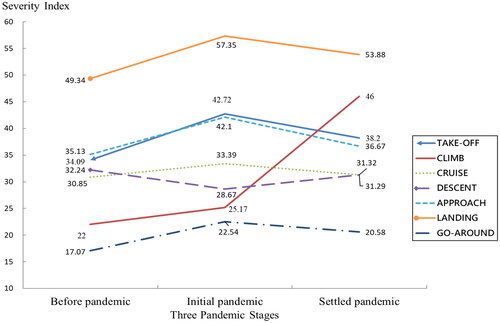
Figure 4. Trends of severity index on FDM exceedances among five fleets across three stages of the pandemic.
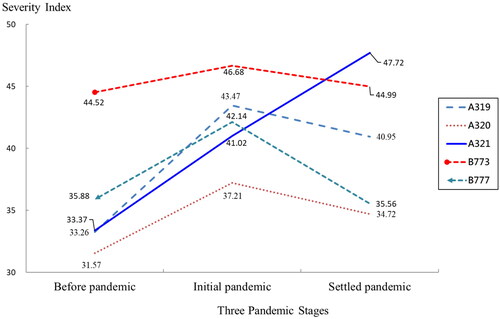
Table 1. Severity index (M and SD) and frequency of FDM events among five categories across three pandemic stages.
Table 2. Severity index (M and SD) and frequency of FDM exceedances among seven flight phases across three pandemic stages.
Table 3. Severity index (M and SD) and frequency of FDM exceedances among five fleets across three pandemic stages.
4.2. Testing severity index between three pandemic stages and five FDM categories
The means and standard deviations of the SI and frequency of FDM exceedances in the five categories are shown in and . Results indicated a significant interaction between three pandemic stages and five FDM categories, F(8, 4746) = 4.491, p < .001, partial η2 = .008. There was a significant main effect on pandemic stages, F(2, 4746) = 8.037, p < .001, partial η2 = .003. Post-hoc comparisons revealed that the average SI in the before-pandemic stage (M = 33.22, SE = .482) is significantly lower than initial-pandemic stage (M = 39.97, SE = .891), p < .001, and settled-pandemic stage (M = 38.57, SE = 1.342). Furthermore, a significant main effect was found on the FDM events, F(4, 4746) = 189.167, p < .001, partial η2 = .138.
4.3. Testing severity index between three pandemic stages and seven flight phases
The means and standard deviation of the severity index and frequency of FDM exceedances on seven flight phases are shown in and . Results indicate the interactions between the pandemic stages and the flight phases were not significant, F(12, 4740) = .877, p = .57, partial η2 = .002. The main effect of pandemic stages was significant, F(2, 4740) = 2.984, p = .05, partial η2 = .001. Also, significant main effects were found on flight phases, F(6, 4740) = 118.242, p < .001, partial η2 = .130. Post-hoc comparisons revealed that average SI of Landing (M = 52.25, SE = .898) was significantly higher than that of Take-off (M = 37.04, SE = .903), Climb (M = 23.54, SE = 1.783), Cruise (M = 31.44, SE = 1.706), Descent (M = 31.55, SE = 1.045), Approach (M = 37.29, SE = .949), Go-around (M = 19.05, SE = .516), ps < .001. Also, the average SI of Take-off, Cruise, Descent, Approach, and Landing were significantly higher than that of Go-around, ps < .001.
4.4. Testing severity index between three pandemic stages and five fleets
The means and standard deviations of the SI and frequency of FDM exceedances on five fleets are shown in and . Results indicated the interactions between the pandemic stages and the five aircraft fleets were not significant, F(8, 4746) = 1.496, p = .153, partial η2 = .003. Significant main effects were found for the three pandemic stages F(2, 4746) = 14.136, p < .001, partial η2 = .006. Post-hoc comparisons revealed that both average SI in the initial-pandemic stage (M = 39.97, SE = .891) and settled-pandemic stage (M = 38.57, SE = 1.342) were significantly higher than that in the before-pandemic stage (M = 33.22, SE = .482), p < .001. Also, a significant main effect was found on fleets; F(4, 4746) = 9.523, p < .001, partial η2 = .008. Post-hoc comparisons revealed that the average SI for the B773 (M = 45.26, SE = 2.436) was higher than the A319 (M = 36.51, SE = .986), A320 (M = 33.65, SE = .568), A321 (M = 35.91, SE = .941), B777 (M = 37.31, SE = 1.183), with p = .009, p < .001, p = .004, p = .029, respectively. Post-hoc comparisons revealed that the average SI for the B773 was higher than for the A320, p = .043.
While the number of flights decreased by about 70% as the pandemic started results showed significant interactions between the three pandemic stages and the FDM categories [F(8, 4746) = 4.491, p < .001, partial η2 = .008], with the SI being significantly lower during the pre-pandemic stages compared to afterwards and LOC-I and RE being in average the more severe events. Moreover, the results show that the interactions between the pandemic stages and flight phases were not significant [F(12, 4740) = .877, p = .57, partial η2 = .002]. However, the SI was significantly higher during landing compared to the other flight phases. Finally, the results showed no significant interactions between the pandemic stages and aircraft fleets [F(8, 4746) = 1.496, p = .153, partial η2 = .003]. However, the average SI was higher for long-haul aircraft than for short-haul aircraft.
5. Discussion
The significant reduction in flight numbers may account for the increase in severity index on the FDM exceedances related to skill fade, as pilots did not have the opportunity to fly regularly in the initial pandemic stages for eight months. The pilot’s proficiency is contingent on real-world operations and simulation training. Lack-of-practice effects may hinder pilots’ handling skills and decrease pilots’ proficiency in both operational procedures and psychomotor skills in the flight deck (EASA Citation2020). The initial-pandemic stage featured a sudden drop of 70% in flight numbers () and disrupted the airline’s operational procedures as well as pilots’ operational behaviours due to health and safety regulations required using masks and gloves (EASA Citation2020).
5.1. Lack-of-practice increased severity index on FDM events occurring close to the ground
The pattern of increasing severity index from stage-1 to stage-2 can also be found in both seven flight phases () and five fleets (). The main effects on FDM categories, flight phases, and fleets were statistically significant (). The frequency of the FDM occurrences upsurge at the beginning of COVID-19 () revealed a significant increase in abnormal configurations, such as speed brakes with flaps, high speed at runway stop end, low power on approach, simultaneous sidestick inputs, excessive roll rate, and instantaneous pitch rate at take-off. These can be related to lack-of-practice effects and pilots’ proficiency decay at the beginning of the pandemic. There was a significant interaction in severity index between the three stages and five categories of FDM events. The patterns for each FDM category were different across three pandemic stages. There are three FDM exceedance categories mostly related to flying skills including CFIT (such as GPWS soft warning and slow rotation during go-arounds, etc.), LOC-I (such as high normal acceleration in flight and climb speed low 400–1500 feet, etc.), and RE (high deceleration at stop end and high normal acceleration at landing, etc.). These showed an increase in the second stage but signs of a recovery in the subsequent third stage. In contrast, the average severity index for MAC (such as altitude deviation and TCAS resolution advisory, etc.) and GA (such as go-around from below 1000 feet, etc.) were approximately equal across the three stages (). In general, it is more important to reduce the severity levels instead of the number of FDM events (Holtom Citation2007; Orasanu, Fischer, and Davison Citation2017).
Deviations from acceptable values at stages of flight where the aircraft was flown manually (such as unstable approaches, high-pitch events, and hard touchdowns) provided information about the pilots’ handling skills (Bromfield and Landry Citation2019), especially during approach and landing. The landing flight phase remains the flight phase with the highest average severity indexes, followed by take-off and approach ( and ). These lack of practice effects could be linked back to the several skill types (technical vs. non-technical skills) and their retention among pilots. Although both technical and non-technical skills were affected as the pandemic spread, the rate at which pilots could regain them was different depending on the skill type. Manual flying skills could be regained fairly rapidly, because of the simulator training sessions implemented by the airline. However, non-technical and other technical skills, such as operational proficiency (cockpit flows, use of procedures) were harder to regain, especially when operating in a different environment (fewer flights, thus shorter flight times due to ATC shortcuts). This pattern can be linked back to a fluctuation of the severity index in the second and third stages for RE and LOCI events, which remain higher compared to the first stage. During the later pandemic stage, the airline had to adjust its operational procedures and policies based on the new safety regulations from regulators, such as CAA, EASA, and ICAO. The current restrictions and related safety challenges (crew rostering, fatigue, morale) can be considered expectable and quantifiable variables whereas new disruptions (such as the threat of a new virus variant) can be considered unexpectable challenges. The operation has been disrupted, and flight data repartitions thus shifted. This has made it more difficult to derive safety trends as operations’ regularity is not ensured anymore, while the analysis of deviations from accepted thresholds is still possible.
5.2. Differences on lack-of-practice effects between short-haul and long-haul pilots
The results revealed that the Airbus A320 aircraft features the lowest severity index and the Boeing B773 features the highest severity index over the three pandemic stages than the other aircraft. Before the pandemic, short-haul aircraft had on average more FDM exceedance than long-haul aircraft, which can be explained by the larger flight numbers they perform. This statistically magnified the possibility for an FDM event to occur, as most FDM events take place during the take-off and landing flight phases. Therefore, while a long-haul aircraft performs one take-off and landing, a short-haul aircraft would typically take off and land two to four times. The severity index scores on long-haul were higher than on short-haul aircraft (). Long-haul pilots were still able to fly at a lower but regular rate during the pandemic due to the increase in air cargo demand which enabled the airline to maintain a great number of its long-haul flights. On the other hand, quarantine measures and travel restrictions greatly affected the short-haul sector, as passenger demand dropped and could not be compensated by cargo due to a lack of space on short-haul aircraft. Therefore, short-haul pilots had less chance to fly, which increased their risk of both lack of practice on SOPs and manual flying skills decay.
5.3. Severity index demonstrated safety resilience during COVID-19 disruptions
The severity index increased from the first stage to the second stage at the initial of the pandemic and then dropped to a lower level in the third stage settled pandemic (). Such results may reflect the fact that FDM may contribute to building resilience by providing self-monitoring capabilities to each operator. Information derived from an FDM programme can then be used to adapt operational procedures or develop a specific training syllabus addressing some specific issues found. In safety terms, resilience is the ability of a system to adjust so that it can sustain normal functioning in dynamic situations of changes and disruptions (Holbrook et al. Citation2019; Ham Citation2021). Different types of resilience can be inferred from this analysis. Both individual resilience (each pilot’s resilience) and team resilience (as a crew) proved to have been in place which positively influenced organisational resilience. Resilience engineering has also emerged as a practical safety discipline that aims to proactively manage system safety through a synergistic integration of Safety-I and Safety-II which have attracted much attention in the safety community for the last two decades (Pariès and Wreathall Citation2017; Patriarca et al. Citation2018; Provan et al. Citation2020). In return, the airline was able to implement specific training sessions for pilots which reinforced individual and team resilience.
The severity index was increasing at the beginning of pandemic (stage-2) and decreasing at the stage-3 demonstrated resilience in both individual pilots and organisational safety management, although the number of flights significantly decreased compared to stage-1 (). Theoretically, the severity index should have increased significantly following the pattern from stage-2 to stage-3. However, the airline followed the guidelines provided by the regulators (CAA, EASA) and was able to implement safety measures, such as specific additional supports and shared information on sustaining mental and physical health and training, to mitigate possible skill decay both in terms of handling skills and human performance. Therefore, the pattern of arrow-shape on the severity index among the three stages of pandemic impacts demonstrated the dynamic stability of safety resilience. This was possible due to the analysis of a combination of data sources, such as FDM, Air Safety Reports, and strong informed and learning cultures acquired over the years. Following an initial unexpected disruption, this airline was able to regain a relatively stable state (). The second stage of the initial pandemic showed an increase in severity index scores for all fleets, but these numbers show a decreasing trend in the third stage of the settled pandemic (). It can be assumed that the airline adopted mitigation strategies to cope with the pandemic’s disruptions with regard to resilience in-flight safety. This is particularly relevant for the short-haul sector, as the severity index scores started to decrease during the third stage. The results show that the events requiring a combination of technical and non-technical skills, such as RE events (as they require both aircraft handling and energy management, but also situation awareness, communication, and teamwork among others) are most prone to skill decay, leading to a rise in event severity. By targeting the events where the event severity significantly increased and applying mitigation measures in terms of procedures and training, safety managers may flatten similar patterns, should a drop-in practice occur again. These findings might also be useful to airlines employing a large number of seasonal pilots and airlines whose pilots work much less hours during the low season, as similar trends in FDM event severity could be expected. This pattern shows evidence that safety resilience within the airline’s safety management system was effective and pilots’ resilience to the impacts of the pandemic. Further studies could be conducted regarding how specific training measures and operational changes increased this resilience.
5.4. Limitations
Outlier detection is pervasive for detecting safety-critical events due to its ability to monitor degradation in mechanical systems. In other words, monitoring degradation in mechanical systems was suitable as the system has boundaries in terms of operation and behaviour (Hodge and Austin Citation2004). There were fewer constraints and more potential for variability in non-mechanical systems and processes. The limits of FDM however, with regards to resilience is that FDM mostly focuses on the absence of safety instead of its presence. Moreover, with the increasing complexity of air traffic and automation, the number of interactions within the Air Traffic System (ATS) exponentially increases (Aven and Zio Citation2014; Harris and Stanton Citation2010). This reduces the ability of operators to solely rely on past events or precursors to identify safety issues or possible risks (Stogsdill Citation2022). Weather disruption could also trigger an increase in FDM occurrences which would normally be related to manual flying skills and could bias the results. Therefore, more evidence is required to conclusively establish skill degradation through FDM (Sikora, Hari, and Hanusch Citation2020; Arthur et al. Citation1998). Finally, identifying the direct causal factors related to the increasing SI, such as health and safety policies of COVID and mental and physical fatigue is complicated and difficult. Therefore, ‘lack of practice’ is considered the most probable reason, but other possibilities could not be ruled out for certain.
6. Conclusion
The lack-of-practice effects may have hindered pilots’ handling skills and decreased pilots’ proficiency at the beginning of the pandemic. The second pandemic stage featured a sudden drop of 70% in flights. The arrow-shaped pattern on FDM events among the three pandemic stages demonstrated aviation’s safety resilience. Following an initial unexpected disruption, the airline’s safety management system was able to regain its safety resilience. Furthermore, FDM contributes to building resilience by providing self-monitoring capabilities to each operator and the regulators in cases where the data is shared. This provides constant learning and feedback processes for every actor involved, including the operators—pilots, air traffic controllers, but also airlines, manufacturers, and regulating bodies. Knowledge derived from an FDM programme can then be used to adapt operational procedures and develop specific training syllabi addressing operational risks which had been identified. Moreover, the collected information can also be passed on to the pilots providing pilots and management with additional insights to improve operational safety. The use of a generalised SI score can prove beneficial for other high-risk systems, such as healthcare or the nuclear industry, where multiple barriers are in place to avoid high severity events. Future research shall be focusing on machine learning algorithms, and predictive modelling on more comprehensive flight data sets including aircraft state variables and the complex operational environment to integrate risk mitigation strategies. The use of SI indexes in real-time analyses is also an opportunity to gain direct insight into a developing situation in terms of risks.
Acknowledgements
The authors would like to express special thanks to Captain Mark Mannering-Smith, Ben Whitworth, and Simon Oakes for their contribution to this research. Their support and the enthusiasm of their respective teams were invaluable in facilitating the authors’ research efforts.
Disclosure statement
No potential conflict of interest was reported by the author(s).
Data availability statement
Due to commercial restrictions and a legally binding confidentiality agreement with the data provider, authors are not able to share the data publicly, so supporting data is not available.
Additional information
Funding
References
- Arthur, W., W. Bennett, P.L. Stanush, and T.L. McNelly. 1998. “Factors That Influence Skill Decay and Retention: A Quantitative Review and Analysis.” Human Performance 11 (1): 57–101. doi:10.1207/s15327043hup1101_3.
- Aven, T., and E. Zio. 2014. “Foundational Issues in Risk Assessment and Risk Management.” Risk Analysis 34 (7): 1164–1172. doi:10.1111/RISA.12132.
- Bromfield, M.A., and S.J. Landry. 2019. “Loss of Control in Flight – Time to Re-Define?” AIAA Aviation 2019 Forum, 1–10. doi:10.2514/6.2019-3612.
- Cahill, J., T.C. Callari, F. Fortmann, D. Javaux, and A. Hasselberg. 2016. “A-PiMod: A New Approach to Solving Human Factors Problems with Automation.” Lecture Notes in Computer Science (Including Subseries Lecture Notes in Artificial Intelligence and Lecture Notes in Bioinformatics), 9736 LNAI, 269–279. doi:10.1007/978-3-319-40030-3_27.
- Casner, S.M., R.W. Geven, M.P. Recker, and J.W. Schooler. 2014. “The Retention of Manual Flying Skills in the Automated Cockpit.” Human Factors 56 (8): 1506–1516. doi:10.1177/0018720814535628.
- Chaves, F. 2020. “Airline Safety Management System Issues: A Practitioner’s Perspective.” Aircraft Engineering and Aerospace Technology 92 (2): 117–127. doi:10.1108/AEAT-11-2018-0280.
- Chialastri, A., and S. Pozzi. 2008. “Resilience in the Aviation System.” Lecture Notes in Computer Science (Including Subseries Lecture Notes in Artificial Intelligence and Lecture Notes in Bioinformatics), 5219 LNCS, 86–98. doi:10.1007/978-3-540-87698-4_10.
- Childs, J.M., and W.D. Spears. 1986. “Flight-Skill Decay and Recurrent Training.” Perceptual and Motor Skills 62: 235–242. doi:10.2466/pms.1986.62.1.235.
- Christidis, P., and A. Christodoulou. 2020. “The Predictive Capacity of Air Travel Patterns during the Global Spread of the Covid-19 Pandemic: Risk, Uncertainty, and Randomness.” International Journal of Environmental Research and Public Health 17 (10): 3356. doi:10.3390/ijerph17103356.
- EASA. 2016. Developing Standardised FDM-Based Indicators. https://www.easa.europa.eu/sites/default/files/dfu/EAFDM__standardised_FDM-based_indicators_v2_Ed2017.pdf
- EASA. 2019. “Guidance for the Implementation of FDM-Precursors.” [Online]. Accessed August 4, 2021. https://www.easa.europa.eu/eofdm-wgb-guidance-implementation-fdm-precursors-revision-3
- EASA. 2020. Safety Issue Report-Skills and Knowledge Degradation Due to Lack of Recent Practice.
- Ebbatson, M., D. Harris, J. Huddlestone, and R. Sears. 2010. “The Relationship between Manual Handling Performance and Recent Flying Experience in Air Transport Pilots.” Ergonomics 53 (2): 268–277. doi:10.1080/00140130903342349.
- Endsley, M.R. 1995. “Toward a Theory of Situation Awareness in Dynamic Systems.” Human Factors 37 (1): 32–64. doi:10.1518/001872095779049543.
- Fang, F., R. Zhang, and X. Zhao. 2020. “An Aggregated Evaluation and Multi-Dimensional Comparison Method of Flight Safety Based on QAR Data.” Proceedings of 2020 IEEE 2nd International Conference on Civil Aviation Safety and Information Technology, ICCASIT 2020, 145–149. doi:10.1109/ICCASIT50869.2020.9368553.
- Gastwirth, J.L., Y.R. Gel, and W. Miao. 2009. “The Impact of Levene’s Test of Equality of Variances on Statistical Theory and Practice.” Statistical Science 24 (3): 343–360. doi:10.1214/09-STS301.
- Grell, J., H. Meyer, F. Raddatz, and S. Pulham. 2021. “Measuring the Acceptance from Commercial Pilots towards the Usage of Flight Data for Predictive Maintenance.” Paper presented at the Deutscher Luft- und Raumfahrtkongress 2021, Bremen, Germany.
- Haase, R.F. 1983. “Classical and Partial Eta Square in Multifactor ANOVA Designs.” Educational and Psychological Measurement 43 (1): 35–39. doi:10.1177/001316448304300105.
- Ham, D.H. 2021. “Safety-II and Resilience Engineering in a Nutshell: An Introductory Guide to Their Concepts and Methods.” Safety and Health at Work 12 (1): 10–19. doi:10.1016/J.SHAW.2020.11.004.
- Harris, D., and N.A. Stanton. 2010. “Aviation as a System of Systems: Preface to the Special Issue of Human Factors in Aviation.” Ergonomics 53 (2): 145–148. doi:10.1080/00140130903521587.
- Haslbeck, A., P. Kirchner, E. Schubert, and K. Bengler. 2014. “A Flight Simulator Study to Evaluate Manual Flying Skills of Airline Pilots.” Proceedings of the Human Factors and Ergonomics Society Annual Meeting 58 (1): 11–15. doi:10.1177/1541931214581003.
- Hodge, V.J., and J. Austin. 2004. “A Survey of Outlier Detection Methodologies.” Artificial Intelligence Review 22 (2): 85–126. doi:10.1007/s10462-004-4304-y.
- Holbrook, J., J.P. Prinzell, M. Stewart, B. Smith, and B. Matthews. 2019. “Resilience and Safety for in-Time Monitoring, Prediction, and Mitigation of Emergent Risks in Commercial Aviation.” 20th International Symposium on Aviation Psychology. https://corescholar.libraries.wright.edu/isap_2019/19
- Hollnagel, E. 2018. Safety–I and Safety–II. 1st ed. CRC Press. doi:10.1201/9781315607511.
- Holtom, M. 2007. FOQA – Flight Data Analysis of Aircraft for Flight Safety. PIA Air Safety Publication. https://www.theairlinepilots.com/forumarchive/flightsafety/foqaflightdataanalysis.php
- IATA. 2020. Guidance for Managing Pilot Training and Licensing during COVID-19 Operations.
- ICAO. 2010. Annex 6 Part 1. https://store.icao.int/en/annex-6-operation-of-aircraft-part-i-international-commercial-air-transport-aeroplanes
- Jarry, G., D. Delahaye, and E. Feron. 2021. “Flight Safety during Covid-19: A Study of Charles de Gaulle Airport Atypical Energy Approaches.” Transportation Research Interdisciplinary Perspectives 9: 100327. doi:10.1016/j.trip.2021.100327.
- Kluge, A., and B. Frank. 2014. “Counteracting Skill Decay: four Refresher Interventions and Their Effect on Skill and Knowledge Retention in a Simulated Process Control Task.” Ergonomics 57 (2): 175–190. doi:10.1080/00140139.2013.869357.
- Lager, E., and M. Melin. 2022. “Proactive Flight Safety–A Feasibility Study on Optimal Use of Flight Data Monitoring and Incident Reports in an Airline.” International Journal of Occupational Safety and Ergonomics 28 (2): 1311–1315. doi:10.1080/10803548.2021.1899608.
- Leva, M.C., J. Cahill, A.M. Kay, G. Losa, and N. McDonald. 2010. “The Advancement of a New Human Factors Report – ‘The Unique Report’ – Facilitating Flight Crew Auditing of Performance/Operations as Part of an Airline’s Safety Management System.” Ergonomics 53 (2): 164–183. doi:10.1080/00140130903437131.
- Li, W.-C., A. Nichanian, J. Lin, and G. Braithwaite. 2023. “Investigating the Impacts of Covid-19 on Aviation Safety Based on Occurrences Captured through Flight Data Monitoring.” Ergonomics 66 (10): 1534–1548.. doi:10.1080/00140139.2022.2155317.
- Li, W.-C., J. Zhang, G. Braithwaite, and P. Kearney. 2023. “Quick Coherence Technique Facilitating Commercial Pilots’ Psychophysiological Resilience to the Impact of COVID-19.” Ergonomics 66 (8): 1176–1189. doi:10.1080/00140139.2022.2139416.
- Macrae, C. 2009. “Making Risks Visible: Identifying and Interpreting Threats to Airline Flight Safety.” Journal of Occupational and Organizational Psychology 82 (2): 273–293. doi:10.1348/096317908X314045.
- Madsen, P., R.L. Dillon, and C.H. Tinsley. 2016. “Airline Safety Improvement through Experience with Near-Misses: A Cautionary Tale.” Risk Analysis 36 (5): 1054–1066. doi:10.1111/RISA.12503.
- Maille, N. 2015. “On the use of Flight Operating Procedures for the Analysis of FOQA data.” 6th European Conference for Aeronautics and Space Sciences (EUCASS). https://www.researchgate.net/publication/314973879
- Mengelkoch, R.F., J.A. Adams, and C.A. Gainer. 1971. “The Forgetting of Instrument Flying Skills.” Human Factors 13 (5): 397–405. doi:10.1177/001872087101300502.
- Mizzi, A., G. Lohmann, and G. Carim Junior. 2022. “The Role of Self-Study in Addressing Competency Decline among Airline Pilots during the COVID-19 Pandemic.” Human Factors. Advance online publication. doi:10.1177/00187208221113614.
- Olaganathan, R., and R.A.H. Amihan. 2021. “Impact of Covid-19 on Pilot Proficiency – A Risk Analysis.” Global Journal of Engineering and Technology Advances 6 (3): 1–13. doi:10.30574/gjeta.2021.6.3.0023.
- Orasanu, J., U. Fischer, and J. Davison. 2017. “Risk Perception and Risk Management in Aviation.” Teaming Up: Components of Safety under High Risk, edited by R. Dietrich, 93–116. London: Routledge. doi:10.4324/9781315241708-7.
- Pariès, J., and J. Wreathall. 2017. Resilience Engineering in Practice, edited by E. Hollnagel, J. Pariès, D. Woods, and J. Wreathall. CRC Press. doi:10.1201/9781317065265.
- Patriarca, R., J. Bergström, G. di Gravio, and F. Costantino. 2018. “Resilience Engineering: Current Status of the Research and Future Challenges.” Safety Science 102: 79–100. doi:10.1016/j.ssci.2017.10.005.
- Provan, D.J., D.D. Woods, S.W.A. Dekker, and A.J. Rae. 2020. “Safety II Professionals: How Resilience Engineering Can Transform Safety Practice.” Reliability Engineering & System Safety 195: 106740. doi:10.1016/j.ress.2019.106740.
- Ramsey, P.H., K. Barrera, P. Hachimine-Semprebom, and C.C. Liu. 2009. “Pairwise Comparisons of Means under Realistic Nonnormality, Unequal Variances, Outliers and Equal Sample Sizes.” Journal of Statistical Computation and Simulation 81 (2): 125–135. doi:10.1080/00949650903219935.
- Rasmussen, J. 1983. “Skills, Rules, and Knowledge; Signals, Signs, and Symbols, and Other Distinctions in Human Performance Models.” IEEE Transactions on Systems, Man, and Cybernetics 13 (3): 257–266. doi:10.1109/TSMC.1983.6313160.
- Reason, J. 1990. Human Error. Cambridge University Press. doi:10.1017/CBO9781139062367.
- Robinson, J.N., A.P. Payan, D.N. Mavris, and C. Johnson. 2021. “Visual and Instrument Helicopter Approach Stability Analysis Using Data Fusion and Data Analytics.” AIAA Scitech 2021 Forum, 1–30. doi:10.2514/6.2021-0528.
- Sew, K.S., J. Jung, K.W. Lo, L. Yap, and S. Pignata. 2022. “Is There a Relationship between Pilot Stress and Short- and Long- Haul Flights?” 24th HCI International Conference on Engineering Psychology and Cognitive Ergonomics, HCII 2022, 420–432. doi:10.1007/978-3-031-06086-1_33.
- Sikora, I., B.L. Hari, and M. Hanusch. 2020. “Human Factors Approaches and Models in LOC-I Accident Analysis and Prevention: Flight Crew Resource Management Techniques as a Risk Mitigation Tool.” International Journal of Safety and Security Engineering 10 (3): 301–310. doi:10.18280/ijsse.100301.
- Smart, E., D. Brown, and J. Denman. 2012. “A Two-Phase Method of Detecting Abnormalities in Aircraft Flight Data and Ranking Their Impact on Individual Flights.” IEEE Transactions on Intelligent Transportation Systems 13 (3): 1253–1265. doi:10.1109/TITS.2012.2188391.
- Stogsdill, M. 2022. “When Outcomes Are Not Enough: An Examination of Abductive and Deductive Logical Approaches to Risk Analysis in Aviation.” Risk Analysis 42 (8): 1806–1814. doi:10.1111/RISA.13681.
- Suddaby, R. 2010. “Challenges for Institutional Theory.” Journal of Management Inquiry 19 (1): 14–20. doi:10.1177/1056492609347564.
- Sumwalt, R., D. Cross, and D. Lessard. 2015. “Examining How Breakdowns in Pilot Monitoring of the Aircraft Flight Path.” International Journal of Aviation, Aeronautics, and Aerospace 2 (3): 8. doi:10.15394/ijaaa.2015.1063.
- Verstraeten, J., G. Baren, and van Wever, R. 2016. “The Risk Observatory: Developing an Aviation Safety Information Sharing Platform in Europe.” Journal of Safety Studies 2 (2): 91. doi:10.5296/jss.v2i2.10443.
- Walker, G. 2017. “Redefining the Incidents to Learn from: Safety Science Insights Acquired on the Journey from Black Boxes to Flight Data Monitoring.” Safety Science 99: 14–22. doi:10.1016/j.ssci.2017.05.010.
- Wolf, H. 2012. “The Emerging Role of Safety Management Systems in Aerospace.” IEEE Aerospace Conference Proceedings. doi:10.1109/AERO.2012.6187419.
- Werfelman, L. 2021. Unpracticed. Aerosafety World. https://flightsafety.org/asw-article/unpracticed/
- Woods, D.D. 2017. Resilience Engineering, edited by E. Hollnagel, D.D. Woods, and N. Leveson. CRC Press. doi:10.1201/9781315605685.
- Yitnosumarto, S., and M.E. O’Neill. 1986. “On Levene’s Test of Variance Homogeneity.” Australian Journal of Statistics 28 (2): 230–241. doi:10.1111/j.1467-842X.1986.tb00603.x.