
 ?Mathematical formulae have been encoded as MathML and are displayed in this HTML version using MathJax in order to improve their display. Uncheck the box to turn MathJax off. This feature requires Javascript. Click on a formula to zoom.
Abstract
Poly(vinylidenefluoride-trifluoroethylene)-based (P(VDF-TrFE)-based) terpolymers represent a new class of electroactive polymer materials that are relaxor-ferroelectric (RF) polymers and that offer unique and attractive property combinations in comparison with conventional ferroelectric polymers. The RF state is achieved by introducing a fluorine-containing termonomer as a “defect” into the ferroelectric P(VDF-TrFE) copolymer, which reduces the interaction between the VDF/TrFE dipoles. The resulting terpolymer exhibits a low Curie transition temperature and small remanent and coercive fields yielding a slim hysteresis loop that is typical for RF materials. Though the macroscopic behavior is similar to RF ceramics, the mechanisms of relaxor ferroelectricity in semi-crystalline polymers are different and not fully understood yet. Structure-property relationships play an important role in RF terpolymers, as they govern the final RF properties. Hence, a review of important characteristics, previous studies and relevant developments of P(VDF-TrFE)-based terfluoropolymers with either chlorofluoroethylene (CFE) or chlorotrifluoroethylene (CTFE) as the termonomer is deemed useful. The role of the termonomer and of its composition, as well as the effects of the processing conditions on the semi-crystalline structure which in turn affects the final RF properties are discussed in detail. In addition, the presence of noteworthy transition(s) in the mid-temperature range and the influence of preparation conditions on those transitions are reviewed. A better understanding of the fundamental aspects affecting the semi-crystalline structures will help to elucidate the nature of RF activity in VDF-based terpolymers and also help to further improve their applications-relevant electroactive properties.
1. Introduction
Poly(vinylidene fluoride) (PVDF) — and its trifluoroethylene-containing copolymer P(VDF-TrFE) — are the most often used ferroelectric polymers in electroactive devices. In addition, VDF-based copolymers with tetrafluoroethylene (P(VDF-TFE)), cholorofluoroethylene (P(VDF-CTFE)) and hexafluoroethylene (P(VDF-HFP)) have been developed, investigated and sometimes employed in applications. All of them are semi-crystalline and contain at least three phases — ordered crystalline-phase regions, a disordered amorphous phase and interface regions between the two other phases. Proposed and implemented applications of such ferroelectric fluoropolymers include piezo- or pyro-electric transducers, soft micro-energy harvesters, and energy-storage or memory devices [Citation1–5]. A large number of fundamental and applications-oriented studies have been dedicated to the detailed investigation of structure-property relationships and underlying molecular mechanisms behind the useful properties of the PVDF family of fluoropolymers [Citation1,Citation6–10]. The presence of a high difference in electronegativity between the carbon and fluorine atom in the C-F bond produces a large net dipole moment (μ) of 6.4 Cm or 1.92 D (traditional unit of μ — Debye D = 3.34
Cm) in VDF monomers, paving the way for the large ferro-, pyro- and piezo-electric responses in suitably prepared VDF-based polymers [Citation2].
PVDF and its copolymers can crystallize into at least five different phases that are commonly referred to as and ϵ phases [Citation6,Citation11,Citation12]. The molecular chains in the five crystalline forms assume three different conformations: All-trans,
and
(). When cooled from the melt, PVDF chains in the
conformation crystallize mainly into the α phase which is the thermodynamically preferred phase. In α crystals, the dipole moments of neighboring chains point in opposite directions and thus cancel each other — resulting in a macroscopically non-polar phase. Poling of α crystals at strong electric fields can orient the neighboring dipole moments parallel to each other leading to the formation of the polar δ phase [Citation13]. On the other hand, stretching of the α phase to high ratios results in the alignment of all fluorine atoms at the same side of the backbone with a zig-zag all-trans chain conformation, and thus leads to the polar β phase that exhibits the highest dipole moment of all PVDF phases (2.1 D) [Citation12]. Hence, in order to prepare PVDF with the best possible ferroelectric characteristics, it is necessary to achieve a high fraction of the crystalline β phase. Poling at very high electric fields also results in the β phase. High-temperature annealing of the α phase can convert the polymer chains into the
conformation which is either polar with parallel dipole moments of all macromolecular chains in a crystal (γ phase) or non-polar with anti-parallel dipole moments of neighboring chains (ϵ phase) [Citation11]. However, only a minor fraction of ϵ-PVDF crystals is usually generated, as the γ phase is thermodynamically favored over the ϵ phase. A schematic overview of the three conformations present in the five crystalline phases of PVDF-based polymers is shown in .
Figure 1. Schematic overview of the various conformations found in the different crystalline phases of VDF-based polymers with a brief description of their typical characteristics.
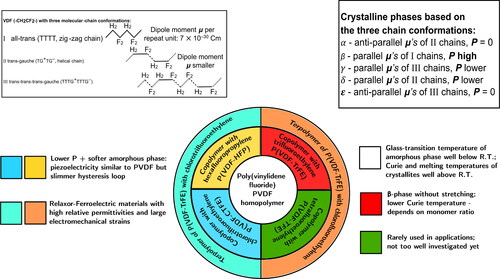
By adding a second fluorine-containing comonomer such as TrFE and TFE, VDF chains can be forced into assuming the polar β phase with its significantly higher monomer dipole moment and overall ferroelectric polarization. The more bulky comonomer groups increase the inter-chain distance between the polymer chains and thus reduce their inter-chain interactions. As a result, the ferroelectric-to-paraelectric (or Curie) transition temperature () is lowered in comparison to the β phase of the PVDF homopolymer. For β PVDF,
is considered to lie above the melting point [Citation14,Citation15] and can thus not be experimentally investigated. The comonomers have different effects on the relevant properties of the copolymers — as briefly summarized in . It was found that ferroelectrics show improved electromechanical properties when operated near their respective
[Citation16]. Odajima et al. showed already in the mid-1980s that it is possible to further lower the
of P(VDF-TrFE) copolymers by means of electron-beam irradiation at suitable dose rates and overall doses [Citation17]. Further studies on irradiated P(VDF-TrFE) performed by Zhang et al. identified relaxor-ferroelectric (RF) behavior in the copolymer, a phenomenon that had previously only been observed on inorganic ceramics such as lead magnesium niobate (PMN) and lead lanthanum zirconate titanate (PLZT) [Citation18]. The high energy irradiation produces physical defects in the structure, breaks the long-range polar order in the P(VDF-TrFE) chains, and thus restricts the interaction range to nano-domains, which stabilizes the non-polar paraelectric phases at room temperature (RT).
Chung et al. demonstrated that it is also possible to chemically modify the P(VDF-TrFE) copolymer so that it exhibits RF properties [Citation19]. To this end, a third bulky chlorine-containing monomer was added to the P(VDF-TrFE) copolymer, which reduces the interaction between the dipolar regions and leads to the formation of nano-domains — similar to the effect of irradiation [Citation20]. However, the chemical route eliminates undesirable side effects of irradiation such as cross-linking, chain scission and formation of free radicals. In the past, chlorine-contaning termonomers such as chlorofluoroethylene (CFE), chlorodifluoroethylene (CDFE), chlorotrifluoroethylene (CTFE), and trifluoropropene (TFP) have been used [Citation2]. When compared to their ferroelectric counterparts, RF terpolymers show a slimmer hysteresis loop, a lower coercive field () and a higher saturation polarization (
), which leads to higher energy dissipation and lower switching voltages that may be advantageous for applications. Furthermore, the chemically modified RF polymers show high permittivities at RT, since their Curie transition temperatures lie within the ambient temperature range [Citation21]. Hence, RF terpolymers are also very attractive for materials research.
Since the paraelectric phase is the stable phase in the terpolymer, it consists mostly of chains with gauche conformations in α- and γ-phase crystalline structures. In addition to the crystalline phase, the amorphous phase and the interface between the amorphous and crystalline regions strongly influence the properties of semi-crystalline polymers. In case of the terpolymer, both, the composition and the processing have a direct influence on the resulting polymer structures [Citation21–25]. In particular, and the mid-temperature transition temperature (
) are greatly influenced by thermal treatments [Citation25,Citation26]. Thus, by studying structure-property relationships in the terpolymer, it will be possible to gain a better understanding of the underlying molecular mechanisms that are responsible for the transitions and relaxations seen in the terpolymer, which will help us to improve or optimize their RF properties.
2. Synthesis, sample preparation and experimental methods
For terpolymer synthesis, either bulk [Citation19, Citation27] or suspension polymerization [Citation20, Citation28] with a free-radical oxygen-activated organoborane or a potassium-peroxodisulfate initiator has been employed. After activation of the initiator, the monomers VDF, TrFE and CFE are introduced into the reactor with precise control over their ratios. The process produces terpolymers with highly uniform molecular structure and also with few impurities. For characterization, terpolymer samples may be cast as free-standing films via solvent-casting or melt-pressing processes. For solvent-casting, terpolymer powder is dissolved in a suitable solvent such as acetone, dimethylformamide (DMF) or methylethylketone (MEK) [Citation21, Citation22, Citation29], and the solvent is allowed to evaporate after casting onto glass slides. For melt-pressing, the terpolymer is melted on a heating plate and then pressed into a film by means of a top plate. The films solidify during cooling of the plates with the pressure still applied. Spin-coating can also be used to produce thin films ranging from several nm to a few μm in thickness. Here, the terpolymer solution is dropped onto a glass slide or silicon wafer, and the solvent is quickly evaporated during high-speed rotation. Last, but not least, printing technologies may be employed to produce uniform or patterned terpolymer films or films stacks from suitable terpolymer and other solutions [Citation30].
Several methods are available to characterize dielectric and relaxor-ferroelectric (RF) properties of terpolymers [Citation31]. Among them, dielectric relaxation spectroscopy (DRS) remains the most often used technique. Here, a low AC electric field is used to make the dipoles in the dielectric material oscillate. While the electronic and ionic polarizations respond almost instantaneously to the applied field in the usual DRS frequency range, the orientational polarization is a non-resonant relaxation process that leads to a delayed response of the dipoles. Since the dipole-relaxation times depend upon the sample temperature, it is possible to obtain information about the various molecular processes taking place in the material either by performing a frequency scan at constant temperature or a temperature scan at fixed frequencies. For recording dielectric hysteresis loops, a Tower-Sawyer circuit is used where a sinusoidally alternating electric field is applied to the sample, and the resulting polarization current is measured. In addition to dielectric techniques, thermal methods such as differential scanning calorimetry (DSC) and optical methods such as wide-angle x-ray diffraction (WAXD) and Fourier-transform infrared spectroscopy (FTIR) are widely used to identify the glass and melting transitions, different crystalline phases, etc.
3. Relaxor-ferroelectric properties of the terpolymer
3.1. Polarization and dielectric-hysteresis characteristics
As stated in the Introduction, RF terpolymers exhibit very high dielectric permittivities in comparison to conventional ferroelectric homo- and co-polymers near their respective Curie transitions that are often found close to RT. The observation shows that the dipoles can rotate easily upon application of an electric field. Consequently, as shown in , RF terpolymers exhibit slim hysteresis loops with small values of the coercive field () and the remanent polarization (
) — as opposed to the P(VDF-TrFE) copolymer that shows a broad hysteresis loop with high
and
values that are characteristic for a ferroelectric material. In addition, RF terpolymers can produce double-hysteresis-loop (DHL) behavior as depicted in for a P(VDF-TrFE-CFE) sample [Citation28, Citation32–34]. DHL behavior has been observed before in anti-ferroelectric ceramics and is usually explained as a reversible antiferroelectric-to-ferroelectric (AFE-to-FE) transition [Citation35, Citation36]. In case of RF terpolymers, DHL behavior is most probably caused by the pinning effect of the termonomers [Citation32–34].
Figure 2. Comparison of dielectric hysteresis loops in a ferroelectric P(VDF-TrFE) (VDF/TrFE mol% 75/25) copolymer and in relaxor-ferroelectric P(VDF-TrFE-CFE) and P(VDF-TrFE-CTFE) terpolymers. Reprinted from [Citation32] under Open Access Creative Commons Attribution 4.0.
![Figure 2. Comparison of dielectric hysteresis loops in a ferroelectric P(VDF-TrFE) (VDF/TrFE mol% 75/25) copolymer and in relaxor-ferroelectric P(VDF-TrFE-CFE) and P(VDF-TrFE-CTFE) terpolymers. Reprinted from [Citation32] under Open Access Creative Commons Attribution 4.0.](/cms/asset/55a68925-6139-4bb9-a037-2f243a14489a/gfer_a_2014260_f0002_c.jpg)
As shown in for P(VDF-TrFE-CFE) at low electric fields, the CFE molecules and the VDF-TrFE groups next to them do not follow the applied electric field, as they are physically pinned to the heavy termonomer, which leads to reduced interaction between the VDF-TrFE domains and to the observed single hysteresis loop (SHL). As the electric field increases further and becomes high enough, the CFE molecules along with the VDF-TrFE groups in their proximity can be flipped — allowing co-operative interaction between the domains and leading to FE behavior. The RF FE transition gives rise to DHL behavior [Citation32, Citation33]. The transition process is reversible, and the terpolymer returns to its RF state upon removal of the electric field. It has been estimated that just 2 neighboring CFE units can pin about 14 VDF-TrFE groups between them [Citation33]. Though the mechanism is the same for the CTFE termonomer, the behavior is a bit different, as CTFE is a bulkier monomer with a lower dipole moment (0.64 D) than CFE (dipole moment of 1.8 D) and thus usually exhibits SHL behavior — as shown in . A higher electric field than for CFE monomers is required to flip CTFE units [Citation32, Citation34]. On the other hand, a CTFE-containing terpolymer has been found to have more all-trans conformations than a CFE-containing terpolymer. As a result, broader DHL loops are commonly observed in CTFE-containing terpolymers [Citation28, Citation34]. The presence of a slim RF hysteresis and of DHL behavior are advantageous for energy-storage applications, as they lead to a high overall electric-energy density that can be discharged in an application [Citation33, Citation37].
Figure 3. Schematic model of dipole switching in a P(VDF-TrFE-CFE) (upper part) and a P(VDF/TrFE/CTFE) terpolymer (lower part) leading to double-hysteresis-loop (DHL) behavior. Reprinted with permission from [Citation34] © 2014 American Chemical Society.
![Figure 3. Schematic model of dipole switching in a P(VDF-TrFE-CFE) (upper part) and a P(VDF/TrFE/CTFE) terpolymer (lower part) leading to double-hysteresis-loop (DHL) behavior. Reprinted with permission from [Citation34] © 2014 American Chemical Society.](/cms/asset/024bc728-b2c3-45de-b9fd-2d03063b48a6/gfer_a_2014260_f0003_c.jpg)
3.2. Electrostrictive strain
RF terpolymers also show very good electromechanical properties with very large electrostrictive strains — higher than those of ceramics due to the lower Young’s modulus — which can be exploited in actuator applications [Citation37]. P(VDF-TrFE-CFE) terpolymers show the highest electrostrictive strain among all RF polymers known so far [Citation18, Citation20]: about 7% in the thickness direction (longitudinal strain, ) and 2% in the transverse direction (
), respectively. Additional stretching increases
to around 5% under an electric field of 150 V/
[Citation20]. The
-versus-electric-field plot shows a quadratic dependence of strain at low fields and saturates at high electric fields. On the other hand, a P(VDF-TrFE-CTFE) terpolymer shows a slightly lower
value with a linear electric-field dependence even at high fields [Citation37].
3.3. Electrocaloric effect
The process of polarization and relaxation also brings about changes in entropy and temperature of the material when it is exposed to an electric stress, which is known as the electrocaloric effect (ECE) — the reciprocal effect to pyroelectricity. It has been proposed to use this property for solid-state refrigeration in sensors, in microelectronic devices, as well as in small, but highly efficient industrial and domestic cooling appliances [Citation38–40]. Neese et al. reported that a large ECE can be achieved in both ferroelectric and relaxor-ferroelectric polymers operated near their respective F-P transition temperatures [Citation41]. The ECE of RF terpolymers is very attractive for real-world applications, since they have a very low At 55 °C, an isothermal entropy change
= 55 J/KgK and an adiabatic temperature change
= 12 °C was obtained with a P(VDF-TrFE-CFE) terpolymer [Citation41]. Subsequently, the temperature dependence of the ECE in P(VDF-TrFE-CFE) terpolymers has been investigated [Citation42]. It was shown that the change of the isothermal entropy
is directly proportional to the square of the electric displacement D (
) and that the coefficient β increases with temperature. The results indicate that the polarization response from the nanopolar regions in the terpolymer does not generate much change in
and that the major contribution comes from the changes accompanying the ferroelectric-to-paraelectric transition in the crystalline regions.
4. Transitions and relaxations of the terpolymer as seen in DRS
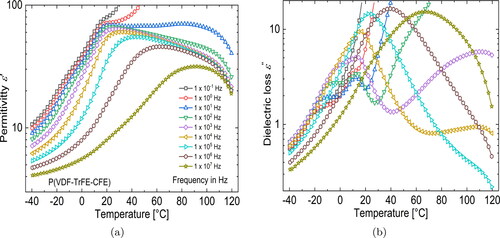
shows DRS measurements of the real and imaginary parts of the complex permittivity in a terpolymer film with a VDF/TrFE/CFE mol% ratio of 62.2/29.4/8.4 that was annealed at 120 °C. Looking at the loss peaks, two different processes can be identified in the terpolymer below RT. In the low-temperature region, we have a relaxation process the peak position of which shifts to higher temperature with increasing frequency, which points to a glass-transition (
) process that takes place in the amorphous regions of the semi-crystalline terpolymer. In addition to the
process, we have a second process taking place at a slightly higher temperature (around 10 °C). At low frequencies, we notice that the corresponding relaxation peak does not shift with frequency, which is characteristic for a phase transition. In case of the terpolymer, as pointed out in the Introduction, the Curie transition temperature (
) is close to RT at 12 °C. Corresponding to the (
) peak, we see a peak maximum in the
permittivity curve around 20 °C with a maximum permittivty of around 70 (at 10 Hz). As the frequency increases, we observe that both loss peaks superimpose, giving rise to a single peak that starts to show relaxation characteristics at high frequencies. Apart from the transition described above, an additional transition exists around 100 °C, seen in both, the
and the
curves. It has been shown that the peak originates from the relaxation of real space charge at the electrode-sample interface [Citation43].
Figure 4. Temperature-dependent dielectric permittivity (a) and loss (b) of a P(VDF-TrFE-CFE) terpolymer annealed at 120 C and measured at 9 different frequencies from 0.1 Hz to 10 MHz.
5. Influence of type and content of the termonomer
The type of termonomer and also its relative content have an effect on the RF properties of the resulting terpolymer. Out of all the termonomers used with P(VDF-TrFE), CFE leads to the highest electrostrictive strain of the terpolymer [Citation44]. In addition, a lower CFE fraction is needed to convert the P(VDF-TrFE) copolymer into an RF polymer. While only about 4% of CFE is needed for achieving RF behavior, 10% is required in the case of CTFE [Citation44], which is probably a result of the larger size and the lower dipole moment of CTFE molecules which stabilize the all-trans conformation to a larger extent than CFE, as mentioned in subsection 3.1 above. Consequently, a 62/38/4 mol% P(VDF-TrFE-CFE) terpolymer shows a higher elastic modulus resulting in a higher elastic-energy density and a higher electromechanical coupling factor when compared to 65/35/10 mol% P(VDF-TrFE-CTFE) terpolymer.
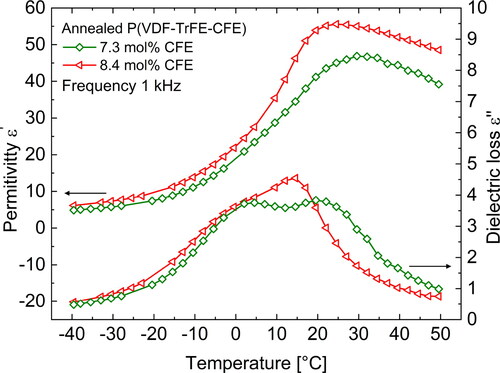
Klein et al. [Citation24] varied the CFE content in the terpolymer between 0 and 9% and studied its influence on the relaxor-ferroelectric and the electromechanical properties. In general, as mentioned in the Introduction, addition of CFE converts the P(VDF-TrFE) copolymer into an RF polymer. However, the crystallinity of the sample decreases with increasing CFE content, and this in turn affects the electrostrictive strain response of the material. Increasing the CFE content to more than 9% reduces crystallinity and Young’s modulus drastically. On the other hand, decreasing the CFE fraction below ∼8% results in a terpolymer with a significant amount of ferroelectric regions [Citation37]. The Curie transition of the material is also affected by the CFE content. shows the dielectric spectra of annealed (at 120 °C) P(VDF-TrFE-CFE) terpolymer samples with two different CFE fractions (7.3 and 8.4 mol%). It can be clearly seen that for a higher CFE content, is lower, which is expected because a higher overall CFE fraction will result in a higher CFE content in the crystalline phase, thus reducing the interaction between P(VDF-TrFE) segments and ultimately lowering the F-P transition temperature [Citation21, Citation25]. In the optimal case when the CFE molar content in the terpolymer is about 8.5 mol%, the material is completely relaxor-ferroelectric in nature and also shows the highest strain with little hysteresis [Citation24]. Addition of CTFE, however, does not affect the crystallinity of the sample much, and the result is similar to that of cross-linking in irradiated P(VDF-TrFE) copolymers where the CTFE units serve as defects that prevent the extent of crystallization and result in thinner crystalline lamellae [Citation27, Citation45]. In comparison with CFE, a higher mol% of CTFE is required to achieve comparable electromechanical properties in the terpolymer [Citation44].
Figure 5. Real and imaginary parts of the complex permittivity ε in P(VDF-TrFE-CFE) with different CFE content at 1 kHz.
6. Effects of processing on crystalline phases and relaxor-ferroelectric properties of the terpolymer
6.1. Effects of thermal annealing
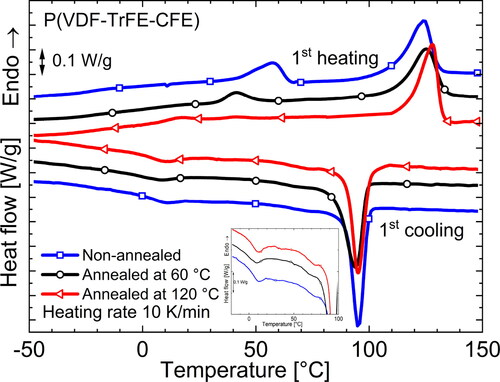
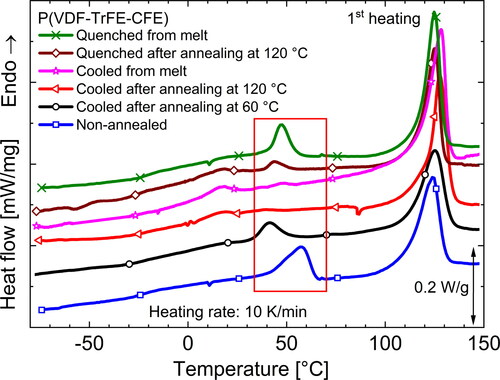
shows the dielectric spectra of terpolymer samples with a monomer ratio of 62.2/29.4/8.4 mol% after different treatments. From the and
curves, it is clear that the temperature of the Curie transition changes after annealing. While
of the non-annealed samples is the highest, samples annealed at 120 °C and at 60 °C (referred to as intermediately annealed or IA sample) show the lowest and an intermediate
value, respectively. Looking at the DSC heating thermograms in , a similar trend is observed for the endothermic peak corresponding to
Figure 6. Real and imaginary parts of the complex permittivity ε in differently thermally processed P(VDF-TrFE-CFE) terpolymer films at 1 kHz.
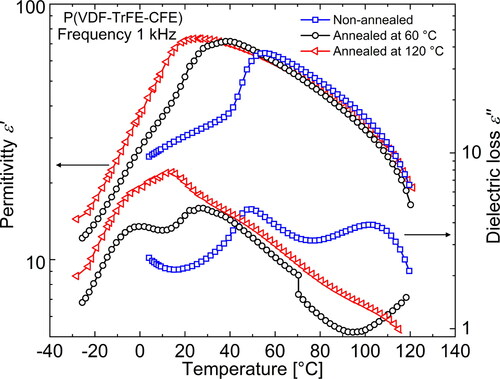
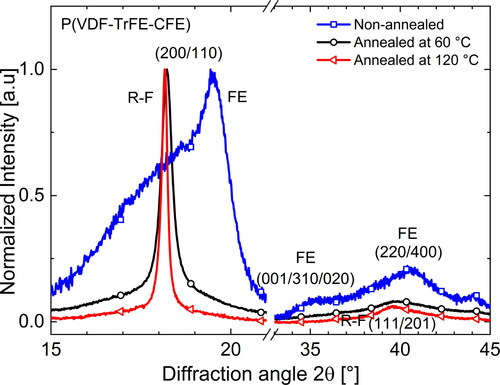
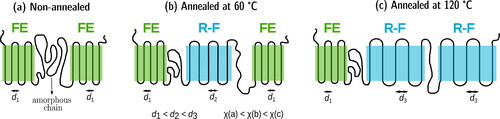
Since the available ferroelectric crystalline regions undergo a phase transition into the paraelectric phase at it is obvious that annealing will affect the fraction of ferroelectric regions in the terpolymer. Bao et al. [Citation22] showed that terpolymers can possess a significant fraction of ferroelectric crystals when samples were crystallized at RT (non-annealed). From a look at the chain conformations, this means that the terpolymer has fewer gauche segments in its crystalline structure and is rich in all-trans conformations. As we know that the addition of CFE molecules stabilizes the gauche conformations, we can infer that fewer CFE molecules are included in the crystalline structure of non-annealed samples. As a result of the stable ferroelectric phase, the Curie transition in the non-annealed sample is found at a higher temperature. On the WAXD scans of differently heat-treated terpolymer samples in , we clearly observe that the non-annealed sample shows strong Bragg reflexes of the ferroelectric (FE) phase at RT, which — upon annealing — change into peaks characteristic for a RF phase [Citation25, Citation28]. While the sample is being annealed, more and more CFE units are added to the crystalline regions — as evident from the increasing inter-plane distance d resulting in a smaller diffraction angle. While the non-annealed sample yields a lower d value of 4.55 Å that is close to the value estimated for the pure P(VDF-TrFE) copolymer [Citation25], the samples annealed at 60 and 120
C yield higher d constants of 4.87 and 4.89 Å, respectively. In agreement with the WAXD results, FTIR measurements at RT show that the non-annealed samples contains a larger fraction of all-trans segments than of segments with gauche conformations [Citation25, Citation46]. Upon annealing, the fraction of all-trans conformations is reduced with a simultaneous increase of
conformations [Citation25, Citation46].
Figure 7. DSC thermograms during the rst heating and cooling runs of dierently annealed P(VDF-TrFE-CFE) terpolymer films*.
From , it is clear that the terpolymer shows superimposed diffraction peaks. When we observe combinations of several Bragg peaks, it is not possible to estimate the coherence length of the crystals from the Scherrer equation [Citation47]. However, for a qualitative analysis, the full widths at half maximum (FWHMs) of the peaks can be compared. Looking at the FWHMs of the peaks near the {200,110} family of planes, annealed samples (both, annealed at 60 and at 120 °C) show lower values than their non-annealed counterpart, indicating bigger crystalline structures. As expected, annealing also increases the crystallinity of the terpolymer. Annealing at 120 °C enhances the crystallinity from 16% in the non-annealed sample to about 35%. Thus, to summarize, it can be stated that annealing leads to a higher CFE fraction in the crystal structure and stabilizes the non-polar gauche conformations in the terpolymer (α and γ phases). As a result, there is less interaction between the polar β crystals, ultimately lowering the Curie transition temperature of the terpolymer. The changes following from different thermal treatments are schematically shown in .
Figure 8. WAXD scans of a P(VDF-TrFE-CFE) ter-polymer at RT after dierent thermal treaments*.
Furthermore, the annealing temperature plays an important role. The fraction of α-phase crystals and the values of the lattice spacing d, of the FWHM and of the crystallinity in the terpolymer annealed at 60 °C are between those of a non-annealed sample and of a sample annealed at 120 °C, which shows that high temperatures of annealing are required for stabilizing the RF terpolymer phase. In support of this statement, Bao et al. [Citation22] found ferroelectric regions in the terpolymer samples if they had been crystallized below 110 °C. In addition, Liu et al. [Citation48] studied morphological changes in a CTFE-containing terpolymer annealed at temperatures between 60 and 140 °C and stated that higher annealing temperatures lead to a more homogeneous growth of crystalline regions and thus also to higher relaxor ferroelectricity.
6.2. Effects of quenching and stretching
The effects of quenching on the different crystalline phases were studied by Klein et al. [Citation23] who reported that additional crystals were formed during quenching of a P(VDF-TrFE-CFE) terpolymer sample when it was crystallized at a temperature and then quenched rapidly to RT. Such crystals that melt at lower temperatures than the crystals formed during isothermal crystallization have a higher fraction of polar all-trans conformations, enhancing terpolymer ferroelectricity. Consequently, the quenched terpolymers show larger hysteresis loops and smaller electrostrictive strains. As
was increased from 112 to 142 °C, the proportion of crystals formed during quenching increased. At
= 142 °C, it amounted to more than 90% of the total number of crystals. At the same time, the electrostrictive strain decreased from −5.9 to −4.2% in samples quenched after crystallization at 112 and 142 °C, respectively.
Gadinski et al. [Citation28] had quenched P(VDF-TrFE-CTFE) samples from the melt in ice water (referred to as TerQ in ) and studied the influence of rapid quenching on the crystalline phases that govern the dielectric hysteresis behavior. They observed that the quenched samples show higher fractions of all-trans conformations when compared to slowly melt-cooled samples (referred to as TerAC in ) and to samples annealed at 90 °C (cooled from the melt before annealing and cooling down to RT; referred to as TerSCAn in ). In addition, quenching resulted in the CTFE terpolymer exhibiting a SHL with a lower saturation polarization () and a higher remanent polarization (
), i.e., opposite to the DHLs with a higher
value and a lower
value observed on the two slowly cooled samples. The differences were explained as a result of the changes in the crystalline phases during quenching. In the case of quenching, the terpolymer is reported to form two roughly equivalent fractions, one rich in TrFE (ferroelectric) and poor in CTFE, and the other one vice-versa (paraelectric-like or relaxor-ferroelectric). On application of an electric field, the existing FE regions are aligned and the RF regions are irreversibly converted into FE regions, which results in SHLs observed for the quenched samples. In the case of the slowly cooled TerAC and TerSCAn samples, the slow crystallization times allow for a sufficient number of CTFE groups to be included in the crystalline structure so that we find a dominant RF phase in the terpolymer. In addition, a significant fraction of a paraelectric (PE) phase with non-polar
conformations are formed [Citation25, Citation28]. Hence, on application of an electric field, the paraelectric regions undergo a reversible transformation into the polar FE phase (PE → FE) where the molecular chains adopt all-trans conformations and the RF regions undergo an irreversible RF → FE transformation [Citation28, Citation49]. The former transformation leads to the observed DHL behavior. The hysteresis curves of the differently treated samples are shown in .
Figure 9. Schematic overview of the crystalline phases in dierently heat-treated terpolymer samples.
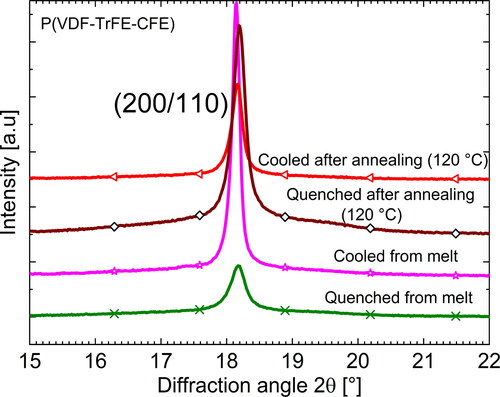
In a similar previous study, we had rapidly quenched P(VDF-TrFE-CFE) terpolymer films either directly from the melt or from the annealed state (at 120 C) in liquid nitrogen [Citation50], thus effectively cooling them to a temperature below their glass transition. As expected, FTIR measurements revealed that samples quenched from the melt show an increase in all-trans conformation compared to their slowly cooled counterparts. On the other hand, samples quenched from their annealed state showed an increase in the overall
conformation when compared with an annealed and slowly cooled terpolymer film. The changes in both types of quenched samples occur at the expense of a corresponding decrease in the
conformation. In addition, WAXD scans () revealed that quenched samples (both from the melt and from the annealed state) show a small shift of the RF peak to higher 2θ values indicating additional trans structures. WAXD experiments also revealed an increase in the FWHM of the RF peak near the {200/110} crystalline planes in the quenched samples, indicating that smaller crystals had formed during quenching.
Figure 10. Polarization-vs.-electric-field hysteresis loops observed on P(VDF-TrFE-CTFE) terpolymer films (a) quenched (TerQ), (b) slowly melt-cooled (TerAC), (c) annealed at 90 C and slowly cooled (TerSCAn). Samples (d) TerQS, (e) TerACS, (f) TerSCAnS are stretched versions of samples (a), (b), (c), respectively. Reprinted with permission from [Citation28]. © 2015 American Chemical Society.
![Figure 10. Polarization-vs.-electric-field hysteresis loops observed on P(VDF-TrFE-CTFE) terpolymer films (a) quenched (TerQ), (b) slowly melt-cooled (TerAC), (c) annealed at 90 ° C and slowly cooled (TerSCAn). Samples (d) TerQS, (e) TerACS, (f) TerSCAnS are stretched versions of samples (a), (b), (c), respectively. Reprinted with permission from [Citation28]. © 2015 American Chemical Society.](/cms/asset/f616de78-595d-4416-a1d4-c191e017abd2/gfer_a_2014260_f0010_c.jpg)
The differences observed after quenching either directly from the melt or from annealed states should be directly related to the states from which the films had been quenched. Upon quenching directly from the melt where the polymer chains are not in a crystalline phase and assume random-coil conformations, the crystals form during rapid cooling. Due to the quenching process, much less time is available for CFE inclusion into the crystalline structure. Therefore, we observe an increase in the β phase upon quenching from the melt. If a sample is quenched from a temperature below its melting point (), primary crystallization takes place at
and sufficient time is available for crystal formation and reorganization (allowing CFE to be included in the crystalline structure). This will result in small amount of secondary crystallites formed during the quenching process, and the trans structures formed during quenching should have been induced by the α-phase crystallites already formed at
Hence, we observe an increase in the γ phase upon quenching from the annealed state (at 120
C) and not in the β phase. This also explains why a P(VDF-TrFE-CTFE) terpolymer crystallized at a lower
exhibits fewer trans structures after quenching than samples crystallized at a higher
— as previously reported by Klein et al. [Citation23].
Gadinski et al. [Citation28] had also stretched their thermally processed samples and studied the impact of stretching. All the stretched samples (cf. ) show SHLs — including the slowly cooled samples that had initially shown DHLs. The nature of the SHLs was affected by the initial state of a sample, i.e., by its thermal history. In the case of the quenched samples, stretching does not influence the FE phase in the CTFE terpolymer, but it reduces the crystal size, which slightly increases the gauche-containing and
segments in the terpolymer. This process increases the overall RF content in the terpolymer. Upon application of an electric field, RF → FE transformation occurs and produces wider SHLs (compared to the slowly cooled and stretched sample) as shown in . With the slowly cooled samples, stretching breaks the big crystals with a
conformation and results in the distribution of CTFE throughout the sample — leading to a larger amount of trans-containing chain segments. Under an electric field, the remaining RF phase transforms into the FE phase, yielding slimmer SHLs (). Similarly, uniaxially stretched P(VDF-TrFE-CFE) films exhibit a significant all-trans FE phase. However, below the Curie transition of the stretch-induced FE phase at
they show DHLs [Citation33], which shows that some amount of RF/PE phase is present in the stretched samples and that the CFE groups stabilize the gauche-containing RF phase in the terpolymer to a greater extent than the CTFE units (cf. Section 5). Stretching of the terpolymers has been shown to increase their transverse electrostrictive strain
from ∼2% at 100 MV/m for an unstretched P(VDF-TrFE-CFE) terpolymer film to a maximum
of about 3% at 150 MV/m [Citation20].
7. Mid-temperature transition(s) in the terpolymer
Over several decades, PVDF-based homo- and co-polymers have again and again been shown to exhibit an intermediate transition between their glass-transition and Curie/melting temperatures (e.g., [Citation51–55]). In spite of its well-known existence, the origin of the transition was not clear, as multiple explanations — some contradictory to each other — have been proposed [Citation56–58]. From a review of the existing literature and from detailed recent experiments, a new hypothesis has been proposed in which the mid-temperature transition(s) is/are described in terms of multiple processes that take place more or less simultaneously in an intermediate temperature range [Citation26, Citation59]. According to our hypothesis, the constrained amorphous phase (CAP) that consists of tie-molecules between the crystallites does not experience a glass transition at which the molecules in the (unconstrained) amorphous phase would start to show motion. Instead, the tie-molecules are unfrozen only at the higher so-called upper glass-transition temperature (). As samples are further heated well above
the tie-molecules attain sufficient energy for a conformational-disorder transition (or α-relaxation) at which the fluorine atoms in the chains with
conformations are switched either up or down (
), a process that is commonly abbreviated as condis. In the same temperature range, secondary crystals formed during storage of the sample or quenching from the melt undergo a secondary transition. In addition, real charges located at the amorphous-crystalline (a-c) interfaces (injected or impurity charges) can be released and contribute to a Maxwell-Wagner interfacial (MWI) polarization. All the above-mentioned processes are observed during DSC measurements in the temperature range between 30 and 90
C, and together, they constitute the transition(s) at the characteristic temperature (
). From the above, it is clear that the CAP and the a-c interface play important roles in the transition(s). Not only on PVDF-based homo- and co-polymers, but also on the related terpolymers, the
transition has been regularly found [Citation26, Citation43, Citation46].
The transition is profoundly affected by sample processing and preparation. shows the mid-temperature transition (within the red box) in a P(VDF-TrFE-CFE) (62.2/29.4/8.4 mol%) terpolymer subjected to various thermal processes. In general, samples that have either been quenched or were not subjected to any heat treatments are expected to show a strong endothermic DSC peak [Citation26, Citation59] because both thermal histories result in a high fraction of tie-molecules (in the CAP) [Citation54, Citation60, Citation61], as well as chain loops and cilia (present at the a-c interface) [Citation57], which leads to a strong condis process at
In addition, quenching will lead to the formation of crystals with lower melting points, and the absence of thermal treatment can promote slow crystallization in the amorphous phase. Hence, secondary crystals are also formed as a result of the preparation steps, and we typically observe a superimposed
peak in DSC scans. As explained in sections 6.1 and 6.2, both a non-annealed and quenched terpolymer sample contains a significant amount of FE phase, which shifts
into the temperature range where the mid-temperature transition is observed. As a result, we find one combined peak (cf. ). Even though Gadinski et al. [Citation28] identified the corresponding endothermic peak in quenched CTFE-based terpolymer samples as FE →PE (Curie) transition (see section 6.2), the presence of an additional endotherm at around 20 °C in the DSC thermogram of a quenced sample after annealing at 120 °C (brown curve in ) — corresponding to its Curie transition indicates that there are different processes. Our FTIR studies on CFE-based terpolymer samples quenchded after annealing at 120 °C revealed no change in the observed fraction of the FE β-phase and only a small increase in the weakly polar γ phase in comparison to a sample slowly cooled after annealing at 120 °C [Citation50]. This is confirmed by the presence of an identical
in . In agreement with FTIR spectra, the WAXD scans on annealed and quenched P(VDF-TrFE-CFE) samples in do not reveal any FE peaks. Furthermore, the shape of the endothermic DSC peak of the non-annealed sample (rich in FE phase) in suggests a shoulder around 50 °C — indicating more than one process.
Figure 11. WAXD scans of quenched and slowly cooled P(VDF-TrFE-CFE) terpolymer films around the peaks belonging to the {200/110} family of crystal planes
It is well known that annealing (at high temperatures) promotes the growth of new crystallites and stabilizes the structure of imperfect crystallites (for example in the CAP), which increases overall sample crystallinity. In this case, we would expect a minimum contribution from and melting due to secondary crystals. Hence, the major contribution to the
process comes from condis which is found in α-phase crystals by default, irrespective of the heat treatment and which would lead to a weak
transition in an annealed sample (). Since annealing also stabilizes the RF phase in the terpolymer, the
process is shifted to lower temperature and thus observed separately in the DSC thermogram. A similar phenomenon can be expected for a terpolymer sample slowly cooled from the melt if enough time is available for crystallization. However, an intermediately annealed sample (at 60 °C), as stated in section 6.1, shows the presence of an FE phase, and this again leads to a situation as in the quenched samples where a certain fraction of the CAP could be present due to the low temperature of annealing and an overlap of the
process with the
transition may occur. Though the processes can overlap during heating in DSC, they are separated upon cooling as seen in the inset of . After heating above its melting point, the thermal history of the sample is erased. Hence, the samples show similar
values on cooling that are separated from
(observed around 75 °C).
Figure 12. Mid-temperature transition(s) (inside the red box) as seen in DSC thermograms during first heating of various thermally processed P(VDF-TrFE-CFE) terpolymer films
The mid-temperature transition affects the dielectric and electromechanical properties of ferroelectric and relaxor-ferroelectric polymers. For the terpolymer, the transition was shown to affect the dielectric hysteresis behavior [Citation46]. In particular, the mobility of the CAP changes at
which affects the response of the dipoles to an applied electric field. A P(VDF-TrFE-CFE) terpolymer film shows its characteristic slim hysteresis curve only above
which is also affected by the processing conditions. In the range of
an increase of the pyro- and piezo-electricity was observed on PVDF and P(VDF-TrFE) [Citation62,Citation63], and it was stated that condis leads to a thickness increase of crystallites in semi-crystalline regions [Citation62]. Charges causing MW interfacial polarization have also been shown to stabilize dipole alignment [Citation64]. Similar effects can be expected in the VDF-based terpolymers. As mentioned in section 3.3, a maximum electrocaloric effect was observed at 55 °C, i.e., in the temperature range of
8. Conclusions
Mainly due to their attractive relaxor-ferroelectric (RF) properties and their capabilities for thin-film processing, poly(vinylidene fluoride-trifluoroethylene) (P(VDF-TrFE))-based terpolymers with CFE or CTFE as the termonomer received increased attention over the past decade. In this review, structure-property relationships in semi-crystalline P(VDF-TrFE)-based terfluoropolymers have been summarized. The nature of the termonomer, as well as the composition and the influence of processing conditions on the crystalline and amorphous phases and their interface regions (three-phase system) in the terpolymer have been discussed in detail. The effects of processing on the so-called mid-temperature transition have also been reviewed.
The RF properties of the terpolymer are governed by the chemical structures of the individual monomers and the three phases of the semi-crystalline polymer. Terpolymers similar to VDF-based homo- and co-polymers can crystallize into at least five different phases with three types of chain conformations. Out of the five phases, the α, β and γ phases with all-trans and
chain conformation, respectively, are most often observed. The β phase has the highest overall dipole moment and leads to the strongest ferroelectric effect in VDF-based polymers. In order to achieve the all-trans conformation, VDF chains they are usually stretched and poled or copolymerized with a second fluorine-contaning comonomer such as TrFE. Thus, P(VDF-TrFE) copolymers exhibit good ferroelectric properties even without stretching. By introducing defects into P(VDF-TrFE), either physically by radiation-induced cross-linking or chemically by adding a third fluorine-containing termonomer, it is possible to reduce the dipole-dipole interactions between VDF/TrFE segments, which leads to polymers that show a higher fraction of
and
conformations in their crystalline structure, resulting in RF behavior.
RF terpolymers based on the termonomers chlorofluoroethylene (CFE) and chlorotrifluoroethylene (CTFE) typically show high permittivities with a low Ferroelectric-to-Paraelectric (F-P or Curie) transition temperature () close to room-temperature (RT). They usually exhibit very slim hysteresis loops with very low remanent-polarization (
) and coercive-field (
) values. In addition, double-hysteresis loops (DHLs) are often observed at high electric fields and explained with a pinning mechanism caused by the termonomers. The termonomers exhibit very useful electromechanical properties: A P(VDF-TrFE-CFE) terpolymer can have longitudinal and transverse strains of 7% and 2%, respectively — higher than the values observed for other RF polymers and on ceramic materials. Similarly, a large electrocaloric effect is found in the terpolymer: At 55 °C, an adiabatic temperature change of 12 °C was reported with a large change of 55 J/KgK in isothermal entropy.
The type and amount of the termonomer governs the extent to which terpolymers show RF behavior. In general, CFE groups are more effective than CTFE groups, since a lower mol% of CFE is required for the resulting terpolymer to exhibit RF properties and since the terpolymer shows higher electrostrictive strain than that based on CTFE. CTFE, being a larger molecule than CFE and possessing a lower dipole moment, stabilizes the all-trans structures to a greater extent. This results in a P(VDF-TrFE-CTFE) terpolymer exhibiting single hysteresis loops (SHLs). Processing has a major influence on the three phases of the terpolymer and this in turn affects the final RF properties. Annealing leads to a decrease in the number of ferroelectric all-trans regions in the terpolymer with a corresponding increase in the regions containing gauche conformations, which further reduces the value compared to that of a non-annealed sample. Higher temperatures of annealing close to the respective melting point are required to effectively modify the crystalline regions, as an intermediately annealed sample shows only a
value between those of completely annealed and of non-annealed samples.
On the other hand, quenching increases the amount of trans conformations and thus the ferroelectric nature of the terpolymer. The fraction of trans conformations formed as a result of quenching depends upon the temperature from which the sample is quenched. In the case of a P(VDF-TrFE-CTFE) terpolymer, quenching leads to SHLs, while the slowly cooled samples show DHL behavior that is believed to be a result of reversible PE → FE transitions. Stretching induces more β phase in the terpolymer and hence, irrespective of the heat treatment, yields an irreversible RF → FE transition with only SHLs. The various processing schemes also affect the mid-temperature transition(s) observed at () in the terpolymer. Mid-temperature transition(s) consist of multiple processes taking place between the glass and melting transitions. The fraction of the constrained amorphous phase (CAP) and its interface with the crystalline phase (a-c interface) play vital roles in determining the extent to which each of these processes contributes to the overall observed
transition(s). Quenching or the absence of any heat treatment will lead to a higher fraction of CAP in the terpolymer and result in the strong manifestation of
phemonena. On the other hand, annealing at high temperatures and slow cooling from the melt lead to the least amount of CAP. In this case, a weak
transition is observed. Since the
value of the terpolymer lies in the temperature range of the
transition and since it is also affected by processing, the two transitions often superimpose. As the
transition increases molecular mobility, the terpolymer shows optimum dielectric hysteresis and electromechanical properties in this temperature range.
Footnote
Symbols have been added to continuously measured curves in order to facilitate their identification.
References
- H. S. Nalwa, Ferroelectric Polymers: Chemistry, Physics, and Applications (M. Dekker, Inc, New York, 1995).
- Q. Li, and Q. Wang, Ferroelectric polymers and their energy-related applications, Macromol. Chem. Phys. 217 (11), 1228 (2016). DOI: https://doi.org/10.1002/macp.201500503.
- P. Martins, A. C. Lopes, and S. Lanceros-Mendez, Electroactive phases of poly(vinylidene fluoride): determination, processing and applications, Prog. Polym. Sci. 39 (4), 683 (2014). DOI: https://doi.org/10.1016/j.progpolymsci.2013.07.006.
- J. C. Scott, and L. D. Bozano, Nonvolatile memory elements based on organic materials, Adv. Mater. 19 (11), 1452 (2007). DOI: https://doi.org/10.1002/adma.200602564.
- S. Bauer, and F. Bauer, Piezoelectric polymers and their applications. In Piezoelectricity, Springer Series in Materials Science (Springer, Berlin, 2008), pp. 157–177.
- A. J. Lovinger, Ferroelectric polymers, Science 220 (4602), 1115 (1983). DOI: https://doi.org/10.1126/science.220.4602.1115.
- A. J. Lovinger et al., Structural, dielectric, and thermal investigation of the Curie transition in a tetrafluoroethylene copolymer of vinylidene fluoride, J. Appl. Phys. 56 (9), 2412 (1984). DOI: https://doi.org/10.1063/1.334303.
- T. Furukawa, Ferroelectric properties of vinylidene fluoride copolymers, Phase Transit. 18 (3–4), 143 (1989). DOI: https://doi.org/10.1080/01411598908206863.
- T. Furukawa, Recent advances in ferroelectric polymers, Ferroelectrics 104 (1), 229 (1990). DOI: https://doi.org/10.1080/00150199008223826.
- R. G. Kepler, and R. A. Anderson, Ferroelectric polymers, Adv. Phys. 41 (1), 1 (1992). DOI: https://doi.org/10.1080/00018739200101463.
- A. J. Lovinger, Annealing of poly(vinylidene fluoride) and formation of a fifth phase, Macromolecules 15 (1), 40 (1982). DOI: https://doi.org/10.1021/ma00229a008.
- G. M. Sessler, Piezoelectricity in polyvinylidenefluoride, J. Acoust. Soc. Am. 70 (6), 1596 (1981). DOI: https://doi.org/10.1121/1.387225.
- D. K. Das-Gupta, and K. Doughty, Corona charging and the piezoelectric effect in polyvinylidene fluoride, J. Appl. Phys. 49 (8), 4601 (1978). DOI: https://doi.org/10.1063/1.325441.
- K. Nakamura, and Y. Wada, Piezoelectricity, pyroelectricity, and the electrostriction constant of poly(vinylidene fluoride), J. Polym. Sci. A-2 Polym. Phys. 9 (1), 161 (1971). DOI: https://doi.org/10.1002/pol.1971.160090111.
- A. J. Lovinger et al., On the Curie temperature of poly(vinylidene fluoride), Macromolecules 19 (5), 1491 (1986). DOI: https://doi.org/10.1021/ma00159a036.
- Q. M. Zhang et al., Characteristics of the electromechanical response and polarization of electric field biased ferroelectrics, J. Appl. Phys. 77 (6), 2549 (1995). DOI: https://doi.org/10.1063/1.358785.
- A. Odajima et al., Irradiation effects on the ferroelectric phase transition of vinylidene fluoride and trifluoroethylene copolymers, Presented at the 5th International Symposium on Electrets, Heidelberg, West Germany, 4–6 Sept. 1985, pp. 642–647. DOI: https://doi.org/10.1109/ISE.1985.7341550.
- Q. M. Zhang, V. Bharti, and X. Zhao, Giant electrostriction and relaxor ferroelectric behavior in electron-irradiated poly(vinylidene fluoride-trifluoroethylene) copolymer, Science 280 (5372), 2101 (1998). DOI: https://doi.org/10.1126/science.280.5372.2101.
- T. C. Chung, and A. Petchsuk, Synthesis and properties of ferroelectric fluoroterpolymers with Curie transition at ambient temperature, Macromolecules 35 (20), 7678 (2002). DOI: https://doi.org/10.1021/ma020504c.
- F. Bauer et al., Ferroelectric copolymers and terpolymers for electrostrictors: synthesis and properties, IEEE Trans. Dielect. Electr. Insul. 11 (2), 293 (2004). DOI: https://doi.org/10.1109/TDEI.2004.1285900.
- T. Raman Venkatesan et al., Relaxation processes and structural transitions in poly(vinylidene fluoride-trifluoroethylene-chlorofluoroethylene) relaxor-ferroelectric terpolymers as seen in dielectric spectroscopy, IEEE Trans. Dielect. Electr. Insul. 25 (6), 2229 (2018). DOI: https://doi.org/10.1109/TDEI.2018.007440.
- H.-M. Bao et al., Phase transitions and ferroelectric relaxor behavior in P(VDF-TrFE-CFE) terpolymers, Macromolecules 40 (7), 2371 (2007). DOI: https://doi.org/10.1021/ma062800l.
- R. J. Klein, J. Runt, and Q. M. Zhang, Influence of crystallization conditions on the microstructure and electromechanical properties of poly(vinylidene fluoride-trifluoroethylene- chlorofluoroethylene) terpolymers, Macromolecules 36 (19), 7220 (2003). DOI: https://doi.org/10.1021/ma034745b.
- R. J. Klein et al., Influence of composition on relaxor ferroelectric and electromechanical properties of poly(vinylidene fluoride-trifluoroethylene-chlorofluoroethylene), J. Appl. Phys. 97 (9), 094105 (2005). DOI: https://doi.org/10.1063/1.1882769.
- T. Raman Venkatesan, P. Frübing, and R. Gerhard, Influence of composition and preparation on crystalline phases and morphology in poly(vinylidene fluoride-trifluoroethylene-chlorofluoroethylene) relaxor-ferroelectric terpolymer, presented at the 2018 IEEE 2nd International Conference on Dielectrics (ICD), Budapest, Hungary, 2018, pp. 1–4. DOI: https://doi.org/10.1109/ICD.2018.8468492.
- T. Raman Venkatesan, and R. Gerhard, Origin of the mid-temperature transition in vinylidenefluoride-based ferro-, pyro- and piezoelectric homo-, co- and ter-polymers, Mater. Res. Express. 7 (6), 065301 (2020). DOI: https://doi.org/10.1088/2053-1591/ab842c.
- T. C. Chung, A. Petchsuk, and G. W. Taylor, Ferroelectric polymers with large electrostriction; based on semicrystalline VDF/TrFE/CTFE terpolymers, Ferroelectr. Lett. 28 (5–6), 135 (2001). DOI: https://doi.org/10.1080/07315170108202957.
- M. R. Gadinski et al., Understanding of relaxor ferroelectric behavior of poly(vinylidene fluoride-trifluoroethylene-chlorotrifluoroethylene) terpolymers, Macromolecules 48 (8), 2731 (2015). DOI: https://doi.org/10.1021/acs.macromol.5b00185.
- F. Bauer, Review on the properties of the ferrorelaxor polymers and some new recent developments, Appl. Phys. A. 107 (3), 567 (2012). DOI: https://doi.org/10.1007/s00339-012-6831-8.
- T. Stubning, I. Denes, and R. Gerhard, Tuning electro-mechanical properties of EAP-based haptic actuators by adjusting layer thickness and number of stacked layers—a comparison, Eng. Res. Express. 3 (1), 015015 (2021). DOI: https://doi.org/10.1088/2631-8695/abd286.
- M. Wübbenhorst, X. Zhang, and T. Putzeys, Polymer Electrets and Ferroelectrets as EAPs: Characterization (Springer International Publishing, New York, 2016), 591–623.
- N. Tsutsumi et al., Re-evaluation of the origin of relaxor ferroelectricity in vinylidene fluoride terpolymers: An approach using switching current measurements, Sci. Rep. 7 (1), 15871 (2017). DOI: https://doi.org/10.1038/s41598-017-16017-w.
- L. Yang et al., Novel polymer ferroelectric behavior via crystal isomorphism and the nanoconfinement effect, Polymer 54 (7), 1709 (2013). DOI: https://doi.org/10.1016/j.polymer.2013.01.035.
- L. Yang et al., Relaxor ferroelectric behavior from strong physical pinning in a poly(vinylidene fluoride- co -trifluoroethylene- co -chlorotrifluoroethylene) random terpolymer, Macromolecules 47 (22), 8119 (2014). DOI: https://doi.org/10.1021/ma501852x.
- K. Ohwada and Y. Tomita, Experiment and theory of Pb(In1/2Nb1/2)O3: antiferroelectric, ferroelectric, or relaxor state depending on perovskite b-site randomness, J. Phys. Soc. Japan 79 (1), 011012 (2010). DOI: https://doi.org/10.1143/JPSJ.79.011012.
- A. Chauhan et al., Anti-ferroelectric ceramics for high energy density capacitors, Materials 8 (12), 8009 (2015). DOI: https://doi.org/10.3390/ma8125439.
- F. Bauer, Relaxor fluorinated polymers: novel applications and recent developments, IEEE Trans. Dielectr. Electr. Insul. 17 (4), 1106 (2010). DOI: https://doi.org/10.1109/TDEI.2010.5539681.
- B. A. Tuttle, and D. A. Payne, The effects of microstructure on the electrocaloric properties of Pb (Zr, Sn, Ti) O3 ceramics, Ferroelectrics 37 (1), 603 (1981). DOI: https://doi.org/10.1080/00150198108223496.
- Y. V. Sinyavsky, and V. M. Brodyansky, Experimental testing of electrocaloric cooling with transparent ferroelectric ceramic as a working body, Ferroelectrics 131 (1), 321 (1992). DOI: https://doi.org/10.1080/00150199208223433.
- A. S. Mischenko et al. , Giant electrocaloric effect in thin-film PbZr(0.95)Ti(0.05)O3, Science 311 (5765), 1270 (2006). DOI: https://doi.org/10.1126/science.1123811.
- B. Neese et al., Large electrocaloric effect in ferroelectric polymers near room temperature, Science 321 (5890), 821 (2008). DOI: https://doi.org/10.1126/science.1159655.
- B. Neese et al., Electrocaloric effect of the relaxor ferroelectric poly(vinylidene fluoride-trifluoroethylene-chlorofluoroethylene) terpolymer, Appl. Phys. Lett. 94 (4), 042910 (2009). DOI: https://doi.org/10.1063/1.3077189.
- T. Raman Venkatesan et al., Non-linear dielectric spectroscopy for detecting and evaluating structure-property relations in a P(VDF-TrFE-CFE) relaxor-ferroelectric terpolymer, Appl. Phys. A. 127 (10), 756 (2021). DOI: https://doi.org/10.1007/s00339-021-04876-0.
- F. Xia et al., High electromechanical responses in a poly(vinylidene fluoride-trifluoroethylene-chlorofluoroethylene) terpolymer, Adv. Mater. 14 (21), 1574 (2002). DOI: https://doi.org/10.1002/1521-4095(20021104)14:21<1574::AID-ADMA1574>3.0.CO;2-#.
- G. S. Buckley et al., Electrostrictive properties of poly(vinylidenefluoride- trifluoroethylene-chlorotrifluoroethylene), Chem. Mater. 14 (6), 2590 (2002). DOI: https://doi.org/10.1021/cm0116471.
- T. Raman Venkatesan et al., Tuning the relaxor-ferroelectric properties of poly(vinylidene fluoride-trifluoroethylene-chlorofluoroethylene) terpolymer by thermally induced micro- and nanostructures. Manuscript submitted for publication, 2021.
- F. Bargain et al., From solvent-cast to annealed and poled Poly(VDF- co -TrFE) films: new insights on the defective ferroelectric phase, Polymer 105, 144 (2016). DOI: https://doi.org/10.1016/j.polymer.2016.10.010.
- Q. Liu, C. Richard, and J.-F. Capsal, Control of crystal morphology and its effect on electromechanical performances of electrostrictive P(VDF-TrFE-CTFE) terpolymer, Eur. Polym. J. 91, 46 (2017). DOI: https://doi.org/10.1016/j.eurpolymj.2017.03.046.
- S. Zhang et al., Direct spectroscopic evidence of field-induced solid-state chain conformation transformation in a ferroelectric relaxor polymer, J. Appl. Phys. 99 (4), 044107 (2006). DOI: https://doi.org/10.1063/1.2169659.
- T. Raman Venkatesan, P. Frübing, and R. Gerhard, Modifying crystallinity and morphology in the relaxor-ferroelectric terpolymer P(VDF-TrFE-CFE) by means of rapid quenching, presented at 2019 IEEE 17th International Symposium on Electrets (ISE), 2019, pp. 68.
- K. Nakagawa, and Y. Ishida, Dielectric relaxations and molecular motions in poly(vinylidene fluoride) with crystal form II, J. Polym. Sci. A-2 Polym. Phys. 11 (8), 1503 (1973). DOI: https://doi.org/10.1002/pol.1973.180110804.
- J. B. Enns, and R. Simha, Transitions in semicrystalline polymers. I. poly(vinyl fluoride) and poly(vinylidene fluoride), J. Macromol. Sci. B. 13 (1), 11 (1977). DOI: https://doi.org/10.1080/00222347708208750.
- Y. Miyamoto, H. Miyaji, and K. Asai, Anisotropy of dielectric relaxation in crystal form II of poly(vinylidene fluoride), J. Polym. Sci.: Poly. Phys. 18 (3), 597 (1980). DOI: https://doi.org/10.1002/pol.1980.180180318.
- C. Leonard et al., DSC studies on the transitions in poly(vinylidenefluoride) and some related copolymers, Polym. Bull. 11 (2), 195 (1984). DOI: https://doi.org/10.1007/BF00258030.
- P. Frübing, F. Wang, and M. Wegener, Relaxation processes and structural transitions in stretched films of polyvinylidene fluoride and its copolymer with hexafluoropropylene, Appl. Phys. A. 107 (3), 603 (2012). DOI: https://doi.org/10.1007/s00339-012-6838-1.
- K. Loufakis, and B. Wunderlich, Thermal analysis of the conformational disorder in semicrystalline poly(vinylidene fluoride) and poly(trifluoroethylene), Macromolecules 20 (10), 2474 (1987). DOI: https://doi.org/10.1021/ma00176a026.
- M. Neidhöfer et al., Structural evolution of PVDF during storage or annealing, Polymer 45 (5), 1679 (2004). DOI: https://doi.org/10.1016/j.polymer.2003.12.066.
- R. F. Boyer, Glassy transitions in semicrystalline polymers, J. Polym. Sci, C. Polym. Symp. 50 (1), 189 (1975). DOI: https://doi.org/10.1002/polc.5070500114.
- T. Raman Venkatesan et al., The mystery behind the mid-temperature transition(s) in vinylidenefluoride-based homo-, co- and terpolymers - has the puzzle been solved? IEEE Trans. Dielect. Electr. Insul. 27 (5), 1446 (2020). DOI: https://doi.org/10.1109/TDEI.2020.008865.
- R. Seguela, Critical review of the molecular topology of semicrystalline polymers: The origin and assessment of intercrystalline tie molecules and chain entanglements, J. Polym. Sci. B Polym. Phys. 43 (14), 1729 (2005). DOI: https://doi.org/10.1002/polb.20414.
- A. Lustiger, and R. L. Markham, Importance of tie molecules in preventing polyethylene fracture under long-term loading conditions, Polymer 24 (12), 1647 (1983). DOI: https://doi.org/10.1016/0032-3861(83)90187-8.
- G. Teyssèdre, and C. Lacabanne, Study of the thermal and dielectric behavior of P(VDF-TrFE) copolymers in relation with their electroactive properties, Ferroelectrics 171 (1), 125 (1995). DOI: https://doi.org/10.1080/00150199508018427.
- G. E. Johnson et al., Thermal piezoelectric stability of poled uniaxially-and biaxially-oriented poly(vinylidene fluoride), Ferroelectrics 32 (1), 43 (1981). DOI: https://doi.org/10.1080/00150198108238672.
- R. M. Faria, A. Jorge, and O. N. Oliveira, A novel space-charge effect in thermally stimulated current measurements on β-PVDF, J. Phys. D: Appl. Phys. 23 (3), 334 (1990). DOI: https://doi.org/10.1088/0022-3727/23/3/011.