
 ?Mathematical formulae have been encoded as MathML and are displayed in this HTML version using MathJax in order to improve their display. Uncheck the box to turn MathJax off. This feature requires Javascript. Click on a formula to zoom.
Abstract
[011]-oriented unpoled relaxor ferroelectric Pb(In1/2Nb1/2)O3-Pb(Mg1/3Nb2/3)O3-PbTiO3 crystals are studied by means of acoustic emission and dielectric methods in dependence on both temperature and dc bias electric field. The rhombohedral-cubic ferroelectric phase transition and the dielectric maximum as well as the intermediate temperature are successfully detected. Both rhombohedral-cubic ferroelectric phase transition and the dielectric maximum are studied in dependence on dc bias electric field, too. No the critical end point, but the tricritical one is detected. Existence of the supercritical behavior is discussed in these crystals.
1. Introduction
The Pb-based relaxor ferroelectrics (RFEs) are the objects of scrupulous study due to their fundamental intrinsic chemical chaos on their B-sites, in contrast to ordering ferroelectrics (FEs) [Citation1]. Such a chemical chaos is known to be a reason to arise the quenched random electric fields [Citation2], which in turn is a reason of nucleation of polar nanoregions (PNRs) [Citation3]. It is well documented that the PNRs nucleate below high-lying Burns temperature, TB, start to grow below the intermediate temperature, T*, provide a huge, smeared and frequency dependent maximum of a dielectric constant, ɛ, at temperature, Tm, [Citation4–6], and freeze below the freezing temperature, Tf, [Citation5, Citation6], as the temperature decreases, in case of canonical RFEs. While, in case of non-canonical RFEs with FE doping, Tf, is replaced by the Curie temperature, Tc, of a spontaneous FE phase transition, as the temperature decreases [Citation1, Citation6].
During last decade the two effects, resulting from the application of a bias dc electric field, E, to RFEs, have been revealed.
The first effect consists in non-trivial behavior of Tm in dependence on E and is called the V-shape, i.e. in initial the Tm retains constant or slightly increases, then decreases and attains the minimum (turning point) at a some small threshold field, Eth, and then increases as happens in normal FEs with a 2nd-order phase transition, as E enhances [Citation7]. The V-shape effect is observed in PbMg1/3Nb2/3O3-xPbTiO3 (PMN-xPT) crystals with different orientations [Citation7–9], and is concluded to be a competition between both the random fields and E when affecting the PNRs [Citation7].
The second effect consists in the existence of a critical end point (CEP) of a liquid-vapor type, where the piezoelectric modulus is maximum due polarization rotation through a monoclinic phase, above which the supercritical behavior starts, instead of the tricritical point (TCP), in the bias electric field-temperature, E-T, phase diagram of [111]-oriented PMN-xPT crystals [Citation10]. The existence of such a CEP is explained due to coincidence of both low-temperature rhombohedral phase and direction of E, resulting in merging the low-temperature rhombohedral and high-temperature cubic phases without a boundary in [111]-oriented crystals, whereas in crystals with other orientations are shown to exist several interim boundaries and no CEP would expected to be exist. However, in [110]-oriented crystals the situation is similar to that of [111]-oriented crystals and the CEP exists [Citation11]. While, the CEP is observed in [111]-oriented pure PMN crystals [Citation12, Citation13], no CEPs is observed in both [110]- and [100]-oriented pure PMN crystals in the vicinity of turning points of Tm and the TCP is not attained [Citation13]. Later it is shown that the CEP (referred as CP) exists in the vicinity of the turning point of Tm in [100]-oriented PMN-xPT crystals [Citation14] due to the observation of a piezoelectric modulus maximum similar to those observed in both [111]- and [110]-oriented PMN-xPT crystals [Citation10, Citation11]. This statement is then discussed based on the observation of a pyroelectric current maximum, γm, in [100]-oriented PMN-xPT crystals, pointing out the CEP in a vicinity of the turning point of Tm, where a so-called Widom line presumably begins instead of 2nd order FE transition [Citation15]. It is stress to note that no words concerning the TCP are made.
Along with both piezoelectric and pyroelectric data, the CEP is presumably detected using an acoustic emission (AE) in [001]-oriented PMN-xPT crystals [Citation9]. A justification for application of AE to detect the CEP is caused by an approximately proportional correspondence between the strains and its count rate values [Citation16–18]. Worth noting that all the CEPs, determined in PMN-xPT by a maximum of piezoelectric modulus [Citation14], pyroelectric current [Citation15], and AE [Citation9], are localized around the turning point of Tm.
PMN is well-known to be a typical model of RFE exhibiting a large and smeared maximum of the real part of a dielectric constant, ɛ’, without undergoing any structural phase transition within a cubic phase and so is called a canonical RFE. Adding a ferroelectric PT to PMN transforms the canonical RFE PMN to non-canonical PMN-xPT one because of the spontaneous appearance of a ferroelectric rhombohedral phase, lying on some degrees below Tm, replacing a nonergodic state below Tf [Citation1, Citation6]. Further addition an antiferroelectric Pb(In1/2Nb1/2)O3 (PIN) to PMN-xPT provides an appearance of both orthorhombic and tetragonal phases along with both rhombohedral and cubic ones in the dependence on a PIN amount, especially of the poled crystals [Citation19–22], demonstrating a sequence the FEs phase transitions, whereas the unpoled PIN-PMN-PT crystals undergo a rhombohedral-cubic FEs phase transition only [Citation23].
Despite of such a number of the phase transitions in the PIN-PMN-PT system only some of them are studied in dependence on dc electric field E: temperatures of both rhombohedral-tetragonal, Trt, and tetragonal-cubic, Ttc, phase transitions in [001]-oriented (0.25–0.35)PIN-(0.45–0.33)PMN-(0.30–0.32)PT crystals [Citation24], of both Trt and Ttc phase transitions, as well as Tm in [001]-oriented 0.34PIN-0.25PMN-0.41PT crystals [Citation25], of rhombohedral-cubic, Trc, and Tm in [111]-oriented 0.23PIN-0.52PMN-0.25PT crystals [Citation26]. The reconstructed data of Tm in the dependence on E during heating from two latter works are shown in . It is clearly seen that both Tm exhibit the V-shape with Eth ≈ 1.5 kV/cm [Citation25], Eth ≈ 2 kV/cm [Citation26], respectively, as E enhances.
Figure 1. The reconstructed plots of the maximum temperatures, Tm, of the real part of a dielectric constant, ɛ’, in dependence on a bias dc field, E, of the PIN-PMN-PT crystals Refs. [Citation25, Citation26].
![Figure 1. The reconstructed plots of the maximum temperatures, Tm, of the real part of a dielectric constant, ɛ’, in dependence on a bias dc field, E, of the PIN-PMN-PT crystals Refs. [Citation25, Citation26].](/cms/asset/71155d40-a5cf-4d2c-b7cb-39d273753a6d/gfer_a_2215518_f0001_b.jpg)
TB, estimated from Brillouin light scattering, is approximately 590 °C in [001]- and [011]-oriented 0.26PIN-0.46PMN-0.28PT crystals [Citation27], whereas the T* is not detected in PIN-PMN-PT system at all. Also it would be interesting to detect the T*and study its dependence on a bias electric field as well as to detect the CEP because of its significance for applications, and the TCP in PIN-PMN-PT crystals, too. Over the past decade an AE has proven itself to be a very reliable method to detect all the phase transitions and characteristic points [Citation28–31], as well as their behaviors under a bias electric field in some Pb-based RFEs [Citation9, Citation30].
Based on our experience of detecting the phase transitions and characteristic points in RFEs, we have applied an AE method to detect phase transition temperatures and characteristic points as well as their behaviors under a bias electric field in [011]-oriented unpoled 0.26PIN-0.46PMN-0.28PT crystals.
2. Experiment
The ternary 0.26PIN–0.46PMN–0.28PT single crystals used in the current study were supplied by TRS Technologies Inc. They were grown by the modified Bridgman method. Samples were oriented along the [011] direction and the largest (011) surfaces were vacuum-sputtered by gold to apply a bias electric field [Citation21].
The AE technique is described in great details elsewhere [Citation9]. A crystal plate with the gold contacts is pasted with a silver epoxy to the polished side of a fused silica acoustic rod waveguide. A PZT-19 disk piezoelectric sensor is attached to the rear end of the waveguide. The sensor is electrically coupled to a 500 kHz band-pass low noise variable (up to 40 dB) preamplifier connected to a detector-amplifier (40 dB). A Ch-Al thermocouple junction is glued to the waveguide near the crystal. The higher part of the acoustic waveguide with the pasted sample is mounted in a resistance element tube furnace.
The dielectric data were measured using a HP4263A LCR meter wired to the sample. The thermocouple, amplifier, and LCR meter outputs were interfaced with a PC for coupled readout. The measurement of both the real part of a dielectric constant ɛ’ and AE count rate (s−1) was performed in the temperature range of 100 ÷ 300 °C with a rate of about 1–3 °C/min. When measuring the AE count rate
under a bias electric field, a high voltage supply was wired to the crystal instead of the LCR meter and the data were recorded by a step of 0.1 kV/cm and up to 0.9 kV/cm of the applied bias field E.
Before each cycle, the crystals are annealed at temperature of 400 °C for 15 min and then measure both dielectric and AE data during cooling and heating under the bias electric field E (field heating after field cooling regime (FHaFC)).
3. Results and discussion
presents both the real part of a dielectric constant, ɛ’, and the AE count rate, data in absence of an applied bias field E. ɛ’ ≈ 4.5·104 exhibits a relatively sharp, or relatively smeared, maximum, at Tm ≈ 150 °C. Inset presents a gradually decrease of ɛ’ and gradually increase of Tm with increasing the measuring frequency, characteristic for RFEs [Citation1, Citation2]. No temperature hysteresis of Tm is observed in agreement with those observed in PMN-xPT (x = 0.13 and 0.24) [Citation14], and [111]- and [001]-oriented PMN-0.2PT crystals [Citation15]. Both ɛ’ and Tm shift in dependence on frequency are in good accordance with the previously measured data for the PIN-PMN-PT crystals with close compositions but different orientations [Citation19–22, Citation26, Citation32, Citation33]. Another low-temperature slightly seen and very smeared ɛ’ dielectric anomaly around 125 °C resembles that clearly seen in [011]-oriented unpoled 0.26PIN–0.46PMN–0.28PT crystals, which is obviously corresponds to a rhombohedral-cubic phase transition at Trc [Citation21].
Figure 2. The plot of a temperature dependence of both the real part of a dielectric constant, ɛ’, and the AE count rate, in absence of a bias dc field, E. Inset shows the frequency dependence of the real part of a dielectric constant, ɛ’.
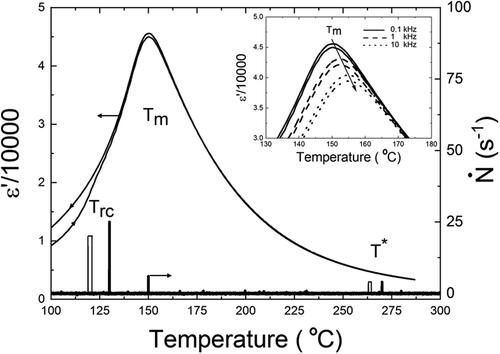
AE points out the Trc ≈ 120 °C during FC and ≈ 130 °C during FH, Tm ≈ 150 °C, i.e. AE does clearly distinguishes both these temperatures, as well as the T* ≈ 264 °C during FC and ≈ 270 °C during FH. The temperature hysteresis of Trc is known to be intrinsic for a 1st order phase transition. The temperature hysteresis of T* is earlier observed in Pb0.78Ba0.22Sc0.5Ta0.5O3 crystals and is explained by taking place of a 1st order local phase transition inside PNRs [Citation34]. All these temperatures of both Trc and Tm are in reasonably accordance with the ones determined in the [011]-oriented crystals with close compositions [Citation21, Citation22], though the some non-coincidence of these temperatures might be explained due to small variation of the compositions of the crystals.
AE of T* ≈ 270 and 264 °C points out a temperature range where the FWHM of the LA mode starts to increase steeply below approximately 320 °C upon cooling [Citation19, Citation21]. Such the increase of the FWHM curve was earlier proved to correspond to T* in some well-known RFEs [Citation35–37], but the AE provides a more precise value of T* due to its sharp bursts in comparison with a smooth change of a FWHM curve. True, recently the 320 °C is ascribed to be the TB, below which the relaxation time rapidly increases [Citation19]. Again the TB is known to be determined by a deviation of the Brillouin frequency shift from a straight line upon cooling in both [001]- and [011]-oriented 0.26PIN-0.46PMN-0.28PT crystals [Citation27], and such a rule was proved for [001]-oriented PMN-xPT crystals [Citation38]. So we believe that the TB is really equal to be of about 590 °C [Citation27].
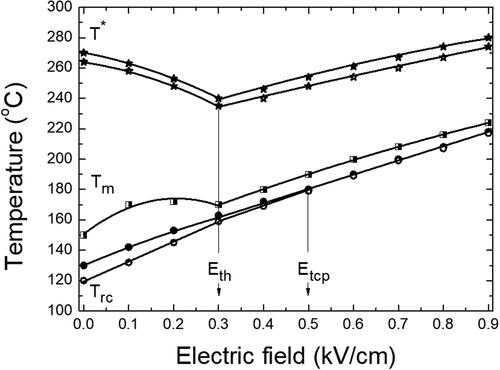
presents the dependence of all the Trc, Tm and T* on a bias electric field E. Both T* and Tm exhibit the clearly seen a V-shape form, characteristic for PMN-xPT crystals [Citation7–9]. Initially the Tm slightly increases in the vicinity of E ≈ 0.15 kV/cm, then decreases. It attains the turning point of Tm at Eth ≈ 0.3 kV/cm and then increases again in accordance with theoretical model [Citation7], as E enhances. The V-shape of Tm is similar that observed in [111]-oriented 0.23PIN-0.52PMN-0.25PT crystals [Citation26], (). Trc exhibits no V-shape and its thermal hysteresis reduces gradually up to Eth, but do not vanishes, as it is shown in [Citation15], and continues up to E ≈ 0.5 kV/cm, above which it vanishes and the Trc(E) dependence is a single line. A hysteresis vanishing point is known to occur at TCP, where a 1st order phase transition line meets a 2nd order phase transition line, and, consequently, ETCP ≈ 0.5 kV/cm. This data resembles that observed in [110]-oriented pure PMN crystals in Fig. 7(b) [Citation13]: a thermal hysteresis steep reduces at Eth ≈ 5 kV/cm (do not marked there), corresponding to a turning point of Tm, but a TCP is not attained. Surprisingly that the T* thermal hysteresis do not vanishes and remains approximately constant of about 6 °C, despite of presumably taking place a 1st order phase transition inside PNRs [Citation34].
Figure 3. The plot of all dependences of the intermediate temperature, T*, the maximum temperature, Tm, of the real part of a dielectric constant, ɛ’, the rhombohedral-cubic phase transition temperature, Trc, in dependence on a bias dc field, E.
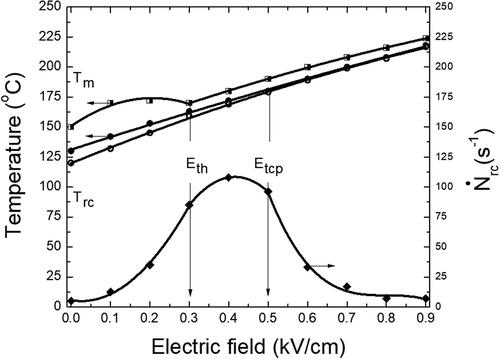
presents the behavior of during FH regime, accompanying the Trc, in dependence on a bias electric field E. Both
and
are essentially weaker in comparing with
because the former is caused by PNRs interaction, whereas the latter is caused by a structural phase transition. By this reason, there is no possibility to plot both
(E) and
(E) dependencies truthfully enough.
exhibits a smeared maximum toward the Etcp and then steeply decreases, pointing out the Eth in vicinity of turning point of Tm in good agreement with that detected in PMN-0.33PT crystals [Citation9]. This pronounced peak of
means a large strain, which in turn proportional the piezoelectric modulus maximum in the vicinity of a turning point of Tm, measured in both [111]- and [100]-oriented PMN-xPT crystals [Citation10, Citation14]. When E exceeds ETCP, the
gradually weakens, as E enhances, due to minimization of strain when occurring a 2nd order phase transition.
Figure 4. The plot of all dependences of the maximum temperature, Tm, of the real part of a dielectric constant, ɛ’, the rhombohedral-cubic phase transition temperature, Trc, as well as the AE count rate in dependence on a bias dc field, E.
The similar relationship between Tm(E) and (E) dependencies has recently been observed in [100]-oriented PMN-0.30PT crystals [Citation39]. It is clearly seen that the
(E) dependence in is similar to
(E) in [Citation39] for the monoclinic-tetragonal, Tmt, phase transition.
In Ref. [Citation39] the behavior of (E) is found to be similar to the pyroelectric coefficient γm(E) dependence in [100]-oriented PMN-xPT crystals in [Citation15]. γm exhibits a maximum in the vicinity of a turning point of Tm and then steeply weakens, presumably manifesting a beginning a so-called Widom line (the continuation of the 1st order phase transition line above the CEP) [Citation11]. On the other hand, the γm(E) dependence in [Citation15] is similar to that obtained in [001]-oriented pure BaTiO3 crystals in Fig. 8 [Citation40]. γm exhibits a maximum, too, and then steeply weakens toward the TCP, where a 1st order phase transition line meets a 2nd order phase transition one, as E enhances, i.e. the γm(E) becomes to maximum in the absence of any monoclinic phase when the Ttc closing to TCP. Based on similarity of
(E), d33(E) and γm(E) dependencies, it is concluded that there is TCP instead of CEP in [100]-oriented PMN-xPT crystals [Citation15, Citation16], and, consequently, no CEP observed in [100]-oriented PMN-0.30PT crystals.
By an analogy due to similarity of both (E) [Citation39] and
(E) in , we concluded that no CEP but TCP exists in [011]-oriented 0.26PIN-0.46PMN-0.28PT crystals as well as in [100]-oriented PMN-xPT ones, and, consequently, no supercritical behavior observed in these crystals, but observed in [111]-oriented ones only.
Meanwhile, the mechanism of a d33 maximum in [111]-oriented PMN-0.295PT crystals [Citation10] in a vicinity of CEP seems to be confuse. Indeed, x = 0.295 lies below the morphotropic phase boundary of about 0.30 ÷ 0.35 for PMN-xPT system [Citation41]. By this reason there is no enough amount of a monoclinic phase to provide the polarization rotations when applied the dc field E to decrease an energy of the crystals so strong, as it is explained in Ref. [Citation10]. From this point of view, we believe that the d33 maximum occurs when a 1st order Ttc closing to the CEP and then steeply weakens when it crossing the CEP and meets the Widom line within the supercritical state, as E enhances.
4. Conclusions
We have studied the unpoled [011]-oriented 0.26PIN-0.46PMN-0.28PT relaxor ferroelectric crystals by means of acoustic emission and dielectric measurements. We have detected the Curie temperatures of the 1st order rhombohedral-cubic ferroelectric phase transition, the dielectric maximum temperature as well as the intermediate temperature and studied their dependences on a dc bias electric field. We have observed a V-shape form in a vicinity of the turning point of temperature of a dielectric maximum at the threshold field and a tricritical point lying at several higher field, as well. We have detected a smeared maximum of acoustic emission in a vicinity of the V-shape form closer to a tricritical point, meaning the maximum of piezoelectric modulus in it, what is important for applications. We have detected no critical end point and concluded that there is no supercritical behavior in these crystals.
Acknowledgments
One of authors (SK) is thankful to TRS technologies, Inc. for providing Pb(In1/2Nb1/2)O3-Pb(Mg1/3Nb2/3)O3-PbTiO3 crystal plates.
Additional information
Funding
References
- A. A. Bokov and Z.-G. Ye, Recent progress in relaxor ferroelectrics with perovskite structure, J. Mater. Sci. 41 (1), 31 (2006). DOI: 10.1007/s10853-005-5915-7.
- W. Kleemann, Random fields in relaxor ferroelectrics – a jubilee review, J. Adv. Dielect. 02 (02), 1241001 (2012). DOI: 10.1142/S2010135X12410019.
- B. P. Burton, E. Cockayne, and U. V. Waghmare, Correlations between nanoscale chemical and polar order in relaxor ferroelectrics and the lengthscale for polar nanoregions, Phys. Rev. B. 72 (6), 064113 (2005). DOI: 10.1103/PhysRevB.72.064113.
- J. Toulouse, The three characteristic temperatures of relaxor dynamics and their meaning, Ferroelectr. 369 (1), 203 (2008). DOI: 10.1080/08838150802378160.
- B. Dkhil et al., Intermediate temperature scale T* in lead-based relaxor systems, Phys. Rev. B. 80 (6), 064103 (2009). DOI: 10.1103/PhysRevB.80.064103.
- F. U. I. H. Naqvi et al., T* of relaxor ferroelectric (1-x)Pb(Zn1/3Nb2/3)O3-xPbTiO3 single crystals revisited using Brillouin spectroscopy, Phys. Status Solidi. A. 217 (12), 1900987 (2020). DOI: 10.1002/pssa.201900987.
- I. P. Raevski et al., Bias-field effect on the temperature anomalies of dielectric permittivity in PbMg1/3Nb2/3O3-PbTiO3 single crystals, Phys. Rev. B. 72 (18), 184104 (2005). DOI: 10.1103/PhysRevB.72.184104.
- D. Viehland et al., Local polar configurations in lead magnesium niobate relaxors, J. Appl. Phys. 69 (1), 414 (1991). DOI: 10.1063/1.347732.
- E. Dul’kin et al., Nature of thermally stimulated acoustic emission from PbMg1/3Nb2/3O3-PbTiO3 solid solutions, Appl. Phys. Lett. 94 (25), 252904 (2009). DOI: 10.1063/1.3160552.
- Z. Kutnjak, J. Petzelt, and R. Blinc, The giant electromechanical response in ferroelectric relaxors as a critical phenomenon, Nature. 441 (7096), 956 (2006). DOI: 10.1038/nature04854.
- Z. Kutnjak, R. Blinc, and Y. Ishibashi, Electric field induced critical points and polarization rotations in relaxor ferroelectrics, Phys. Rev. B. 76 (10), 104102 (2007). DOI: 10.1103/PhysRevB.76.104102.
- E. V. Colla et al., Properties of the field-induced ferroelectric phase in single-crystal lead magnoniobate, Sov, Phys. Solid. State. 38, 1202 (1996).
- X. Zhao et al., Electric field-induced phase transitions in (111)-, (110)-, and (100)-oriented Pb(Mg1/3Nb2/3)O3 single crystals, Phys. Rev. B. 75 (10), 104106 (2007). DOI: 10.1103/PhysRevB.75.104106.
- S. I. Raevskaya et al., Quasivertical line in the phase diagram of single crystals of PbMg1/3Nb2/3O3-xPbTiO3 (x = 0.00, 0.06, 0.13, and 0.24) with a giant piezoelectric effect, Phys. Rev. B. 76 (6), 060101(R (2007). DOI: 10.1103/PhysRevB.76.060101.
- S. I. Raevskaya et al., Critical nature of the giant field-induced pyroelectric response in Pb(Mg1/3Nb2/3)O3-x PbTiO3 single crystals, Appl. Phys. Lett. 93 (4), 042903 (2008). DOI: 10.1063/1.2966147.
- V. S. Boyko, R. I. Garber, and A. M. Kossevich, Reversible Crystal Plasticity, (Springer, New York, 1994).
- K. Prabakar and S. P. M. Rao, Acoustic emission during phase transition in soft PZT ceramics under an applied electric field, Ferroelectr. Lett. 32 (5–6), 99 (2005). DOI: 10.1080/07315170500416579.
- E. Dul’kin et al., Acoustic emission study of domain wall motion and phase transition in (1-x-y)Bi0.5Na0.5TiO3-xBaTiO3-yK0.5Na0.5NbO3 lead-free piezoceramics, Scr. Mater. 60 (4), 251 (2009). DOI: 10.1016/j.scriptamat.2008.10.014.
- T. H. Kim, S. Kojima, and J. H. Ko, Phase transition behaviors in relaxor ferroelectric [001]-poled Pb(In1/2Nb1/2)O3-Pb(Mg1/3Nb2/3)O3-PbTiO3 single crystals studied by Brillouin light scattering and dielectric spectroscopies, J. Appl. Phys. 111 (5), 054103 (2012). DOI: 10.1063/1.3692596.
- S. Tsukada et al., Relation between fractal inhomogeneity and In/Nb-arrangement in Pb(In1/2Nb1/2)O3, Sci. Rep. 7 (1), 17508 (2017). DOI: 10.1038/s41598-017-17349-3.
- T. H. Kim, J. H. Ko, and S. Kojima, Phase transition behaviors in [011]-oriented Pb(In1/2Nb1/2)O3-Pb(Mg1/3Nb2/3)O3-PbTiO3 single crystals studied by dielectric and micro-Brillouin spectroscopies, Jpn. J. Appl. Phys. 52 (9S1), 09KC01 (2013). DOI: 10.7567/JJAP.52.09KC01.
- Y. Wan et al., Variations of composition and dielectric properties of Pb(In1/2Nb1/2)O3-Pb(Mg1/3Nb2/3)O3-PbTiO3 single crystal along growth direction, J. Appl. Phys. 113 (12), 124105 (2013). DOI: 10.1063/1.4798287.
- Q. Li et al., Structural transitions in [001]/[111]-oriented 0.26Pb(In1/2Nb1/2)O3-0.46Pb(Mg1/3Nb2/3)O3-0.28PbTiO3 single crystals probed via neutron diffraction and electrical characterization, J. Appl. Phys. 113 (15), 154104 (2013). DOI: 10.1063/1.4802669.
- S. Zhang et al., Characterization of Pb(In1/2Nb1/2)O3-Pb(Mg1/3Nb2/3)O3–PbTiO3 ferroelectric crystal with enhanced phase transition temperatures, J. Appl. Phys. 104 (6), 64106 (2008). DOI: 10.1063/1.2978333.
- Y. Chen et al., Temperature and electric field dependence of the dielectric property and domain evolution in [001]-oriented 0.34Pb(In1/2Nb1/2)O3–0.25Pb(Mg1/3Nb2/3)O3–0.41PbTiO3 single crystal, J. Appl. Phys. 109 (1), 014111 (2011). DOI: 10.1063/1.3525163.
- Y. Wan et al., Dielectric behavior and phase transition in [111]-oriented PIN–PMN–PT single crystals under DC bias, J. Adv. Dielect. 04 (01), 1450004 (2014). DOI: 10.1142/S2010135X14500040.
- T. H. Kim, Inelastic Light Scattering Spectroscopy of Lead-Based Ferroelectrics, Dissertation, University of Tsukuba, 2014.
- E. Dul’kin, I. P. Raevskii, and S. M. Emel’yanov, Acoustic emission and thermal expansion of Pb(Mg1/3Nb2/3)O3 and Pb(Mg1/3Nb2/3)O3-PbTiO3 crystals, Phys. Solid State. 45 (1), 158 (2003). DOI: 10.1134/1.1537428.
- E. Dul’kin et al., Acoustic emission and nonergodic states of the electric-field-induced-phase transition of PbMg1/3Nb2/3O3, J. Appl. Phys. 98 (2), 023520 (2005). DOI: 10.1063/1.1980527.
- E. Dul’kin et al., Acoustic emission study of phase transitions and polar nanoregions in relaxor-based systems: Application to the PbZn1/3Nb2/3O3 family of single crystals, Phys. Rev. B. 73 (1), 012102 (2006). DOI: 10.1103/PhysRevB.73.012102.
- E Dul’kin et al., Acoustic emission and dielectric studies of phase transitions within the morphotropic phase boundary of xPb(Zr1/2Ti1/2)O3, (1-x)Pb(Ni1/3Nb2/3)O3 relaxor ferroelectrics, Appl. Phys. Lett. 95, 252903 (2009).
- J. Tian et al., Improved stability for piezoelectric crystals grown in the lead indium niobate–lead magnesium niobate-lead titanate system, Appl. Phys. Lett. 91 (22), 222903 (2007). DOI: 10.1063/1.2817743.
- E. Sun et al., Relaxation behavior in 0.24Pb(In1/2Nb1/2)O3–0.49Pb(Mg1/3Nb2/3)O3-0.27PbTiO3 ferroelectric single crystal, Ceram. Int. 42 (4), 4893 (2016). DOI: 10.1016/j.ceramint.2015.12.004.
- E. Dul’kin et al., Evidence of local anisotropic strains in relaxor ferroelectrics below intermediate temperature T* detected by acoustic emission, J. Phys.: Condens. Matter. 22 (22), 222201 (2010). DOI: 10.1088/0953-8984/22/22/222201.
- V. Sivasubramanian and S. Kojima, Brillouin scattering studies of acoustic phonon modes and central peak in single-crystal Pb(Sc1/2Ta1/2)O3, Phys. Rev. B. 85 (5), 054104 (2012). DOI: 10.1103/PhysRevB.85.054104.
- M. M. Rahaman et al., Electric field effects on polar-nanoregions in Li-doped KTa1-xNbxO3 single crystals probed by micro-Brillouin scattering, Integr. Ferroelectr. 185 (1), 22 (2017). DOI: 10.1080/10584587.2017.1370282.
- M. Aftabuzzaman et al., Electric field and aging effects of uniaxial ferroelectrics SrxBa1−xNb2O6 probed by Brillouin scattering, Sci. Rep. 7 (1), 11615 (2017). DOI: 10.1038/s41598-017-10985-9.
- J. H. Ko et al., Crossover in the mechanism of ferroelectric phase transition of Pb[(Mg1/3Nb2/3)1−xTix]O3 single crystals studied by Brillouin light scattering, Phys. Rev. B. 82 (10), 104110 (2010). DOI: 10.1103/PhysRevB.82.104110.
- E. Dul’kin, A. Kania, and M. Roth, On the question of the critical end point in the (1-x)PbMg1/3Nb2/3O3-xPbTiO3 relaxor ferroelectric single crystals based on acoustic emission data studies, EPL. 133 (6), 67001 (2021). DOI: 10.1209/0295-5075/133/67001.
- A. G. Chynoweth, Dynamic method for measuring the pyroelectric effect with special reference to barium titanate, J. Appl. Phys. 27 (1), 78 (1956). DOI: 10.1063/1.1722201.
- Y. Guo et al., The phase transition sequence and the location of the morphotropic phase boundary region in (1-x)[Pb(Mg1/3Nb2/3)O3]–xPbTiO3 single crystal, J. Phys.: Condens. Matter. 15 (2), L77 (2003). DOI: 10.1088/0953-8984/15/2/110.