
 ?Mathematical formulae have been encoded as MathML and are displayed in this HTML version using MathJax in order to improve their display. Uncheck the box to turn MathJax off. This feature requires Javascript. Click on a formula to zoom.
Abstract
Crowding is a major concern for investors in alternative risk premia. By focusing on the distinct mechanics of various systematic strategies, this study introduces a framework that provides insights into the implications of crowding for subsequent strategy performance. Understanding such implications is key for strategy design, portfolio construction, and performance assessment. The analysis shows that divergence premia, such as momentum, are more likely to underperform following crowded periods. Conversely, convergence premia, such as value, show signs of outperformance as they transition into phases of larger investor flows.
Editor’s Note
Submitted 19 September 2018
Accepted 20 March 2019 by Stephen J. Brown
Disclosure: The opinions and statements expressed in this paper are those of the author and may be different to views or opinions otherwise held or expressed by or within Goldman Sachs. The content of this paper is for information purposes only and is not investment advice or advice of any other kind. None of the author, Goldman Sachs, or its affiliates, officers, employees, or representatives accepts any liability whatsoever in connection with any of the content of this paper or for any action or inaction of any person taken in reliance upon such content or any part thereof. An earlier version of this paper was previously published by Goldman Sachs under the title “The Impact of Crowding in Systematic ARP Investing” (7 June 2018).
This article was externally reviewed using our double-blind peer-review process. When the article was accepted for publication, the author thanked the reviewers in his acknowledgments. Robert Faff was one of the reviewers for this article.
In a recent MJ Hudgon Allenbridge survey, crowding risk was listed as one of the most important impediments to investing in alternative risk premia (ARP) for the clients of asset managers and sell-side banks that are active in the ARP space.Footnote1 These responses echo the numerous media articles and information memos by various financial institutions in recent years debating whether the rapidly growing ARP space is crowded. Giamouridis (2017), in his recent editorial in the Financial Analysts Journal, called for further research on this topic—in particular, on “what makes a sensible ex ante measure of crowding” and on “how such measures are associated with the performance of factor portfolios and under what market conditions” (p. 1).
This study contributes to the industry debate by exploring the mechanics of the various alternative risk premia in the event of investor flows and by studying the effect of crowdedness on subsequent performance. The results of this analysis may have significant implications for ARP providers and investors in terms of strategy design, performance and risk assessment, portfolio construction, and, ultimately, dynamic factor allocation.
The term “crowding” is associated with a number of notions related to ARP investing. It may relate to estimates of the overall size of the ARP industry and, therefore, the consequences of a broad unwinding, such as the “quant meltdown” of August 2007 (Khandani and Lo 2007, 2011). It can be related to market impact and thus strategy capacity (Frazzini, Israel, and Moskowitz 2012; Novy-Marx and Velikov 2016; Ratcliffe, Miranda, and Ang 2017). The notion of crowding on which I focus relates to the response of systematic premia, at the strategy level, following periods identified as crowded.
I specifically drew inspiration from Stein’s (2009) presidential address at the American Finance Association, in which he commented,
Complications arise when, in the process of pursuing a given trading strategy, arbitrageurs inflict negative externalities on one another. . . . The first [complication] might be termed a “crowded-trade” effect. [An arbitrageur] cannot know in real time exactly how many others are pursuing the same model and taking the same position as him. This . . . creates a coordination problem and . . . in some cases can result in prices being pushed further away from fundamentals. (p. 1518)
The cornerstone of my methodology is the classification of the ARP strategies into divergence and convergence premia. Divergence premia, such as momentum, lack a fundamental anchor and inherently embed a self-reinforcing mechanism (e.g., in momentum, buying outperforming assets and selling underperforming ones). This lack of a fundamental anchor creates the coordination problem that Stein (2009) described, which can ultimately have a destabilizing effect. Conversely, convergence premia, such as value, embed a natural anchor (e.g., the valuation spread between undervalued and overvalued assets) that acts as a self-correction mechanism (as undervalued assets become no longer undervalued when overbought). Such dynamics suggest that investor flows are actually likely to have a stabilizing effect for convergence premia.
To test these hypotheses, I used the pairwise correlation of factor-adjusted returns of assets in the same peer group (outperforming assets, undervalued assets, and so on) as a metric for crowding. This metric was motivated by the recent work of Cahan and Luo (2013); Lou and Polk (2014); and Huang, Lou, and Polk (2018). I provide empirical evidence in line with these hypotheses.
This article drew inspiration from the literature on a number of relevant topics: momentum crashes and their relationship with crowded trades (Lou and Polk 2014; Chabot, Ghysels, and Jagannathan 2014; Barroso and Santa-Clara 2015; Daniel and Moskowitz 2016), volatility targeting of equity factors (Moreira and Muir 2017; Barroso and Maio 2018), and factor timing based on factor valuation (Arnott, Beck, and Kalesnik 2016a, 2016b; Asness 2016; Asness, Chandra, Ilmanen, and Israel 2017). The papers closest to my analysis are Stein (2009), Lou and Polk (2014), and Huang et al. (2018).
Framework and Hypotheses
Factor premia are classified in the literature, based on their respective economic drivers, into risk-based premia and price anomalies. For the purposes of my study, I used a different classification, one inspired by strategy mechanics at times when the strategies experience—all else being equal—large inflows of capital. I introduce here the concepts of divergence and convergence premia.
Divergence Premia.
Divergence premia function like positive-feedback loops as investor activity inflates the trading signal. For example, in cross-sectional momentum investing, an investor takes a long position in recent outperforming assets and a short position in recent underperforming assets. illustrates the mechanics of this strategy following large capital inflows.
aWinners are not formulaically more expensive than losers, even though they have generally been so historically.
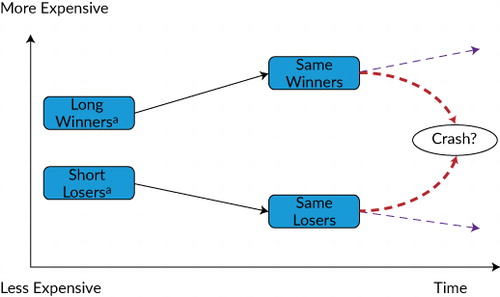
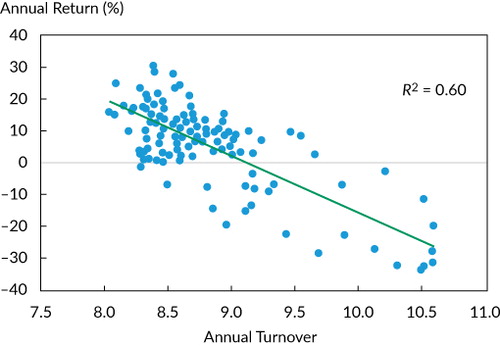
All else being equal, significant flows into a momentum strategy result in short-term outperformance. Therefore, the first-order impact of crowding is positive from a profitability standpoint. Such outperformance renders the recent winners stronger and, symmetrically, renders the recent losers worse off. Put differently, when momentum, driven mechanically by net inflows, performs strongly, its turnover is likely to fall as investors remain invested in the same assets (or, symmetrically, keep shorting the same assets). validates this point empirically by illustrating the strong negative correlation in the period of December 2005 through April 2018 between, on the one hand, the cumulative one-year turnover of a quarterly rebalanced equity momentum strategy (winner decile minus loser decile) in a global equity universe and, on the other hand, the contemporaneous one-year return of the strategy.Footnote2 This relationship effectively reflects the positive-feedback loop that is described by Stein (2009) and Lou and Polk (2014).
Notes: This figure shows annual turnover of an equity momentum strategy (top versus bottom decile) and its rolling one-year performance. The strategy is a combination of three quarterly rebalanced strategies that rebalanced in different months of a quarter. The universe is a global developed market equity universe.
This bubble-like behavior becomes economically impossible to be sustained in the long term.Footnote3 Investors that allocate on the basis of divergence strategies may have difficulty knowing when to stop because of the lack of an economic anchor.Footnote4
Therefore, I hypothesized that investor crowding is likely to have a destabilizing effect for divergence premia as crowding can drive prices away from fundamentals. This pattern, in turn, increases the likelihood of an adverse factor correction. I provide the tests of this hypothesis in the empirical part of the article. The negative relationship between funding liquidity and momentum strategies (because of which such strategies tend to underperform when funding liquidity becomes scarce) is in line with this conjecture (Asness, Moskowitz, and Pedersen 2013).
Convergence Premia.
In contrast to divergence premia, convergence premia naturally embed a self-correction mechanism and function like negative-feedback loops. For example, in cross-sectional value investing, buying undervalued (selling overvalued) assets results in relative price appreciation (depreciation) and, therefore, in valuation spread convergence.Footnote5 illustrates this dynamic.
Note: τ denotes the time to convergence of the valuation spread and is a function of investor flows.
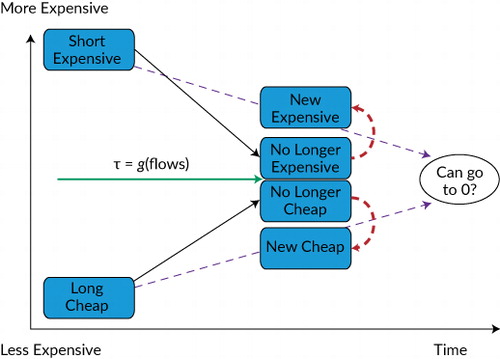
All else being equal, significant flows into a value strategy mechanically result in short-term outperformance as the valuation spread shrinks and, at the margin, can (theoretically) completely vanish. Contrary to the divergence premia pattern, however, investors allocating to convergence premia have a natural anchor that signals the end of a profitable opportunity. At that stage, a value investor would turn the portfolio over completely to allocate to any new value opportunities. Large investor flows in convergence premia can bring faster convergence of valuation spreads (i.e., opportunities go away faster; the time to convergence of the valuation spread, τ, as shown in , should be inversely related to flows) and hint at the necessity of a more responsive portfolio turnover mechanism.
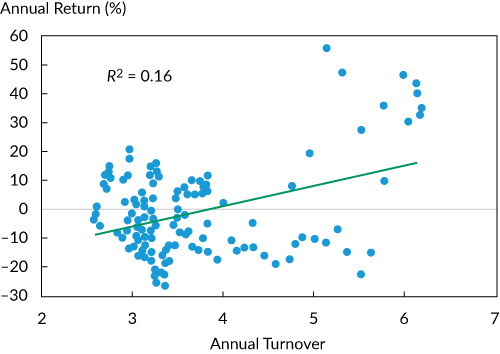
validates this point by illustrating the positive relationship between turnover and performance for a quarterly rebalanced value strategy in which the book-to-price ratio is the value metric. The relationship is not as strong as in the case of momentum shown in Figure 2 because a value portfolio rebalances if either prices or book values change cross-sectionally (see Ilmanen, Nielsen, and Chandra 2015 for a relevant discussion).
Notes: This figure shows the annual turnover of an equity value strategy (cheap versus expensive decile) and its rolling one-year performance. The strategy is a combination of three quarterly rebalance strategies that rebalanced in different months of a quarter. The universe is a global developed market equity universe.
Therefore, I hypothesized that anchored strategies are more resilient to incoming flows than are unanchored strategies. Such inflows should have a stabilizing effect as prices converge rapidly toward fundamentals (all else being equal). Focusing on the long term, an argument could be made that excessive investor crowding, all else being equal, progressively squeezes valuation spreads—to the point that all valuation levels in the cross-section collapse onto the same level. This argument is equivalent to arguing that the value premium can vanish as a result of overcrowding.
Whether the value premium (or any premium) can completely vanish as a result of excessive crowding is probably more of a focus of equilibrium asset pricing and is beyond the scope of my analysis. Having said that, I note that more systematic flows might be necessary but not sufficient to wipe out systematic premia. When value outperforms, it eventually transitions into a momentum cycle because the undervalued assets that outperform become more likely to turn up on the screens of momentum investors as winning assets. These investors may subsequently take the lead and potentially drive prices away from fundamentals, and so the cycle continues. This dynamic transition between convergence and divergence strategies is the reason Stein (2009) argued that
while a larger number of sophisticated arbitrageurs certainly makes life more competitive and less profitable for the arbitrageurs themselves, it need not make the world a better place for those who look to asset prices to provide a reliable reflection of underlying fundamental values. (p. 1518)Footnote6
Methodology
This section first provides an overview of the cross-asset dataset and of the specifications for strategy construction. Subsequently, I present in detail the steps toward estimating the measure of crowdedness used in my empirical analysis.
Data and Strategy Construction.
The academic literature on the topic of crowding has so far mainly focused on equity universes (Cahan and Luo 2013; Lou and Polk 2014; Huang et al. 2018). In an attempt to establish pervasiveness and robustness for my findings, I expanded the focus to various asset classes and risk premia strategies. contains the details for the asset universes and the strategy specifications. I briefly discuss here the main details.
Table 1. Overview of Asset Class Data and Strategies
For the purposes of my analysis, I used (1) a global tradable and liquid developed market equity universe (for the period September 2004 through May 2018), (2) the 24 constituents of the S&P GSCI (January 1999 through May 2018), and (3) 26 developed and emerging market currency pairs against the US dollar (January 2000 through May 2018). The data were collected from Worldscope and Axioma for the equity universe and from Bloomberg for the commodity and currency universes.
I conducted the analysis for a broad range of stylized cross-sectional risk premia strategies. I specifically focused on (1) within equities, the following strategies: value (as defined by the book-to-price ratio), size (market cap), momentum (residual of cross-sectional regression of past 12-month return, excluding the most recent month, against stock volatility), quality (return on assets), and low beta (beta to the MSCI World Index); (2) within commodities, momentum (12-month return) strategies; and (3) within currencies, value (purchasing power parity) and momentum (12-month return) strategies.
Each strategy was constructed on a cash-neutral basis by taking a long position in an equally weighted portfolio of top-ranked assets and a short position in an equally weighted portfolio of bottom-ranked assets. For the equity strategies, I used top and bottom deciles; for the smaller commodity and currency universes, I used top and bottom thirds, which effectively amounted to taking a long position in the top eight assets and a short position in the bottom eight assets.
Measuring Crowdedness.
The role of financial markets is to balance the supply and demand for assets. Naturally, as the market clears, there is a seller for every buyer. Measuring crowdedness is thus equivalent to identifying groups of investors who share common investment objectives and allocate to (or deallocate from) assets with a common characteristic (e.g., high-momentum assets). The larger these groups of investors are (and, equivalently, the larger the synchronous inflows into the top-ranked assets and outflows from the bottom-ranked assets), the larger the implied level of crowding in the respective premium.
Investor crowdedness can thus be proxied in various ways. To estimate the level of crowdedness, one can use either the inputs to the financial market system, such as flow data or positioning data (e.g., regulatory filings), or the outputs of the system, such as asset comovement or, potentially, valuation spreads. Flows and positioning data have a number of limitations in terms of depth, timeliness of availability, and historical and asset class coverage. For these reasons, I chose to use price-based crowdedness metrics.
The principal idea for the crowdedness metric that I used is that synchronous flows into a portfolio of assets (from a large group of investors with similar investment objectives) should, all else being equal, increase the comovement of these assets, above and beyond what is implied by the overall market (beta) and potentially other factors that cross-sectionally drive asset returns.
Cahan and Luo (2013) were the first to use pairwise correlations of a group of US stocks that shared a common characteristic (e.g., top momentum stocks) as a proxy for crowdedness. They also used security-lending data to form the difference in utilization between high-scoring and low-scoring baskets of stocks; the larger the utilization of the unattractive basket of stocks, the more crowded the factor was considered to be. They found that the metrics (the correlation-based metric and the utilization-based metric) exhibited similar results in terms of identifying crowded periods.
Lou and Polk (2014) and Huang et al. (2018) used pairwise correlations to proxy for crowdedness within the US equity momentum and low-beta portfolios and found that such crowdedness metrics were statistically strongly forecasted by past institutional ownership of the long baskets of these portfolios, by past assets under management of long–short equity hedge funds, and by past strategy performance (which they claimed can indicate performance chasing). This empirical evidence provides support for the use of pairwise excess correlations as a well-accepted measure of crowdedness.
The estimation framework that I used for each strategy is as follows:
For each week t, I identified the top scoring and bottom scoring assets of the factor of interest—for example, the top and bottom momentum stocks. | |||||
For each asset i of the top and bottom baskets, I estimated the
factor-adjusted residual returns,
εi,t, by
regressing the past Δ = 52 weekly returns (5 × 52 weekly returns for value
strategiesFootnote7) on an asset
class–specific factor model that excluded the factor of interest: indicates the asset class–specific factor model used for each universe. For example, the factor model for the equity strategies was a four-factor model containing the market (as proxied by the MSCI World Index), size, value, and momentum factors.Footnote8 | |||||
| • | The last step was to estimate the signed average pairwise correlation of all residual
returns of the assets in the top and bottom baskets: where si,t = +1 if asset i belonged to the top basket and –1 if it belonged to the bottom basket. This step was intended to allow the construction of a joint measure of asset excess comovement that combined the information from both the top and bottom factor baskets. After all, a long–short premium can become crowded if excess buying demand occurs for the long basket or excess selling pressure occurs for the short basket, or both.Footnote9 | ||||
I ended up with a weekly time series of a comovement indicator for each factor premium in each of the asset classes. This CoMetric time series was used to identify the most and least crowded periods and thus explore the impact of crowding on subsequent strategy performance. Following Lou and Polk (2014), I classified weeks identified as the top 20% of the CoMetric as most crowded and weeks identified as the bottom 20% as least crowded.Footnote10
presents an example of the CoMetric estimation for the equity momentum and equity value premia. Top and bottom deciles of both premia were determined on a weekly basis, and the average levels of asset excess comovement were estimated as just described.Footnote11
Notes: The figure presents the average pairwise excess correlation for the winners and losers (Panel A) and for the cheap and expensive stocks (Panel B) of a global equities universe. The estimation is weekly, and the past 52 weekly returns (or 5 × 52 weekly returns for value) of each stock were used for the estimation. The returns of the assets in the momentum (value) baskets are factor adjusted for the market, size, and value (momentum) factors. The sample period is September 2004 (first estimates become available 52 or 5 × 52 weeks later, accordingly) to May 2018.
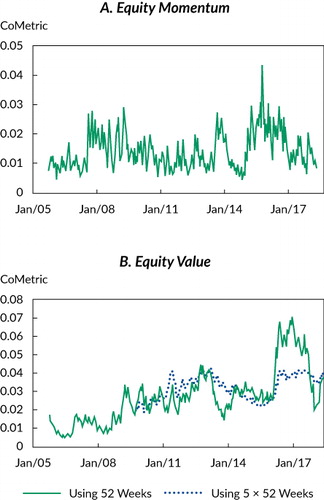
A few important observations should be discussed. In theory, regression residuals like those used in the estimation of the CoMetric should be cross-sectionally uncorrelated, and the time series of the CoMetric should be statistically indistinguishable from zero. The evidence suggests otherwise, however, in these results. Stocks in the top and bottom momentum and value baskets exhibit time-varying yet statistically strong cross-dependence, which can be interpreted as excess demand for these baskets and, therefore, a reflection of crowding dynamics.Footnote12
The CoMetric is clearly not constant over time, but more importantly, it does not necessarily increase over time. Contrary to a passive allocation in a market cap–weighted index, ARP strategies allocate dynamically across different assets and the portfolios are turned over on a regular basis. Thus, whatever asset ranks today as a top one, based on some factor characteristic, is not necessarily the top-ranked asset the day before or the day after. This difference between passive index investing and systematic ARP investing renders the notion and impact of crowding fundamentally different between the two.
Another characteristic of the CoMetric is that it can be quite persistent. There are periods of higher levels of asset excess comovement and periods of lower levels of asset excess comovement. Therefore, I empirically tested whether the level of asset excess comovement has significant implications for the subsequent return profile of the various ARP strategies.
Empirical Analysis
In this section, I discuss the analysis and findings for divergence premia first and then the analysis and findings for convergence premia.
Divergence Premia.
For the divergence premia—in particular, equity cross-sectional momentum— contrasts the average performance of a buy-and-hold cross-sectional momentum strategy (winners decile minus losers decile) over a period of two years following the most crowded periods with the performance following the least crowded periods.Footnote13 With the average performance, I present 95% confidence interval bands estimated by using Newey–West (1987) robust standard errors. Additionally, the top rows of report the average holding-period returns of the strategy for the first month, the first six months, the first year, and the second year following high and low levels of asset excess comovement and the differential return between these two regimes (H – L). Statistical significance is assessed using Newey–West t-statistics.
Notes: This figure shows average buy-and-hold performance of a long–short equity momentum portfolio (top minus bottom equally weighted deciles) over a two-year period following the most crowded periods or the least crowded periods. Crowdedness was measured on a weekly basis. The figure contains 95% confidence interval bands estimated using Newey–West (1987) standard errors. The sample period for determining the most and least crowded periods is October 2005–May 2018.
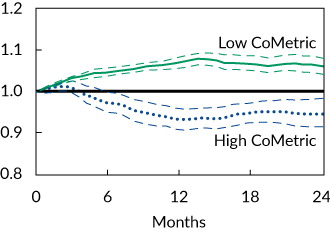
Table 2. Performance of Divergence Premia Conditional on the Level of Asset Excess Comovement
Conditioning the performance of the equity momentum strategy on the prior level of crowdedness results in statistically different results. Even if a momentum strategy initially benefits from its self-reinforcing mechanism independent of the earlier crowdedness state (i.e., as per , the strategy delivers positive returns over the first month following both crowded and noncrowded periods, with the difference being statistically insignificant), when such herding reaches extreme levels, the strategy is likely to suffer a drawdown. In line with my hypothesis, the strategy underperforms following high levels of crowding and strongly outperforms following low levels of crowding over the first six months to a year; respectively, t-statistics (unreported in ) of the H – L spread are −5.30 and −9.12. These findings echo those of Lou and Polk (2014) and Chabot et al. (2014).
extends this analysis to divergence premia in various asset classes. For each premium, I used the respective CoMetric indicator for the identification of high and low asset excess comovement regimes. In particular, I looked at momentum strategies in the currency and commodity markets, as well as equity low-beta and equity quality strategies.Footnote14 reports the relevant statistics.
Notes: This figure shows average buy-and-hold performance of various long–short divergence portfolios (see for specification details) over a two-year period following the most crowded periods or the least crowded periods. Crowdedness was measured on a weekly basis.
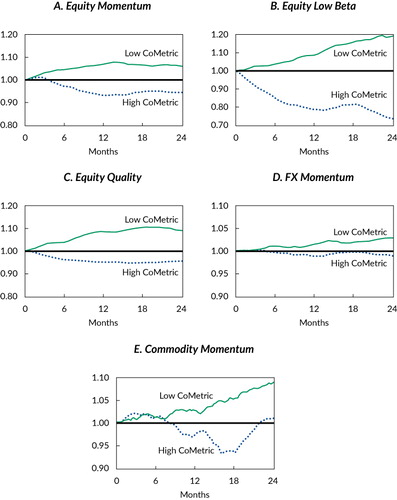
The findings for equity momentum are pervasive across all divergence premia that I studied. None of the premia exhibited statistically different patterns over the first month following a high or low crowdedness regime (all H – L spreads are statistically insignificant) because they were all probably experiencing the later phases of their self-reinforcing characteristic. Over a six-month to one-year horizon, however, all divergence premia, unequivocally, underperformed following high levels of asset excess comovement and outperformed following low levels of asset excess comovement. The t-statistics (unreported in ) of the H – L spread reach maximum levels around the one-year holding horizon for most of the premia. Indicatively, for the annual horizon, these t-statistics are −8.41 for equity low beta, −5.14 for equity quality, −3.07 for currency momentum, and −2.92 for commodity momentum; statistical significance at the 1% level is established across all premia. Overall, my results provide empirical support for the conjecture of Stein (2009) that nonanchored divergence strategies may cause a coordination problem for investors, who cannot know in real time how many other investors are invested. As a result, when such strategies become crowded, they are likely to underperform. Conversely, lower levels of asset excess comovement are more accommodative for outperformance. These results have important implications for anyone tempted to use CoMetric indicators to build a factor-timing model.
Convergence Premia.
The same analysis for convergence premia is shown in and . presents the performance of a buy-and-hold cross-sectional value strategy over a period of two years following the most crowded periods against the performance following the least crowded periods. The top rows of report relevant performance statistics.
Notes: This figure shows average buy-and-hold performance of a long–short equity value portfolio (top minus bottom equally weighted deciles) over a two-year period following the most crowded periods or the least crowded periods. Crowdedness was measured on a weekly basis. The figure contains 95% confidence interval bands estimated using Newey–West (1987) standard errors. The sample period for determining the most and least crowded periods is October 2009–May 2018.
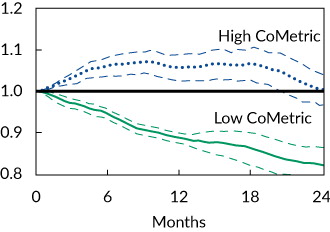
Table 3. Performance of Convergence Premia Conditional on the Level of Asset Excess Comovement
The behavior of the strategy is completely opposite to what was documented for divergence premia. Higher levels of asset excess comovement that are reflective of investor synchronous flows constitute a catalyst for future outperformance. Conversely, low levels of asset comovement are associated with poor future performance. The t-statistic (unreported in ) of the H – L spread is again maximized for the annual horizon and is equal to +11.78.
presents the conditional buy-and-hold performance for the extension of the analysis to other convergence premia—namely, FX value and equity size. The relevant performance statistics are reported in the bottom rows of . In line with my hypothesis and with the evidence for equity value, FX value also benefits from increased asset comovement. It delivered statistically positive holding returns that reached a maximum level around the annual horizon, with the t-statistic (unreported in ) of the H – L spread being +5.86.
Notes: This figure shows the average buy-and-hold performance of various long–short convergence portfolios (see for specification details) over a two-year period following the most crowded periods or the least crowded periods. Crowdedness was measured on a weekly basis.
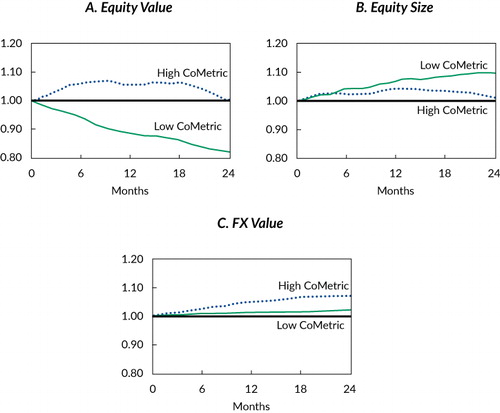
The only premium that appears to be an outlier in the group of ARP strategies I studied is equity size (small-cap stocks minus large-cap stocks). The prior level of asset excess comovement does not provide any relevant information for a size portfolio for the first six months. The portfolio delivered statistically strong returns of 2.19% following high levels of asset excess comovement and 4.76% following low levels of asset excess comovement. And the difference is statistically insignificant (t-statistic of −1.58, unreported in ). These positive returns continued for up to a year (3.55% and 7.67%, respectively, with the difference now becoming marginally statistically significant with a t-statistic of −2.12, unreported in ).
Several potential effects may contribute to the lack of a positive and statistically significant H – L spread for the equity size portfolio. My estimation of the size CoMetric could probably have an omitted factor that masks the commonality in the excess returns of the stocks in the small-cap and large-cap baskets. In addition, recent work by Alquist, Israel, and Moskowitz (2018) challenges the very existence of a size factor as a profitable premium. They provided empirical evidence showing that the size premium is not statistically significant across countries, across sample periods, and across different implementations.
Despite the potential misalignment of the size premium with my hypothesis, the value strategies within the equity and currency markets offer support that the impact of crowdedness has different implications for the profitability of the different ARP strategies, as their strategy mechanics would suggest.
Conclusions, Implications, and Future Work
The main objective of this study was to examine the market perception that investor crowding in ARP strategies has a negative impact on performance. Using two stylized models for the mechanics of ARP strategies—namely, divergence and convergence—I showed that different ARP strategies may respond differently to investor flows.
These findings do not mean that an event of sudden unwinding of cross-asset risk premia portfolios does not represent a considerable risk for an ARP investor. Such an event would clearly represent a risky possibility. The focus of the article is not, however, on the assessment of performance in the event of a sudden unwinding; the actual impact is merely mechanical. The focus was to assess the effect of inflows into ARP strategies (as opposed to orchestrated outflows) on subsequent strategy performance. The objective was to provide ARP investors with clarity on the dynamics of these premia as they navigate through market cycles and, ultimately, to provide them with the tools to best design and rebalance their portfolios.
The findings suggest that crowding is not always a catalyst for underperformance and should not be treated as such by investors. The results have direct implications for risk management and multifactor portfolio construction. Investors should consider how to risk-manage strategies with divergence dynamics, especially when those strategies experience net flows. Volatility targeting is a well-studied systematic way that has been shown to improve risk-adjusted returns of divergent strategies, such as momentum and betting against beta (Barroso and Santa-Clara 2015; Moreira and Muir 2017; Barroso and Maio 2018). In unreported results, I found that divergence premia exhibit higher volatility following crowded periods (in agreement with Lou and Polk 2014), which justifies the use of a volatility-targeting mechanism.
Conversely, applying volatility targeting to convergent strategies might not improve risk-adjusted returns. In unreported results, I found that convergent premia exhibit lower volatility following crowded periods. In their analysis of the impact of volatility targeting on equity factors, Moreira and Muir (2017) found that the Fama–French (1993) HML factor (high book-to-market value minus low book-to-market value) does not benefit statistically strongly from volatility targeting.
Put together, these findings have practical implications for practitioners who build multifactor portfolios. Popular risk-based schemes such as risk parity (also known as “equal risk contribution”) appear to be more suitable for portfolios of divergent strategies than for portfolios of convergent strategies. Future research should look at such dynamics.
A number of other questions naturally emerge from this analysis and could serve as topics for future research. The predictive ability of crowding indicators for future ARP performance makes them candidate signals for factor rotation/timing, which is a topic that has been heavily debated recently (Arnott et al. 2016a; Asness et al. 2017). To my knowledge, the only attempt to incorporate such crowding indicators into a systematic allocation framework is by Dichtl, Drobetz, Lohre, Rother, and Vosskamp (2018).
Another topic is the viability of factor premia in the presence of significant investor flows and whether more crowding in the ARP space degrades long-term expected returns. From an empirical standpoint, ARP viability also becomes almost synonymous with investigating whether a substantial “other side” exists to sustain increased flows. The most relevant work in this space is by Ilmanen (2016) and Blitz (2017).
Acknowledgments
The author wishes to thank Stephen Brown, Luis Garcia-Feijóo, Robert Faff, and an anonymous referee for their constructive feedback during the review process, as well as Tom Leake and Vasil Slokoski for their help and thoughtful conversations on the topic. Additionally, all comments by the participants at the Goldman Sachs Alternative Risk Premia Conference 2018 and at the London Quant Group Autumn Seminar 2018 are gratefully acknowledged. References
Notes
1 The MJ Hudson Allenbridge Systematic Factor Market Review was conducted from July to September 2017 and is available at www.mjhudson.com/download/systematic-factor-market-review/.
2 The result held even when I constrained the sample period after 2010, which excluded the strong correction that the momentum strategy suffered in the first half of 2009. For an in-depth discussion of “momentum crashes,” see Barroso and Santa-Clara (2015) and Daniel and Moskowitz (2016).
3 If anything, value investors become progressively more likely to step in as momentum outperforms to take advantage of the wider valuation spreads.
4 Investors might actually have an incentive to stay invested in divergence strategies even when the crash risk is known to be high, as shown by Chabot et al. (2014).
5 Throughout the article, I consider the equity value strategy as the systematic cross-sectional strategy in the spirit of Basu (1977, 1983) and Fama and French (1992), as opposed to the time-series/univariate strategy of Graham and Dodd (1934). The former type of value investing is a relative (cross-sectional) value trade and lends itself naturally to a systematic market-neutral strategy, whereas the latter type of value investing is an absolute/univariate value trade (seeking stocks whose market prices are below their respective intrinsic value) and is more related, although not exclusively so, to discretionary and stock-picking strategies.
6 One can also draw parallels between the momentum/value paradigm and the theory of boom/bust cycles of Soros (2010). This theory contains two “reflexive feedback loops that characterize financial markets”—one negative and one positive. As he explains, “negative feedback is self-correcting, and positive feedback is self-reinforcing. Thus, negative feedback sets up a tendency toward equilibrium, but positive feedback produces dynamic disequilibrium. . . . A positive feedback process that runs its full course is initially self-reinforcing in one direction, but eventually it is liable to reach a climax or reversal point, after which it becomes self-reinforcing in the opposite direction. But positive feedback processes do not necessarily run their full course; they may be aborted at any time by negative feedback” (p. 16).
7 Asness et al. (2013) argued that value strategies are related to long-term reversal strategies and used the negative of the past five years’ asset performance as a value signal in various asset classes. This use is supported by evidence in Fama and French (1996), who found that equity portfolios based either on this metric or on the book-to-price ratio are largely correlated with each other. Recently, Gerakos and Linnainmaa (2018) found that within an equity universe, the cross-sectional time variation in book-to-price ratios is primarily driven by the cross-sectional time variation of stock prices, as opposed to the cross-sectional time variation of book values. Put differently, a cheap stock is more likely to have become a cheap stock because of a significant long-term price decrease (relative to the cross-section of stocks) than because of a significant increase in book value. This phenomenon justifies the use of long-term price-based metrics as valuation metrics.
8 Keep in mind that I always used the residuals of a factor model that did not account for the factor of interest. As an example, when estimating the CoMetric for momentum, I used the residuals from fitting the equity factor model from to each asset i in the top and bottom baskets without controlling for momentum:
Symmetrically, when estimating the CoMetric for value, I used the residuals of a regression that did not control for value:
In this way, the factor correlation between value and momentum factors was already accounted for and did not contaminate the respective CoMetric estimates.
9 Cahan and Luo (2013), Lou and Polk (2014), and Huang et al. (2018) estimated similar metrics of comovement but used only the top or the bottom factor basket. I consider the joint metric to be a more appropriate metric of comovement because it not only captures the comovement within these two baskets but also accounts for the cross-effects. In robustness tests, I repeated my analysis but used metrics estimated from either the top or the bottom basket; my results remained broadly unaltered (and, at times, even improved) both qualitatively and quantitatively.
10 I required at least 1.5 years of subsequent performance for a week to be classified as most or least crowded; hence, the selection ended 1.5 years before the end of the sample period.
11 In unreported results, I estimated the comovement metric separately for the top or the bottom basket. I found the level of excess comovement of the top-ranked assets to exhibit a large correlation with the level of the excess comovement of the bottom-ranked assets. This correlation in crowdedness was 0.51 for equity momentum; Lou and Polk (2014) used the same methodology for a US equity universe and reported a correlation of 0.524 for momentum between 1964 and 2010. Similarly, I estimated the correlation between the two crowdedness metrics for equity value to be 0.43. This evidence supports the use of CoMetric as a proxy for crowdedness because periods of abnormal flows into or out of certain systematic strategies should be broadly reflected across the entire cross-section of assets. More importantly, the use of the joint metric allowed me to merge the information content of the two baskets and also account for any cross-effects that were not captured by the separate metrics.
12 The CoMetric data for momentum and value presented in are strictly positive for the entire sample period, with an average value (based on the five-year estimation) of 1.42% (with a standard deviation of 0.59%) for momentum and of 3.23% (with a standard deviation of 0.66%) for value. Similarly, I found strictly positive estimates for the rest of the equity premia studied; these estimates are available upon request.
13 ARP strategies dynamically rebalance as time progresses and cross-sectional ranks shift. Accordingly, Asness (2016) advised against running long-horizon regressions between current valuation and future performance, especially for portfolios with large turnover. To overcome this structural feature and directly relate current levels of crowdedness to future performance, I tracked buy-and-hold portfolios based on current ranks over the entire two-year horizon.
14 Huang et al. (2018) explained why an equity low-beta strategy can be thought of as capturing a divergence premium. When low-beta stocks outperform (and high-beta stocks underperform), their price movements result in a reduction (increase) in company leverage when expressed in, for example, a debt-to-equity ratio. This outcome results, in turn, in the stocks’ betas falling (increasing) even further, in accord with Proposition II of Modigliani and Miller (1958). Hence, the respective low-beta (high-beta) stocks are highly likely to maintain their top (bottom) rank in the cross-sectional distribution of betas. As far as quality is concerned, I classified it also as a divergence premium on the basis of the works by Asness, Frazzini, and Pedersen (2018) and Bali, Del Viva, Lambertides, and Trigeorgis (2018), who established the links between quality/profitability and low beta.
References
- Alquist, Ron, Ronen Israel, and Tobias Moskowitz. 2018. “Fact, Fiction, and Size Investing.” Journal of Portfolio Management, vol. 45, no. 1: 34–61.
- Arnott, Robert D., Noah Beck, and Vitali Kalesnik. 2016a. “Timing ‘Smart Beta’ Strategies? Of Course! Buy Low, Sell High!.” Research Affiliates (September). www.researchaffiliates.com/en_us/publications/articles/ 541_timing_smart_beta_strategies_of_course_buy_low_sell_high.html .
- Arnott, Robert D., Noah Beck, and Vitali Kalesnik. 2016b. “To Win with ‘Smart Beta’ Ask If the Price Is Right.” Research Affiliates (June). www.researchaffiliates.com/en_us/publications/articles/ 540_to_win_with_smart_beta_ask_if_the_price_is_right.html .
- Asness, Clifford S.. 2016. “The Siren Song of Factor Timing aka ‘Smart Beta Timing’ aka ‘Style Timing.’.” Journal of Portfolio Management, vol. 42, no. 5: 1–6.
- Asness, Clifford, Swati Chandra, Antti Ilmanen, and Ronen Israel. 2017. “Contrarian Factor Timing Is Deceptively Difficult.” Journal of Portfolio Management, vol. 43, no. 5: 72–87.
- Asness, Clifford S., Andrea Frazzini, and Lasse Heje Pedersen. 2018. “Quality minus Junk.” Review of Accounting Studies, vol. 24, no. 1: 34–112.
- Asness, Clifford S., Tobias J. Moskowitz, and Lasse Heje Pedersen. 2013. “Value and Momentum Everywhere.” Journal of Finance, vol. 68, no. 3: 929–85.
- Bali, Turan G., Luca Del Viva, Neophytos Lambertides, and Lenos Trigeorgis. 2018. “Seemingly Unrelated Stock Market Anomalies: Profitability, Distress, Lotteryness and Volatility.” Working paper https://editorialexpress.com/cgi-bin/conference/ download.cgi?db_name=XXVIfinanceforum&paper_id=72 .
- Barroso, Pedro, and Paulo F. Maio. 2018. “Managing the Risk of the Beta Anomaly.” Working paper.
- Barroso, Pedro, and Pedro Santa-Clara. 2015. “Momentum Has Its Moments.” Journal of Financial Economics, vol. 116, no. 1: 111–20.
- Basu, Sanjoy. 1977. “Investment Performance of Common Stocks in Relation to Their Price-Earnings Ratios: A Test of the Efficient Market Hypothesis.” Journal of Finance, vol. 32, no. 3: 663–82.
- Basu, Sanjoy. 1983. “The Relationship between Earnings’ Yield, Market Value and Return for NYSE Common Stocks: Further Evidence.” Journal of Financial Economics, vol. 12, no. 1: 129–56.
- Blitz, David. 2017. “Are Exchange-Traded Funds Harvesting Factor Premiums?” Journal of Investment Consulting, vol. 18, no. 1: 24–30 https://investmentsandwealth.org/getattachment/ ec1dd095-6901-45f3-bee7-1b1ecaf76584/JIC181-AreETFsHarvestingFactorPremiums.pdf .
- Cahan, Rochester, and Yin Luo. 2013. “Standing Out from the Crowd: Measuring Crowding in Quantitative Strategies.” Journal of Portfolio Management, vol. 39, no. 4: 14–23.
- Chabot, Benjamin, Eric Ghysels, and Ravi Jagannathan. 2014. “Momentum Trading, Return Chasing, and Predictable Crashes.” NBER Working Paper 20660 (November) .
- Daniel, Kent, and Tobias J. Moskowitz. 2016. “Momentum Crashes.” Journal of Financial Economics, vol. 122, no. 2: 221–47.
- Dichtl, Hubert, Wolfgang Drobetz, Harald Lohre, Carsten Rother, and Patrick Vosskamp. 2018. “Optimal Timing and Tilting of Equity Factors.” Working paper (15 January) http://wp.lancs.ac.uk/fofi2018/files/ 2018/03/FoFI-2018-0151-Carsten-Rother.pdf.
- Fama, Eugene F., and Kenneth R. French. 1992. “The Cross-Section of Expected Stock Returns.” Journal of Finance, vol. 47, no. 2: 427–65.
- Fama, Eugene F., and Kenneth R. French. 1993. “Common Risk Factors in the Returns on Stocks and Bonds.” Journal of Financial Economics, vol. 33, no. 1: 3–56.
- Fama, Eugene F., and Kenneth R. French. 1996. “Multifactor Explanations of Asset Pricing Anomalies.” Journal of Finance, vol. 51, no. 1: 55–84.
- Frazzini, Andrea, Ronen Israel, and Tobias Moskowitz. 2012. “Trading Costs of Asset Pricing Anomalies.” Working paper, Yale University. http://faculty.som.yale.edu/ Tobiasmoskowitz/documents/TradingCostofAssetPricingAnomalies.pdf .
- Gerakos, Joseph, and Juhani T. Linnainmaa. 2018. “Decomposing Value.” Review of Financial Studies, vol. 31, no. 5: 1825–54.
- Giamouridis, Daniel. 2017. “Systematic Investment Strategies.” Financial Analysts Journal, vol. 73, no. 4: 10–14.
- Graham, Benjamin, and David Dodd. 1934. Security Analysis. New York: McGraw-Hill.
- Huang, Shiyang, Dong Lou, and Christopher Polk. 2018. “The Booms and Busts of Beta Arbitrage.” Working paper.
- Ilmanen, Antti. 2016. “Who Is on the Other Side?” Presentation at Q Group Fall Conference.
- Ilmanen, Antti, Lars N. Nielsen, and Swati Chandra. 2015. “Are Defensive Stocks Expensive? A Closer Look at Value Spreads.” White paper, AQR. www.aqr.com/Insights/Research/White-Papers/Are-Defensive-Stocks- Expensive-A-Closer-Look-at-Value-Spreads.
- Khandani, Amir E., and Andrew W. Lo. 2007. “What Happened to the Quants in August 2007?” Journal of Investment Management, vol. 5, no. 4: 5–54.
- Khandani, Amir E., and Andrew W. Lo. 2011. “What Happened to the Quants in August 2007? Evidence from Factors and Transactions Data.” Journal of Financial Markets, vol. 14, no. 1: 1–46.
- Lou, Dong, and Christopher Polk. 2014. “Comomentum: Inferring Arbitrage Activity from Return Correlations.” Working paper.
- Modigliani, Franco, and Merton H. Miller. 1958. “The Cost of Capital, Corporation Finance and the Theory of Investment.” American Economic Review, vol. 48, no. 3: 261–97.
- Moreira, Alan, and Tyler Muir. 2017. “Volatility-Managed Portfolios.” Journal of Finance, vol. 72, no. 4: 1611–44.
- Newey, Whitney K., and Kenneth D. West. 1987. “A Simple, Positive Semi-Definite, Heteroskedasticity and Autocorrelation Consistent Covariance Matrix.” Econometrica, vol. 55, no. 3: 703–8.
- Novy-Marx, Robert, and Mihail Velikov. 2016. “A Taxonomy of Anomalies and Their Trading Costs.” Review of Financial Studies, vol. 29, no. 1: 104–47.
- Ratcliffe, Ronald, Paolo Miranda, and Andrew Ang. 2017. “Capacity of Smart Beta Strategies from a Transaction Cost Perspective.” Journal of Index Investing, vol. 8, no. 3: 39–50.
- Soros, George. 2010. The Soros Lectures: At the Central European University. New York: Public Affairs.
- Stein, Jeremy C.. 2009. “Presidential Address: Sophisticated Investors and Market Efficiency.” Journal of Finance, vol. 64, no. 4: 1517–48.