
 ?Mathematical formulae have been encoded as MathML and are displayed in this HTML version using MathJax in order to improve their display. Uncheck the box to turn MathJax off. This feature requires Javascript. Click on a formula to zoom.
Abstract
University endowments invest for future generations, so their strategy should reflect their long horizon. We researched whether they really do behave like long-term investors. We examined the behavior of US endowments since 1945 and drew comparisons with earlier periods. Using a long-run dataset on 12 major universities, we examined their preferences for risky assets and documented their big strategic moves into equities and, later, into alternatives. We then analysed how they invest at the time of crises and the extent to which they exploit their long-horizon advantage. We found that, on average, endowments invested countercyclically at crisis times, particularly by increasing their allocations to risky assets after a crisis.
Disclosure: The authors report no conflicts of interest.
Editor’s Note
Submitted 19 June 2020
Accepted 26 July 2020 by Stephen J. Brown
This article was originally published online with minor errors in and , which have been corrected for both online and print versions. Please see Correction https://doi.org/10.1080/0015198X.2020.1836941
This article, written for the 75th Anniversary Edition of the Financial Analysts Journal, celebrates the central role of endowments in advancing knowledge and practice in investing for the long term. Endowments are investment funds that aim to meet the needs of their beneficiaries over multiple generations and to adhere to the principle of intergenerational equity (Tobin 1974). They are distinctive among investors in having the opportunity to focus on long-term objectives while not having to worry so much about short-term liquidity needs or marketing considerations. In May 1956, the Analysts Journal (forerunner of the Financial Analysts Journal) published its first article focusing on endowment asset management. It highlighted the approach of these institutions in embracing common stock investing over the prior decades (Carpenter 1956). Subsequently, the styles and strategies of certain university endowments have provided a template that many institutional and individual investors have followed. Goetzmann (2020), in his recent review of some of the key contributions to asset management made by this Journal, pointed to the development of the so-called endowment model by Yale University and others and their enthusiasm for alternative assets. Although scholars have previously examined the history of insurance companies and mutual funds, little historical analysis of university endowments has been undertaken, notwithstanding the fact that they number among the oldest continuously managed funds in existence.
In an early issue of the Analysts Journal, an article highlighted one of the great challenges of money management—namely, overcoming investor psychology (Naess 1949). It neatly described the problem as follows: “The fear of losing capital when prices are low and the greed for more capital gains when prices are high and rising are probably more than any other factors responsible for poor performance” (p. 9). Still today, the great tendency is for institutional investors, such as pension plans and mutual funds, to behave procyclically during periods when big swings are occurring in the market. Recent studies confirm that institutions tend to buy assets after they have become more expensive and to sell them after a decline (Manconi, Massa, and Yasuda 2012; Papaioannou, Park, Pihlman, and Hoorn 2013; Ang, Goyal, and Ilmanen 2014; Duijm and Steins Bisschop 2018). Focusing on long-term investors, Jones (2017) found a tendency towards procyclical behavior, especially among private pension funds, in the recent past. Our study focused on a particular class of institutional investor—namely, endowments, a cohort that has every reason to take a truly long-term perspective.
We interrogated a hand-collected dataset covering 12 US university endowments that were among the wealthiest in the early 1900s. Our research period spans the 20th and 21st centuries. For each university, we assembled annual time series of asset allocations and investment returns. First, we analysed how the investment strategies of the universities evolved over the long haul, with a particular emphasis on major shifts in their allocations to risky assets. Second, we examined whether these funds do in fact behave as long-term investors by examining their investment behavior around the time of major financial crises. Did they exploit their long investment horizon and, therefore, behave countercyclically—buying assets when prices were low and selling them when prices were high?
We document here two major shifts in endowment allocations to risky assets—the first from bonds to stocks in the 1930s and 1940s and the second from stocks to alternative assets beginning in the 1980s. In both eras, the Ivy League schools led the way in these asset allocation moves. We explore the rationales behind these major shifts in investment strategy.
We also provide an analysis of the asset allocation responses of our sample of endowments before and after the onset of the United States’ six worst stock market crises in the 20th and 21st centuries: 1906–1907, 1929, 1937, 1973–1974, 2000, and 2008. For each episode, we calculated the active portfolio allocation to risky assets (defined as equities and alternative assets). Following Calvet, Campbell, and Sodini (2009) and Bams, Schotman, and Tyagi (2016), we decomposed the total changes in risky-asset allocations into a passive change (attributable to movement in the overall market) and an active change (resulting from portfolio rebalancing by the endowment). Our main finding is that during the run-up to a crisis, the 12 endowments typically decrease their active risky allocations whereas after the onset of the crisis, the endowments increase these allocations as risky-asset prices fall. Thus, the evidence suggests that endowments do, indeed, behave as long-term investors by tending to invest countercyclically.
Endowment Investing
Endowment funds were intended to be a permanent source of income for institutions that traditionally did not have income. Among the earliest endowments were Britain’s Oxbridge colleges (Acharya and Dimson 2007). Between the 13th and 16th centuries, the oldest colleges of Oxford University and Cambridge University received gifts intended to support them in perpetuity. Such gifts were typically in the form of agricultural real estate. These assets generated rental income to be spent by the colleges. Because they were prevented by statute from selling any property until the late 19th century, the original endowments remained intact over four centuries. Trust law both in Britain and in the United States meant that prudence and capital preservation were considered exceptionally important and any spending by endowments other than from interest, dividends, rents, and royalties was prohibited. Consequently, during the first half of the 20th century, the typical endowment was drawn to investing the majority of its assets in the first instance in fixed-income securities.
By the early 20th century, management of US university endowments was entrusted to the finance committees or investment subcommittees comprising the university treasurer and a number of trustees (typically, wealthy alumni). The assets were managed with the utmost caution and were typically invested in high-grade bonds (University of Michigan Survey 1931). That situation began to change in the late 1940s. As Brown (2020) recounted, 1945 marked the beginning of professional investment analysis and, in particular, the launch of the Analysts Journal. Goetzmann (2020) reminded us that Benjamin Graham was soon contributing to the Journal (e.g., see Graham 1946) and was doubtless planning his magnum opus, The Intelligent Investor (Graham 1949).
Moreover, the first issue of the leading academic journal, the Journal of Finance, appeared in 1946. In addition, although the importance of his decision was not apparent to anyone at the time, in 1947, Harry Markowitz completed his bachelor’s degree and enrolled as a graduate student at the University of Chicago. His PhD research was destined to be published just a few years later in the Journal of Finance (Markowitz 1952). The Analysts Journal played its part in educating readers on portfolio selection. G. H. Fisher (1953) advocated “a method of analysis suggested by Harry Markowitz in a recent article published in the Journal of Finance” (p. 85). Not long afterward, Weston and Beranek (1955) articulated to readers of the Analysts Journal the basics of Markowitz optimisation. They concluded that “portfolio programming affords a challenge and an opportunity for the progress of the science of finance” (p. 55).
Gradually, universities became aware of the opportunity to professionalise the management of their endowment funds. In 1948, Harvard University had made the decision to appoint Paul Cabot as university treasurer with responsibility for managing the university’s endowment. Cabot undertook this job successfully while continuing as chief executive of his investment firm, State Street (Yogg 2014). This appointment represented the first time an outside investment professional had been assigned to run Harvard’s endowment.
In the 1950s and 1960s, most endowments were unable to delegate investment decisions and had limited discretion on spending (Kochard and Rittereiser 2008). A landmark was the decision by the Ford Foundation to commission two studies in the late 1960s. The resulting “Reports to the Ford Foundation” (Cary and Bright 1969; Barker 1969) proposed changes to the way endowments were managed. Most importantly, they recommended delegation to external investment advisers, subject to appropriate monitoring by the trustees.
By the 1970s, the question of how best to manage college endowment funds had become the subject of renewed discussion, and this Journal contributed to the debate. Davidson’s (1971) article, “Investing College Endowment Funds: A Comparison of Internal and External Management,” addressed a controversy that would persist for a half-century. Textbooks started to appear that presented evidence-based approaches on managing pools of assets, such as endowments. Lorie and Hamilton (1973a) published The Stock Market: Theories and Evidence, and part of that volume was adapted for the Financial Analysts Journal (Lorie and Hamilton 1973b). Also, Black (1976) argued forcefully in this Journal that university endowments, like corporate pension funds, should follow a strategy that recognises the overall business risk of the organisation.
The largest, best-resourced university endowments—the subjects of our study—were able to embrace the Ford Foundation’s model with enthusiasm. For example, Harvard founded its own investment office (the Harvard Management Company) in 1974 to manage its assets, and other universities followed. Some of the largest endowments, such as Yale, have remained faithful to the “external manager” model, whereas others—most notably, Harvard—have until recently managed the majority of their assets internally (McDonald 2019). In addition to their influential reports, the Ford Foundation provided initial funding to bring the Commonfund into existence in 1971 as an investment company to pool the assets of endowments and have them managed professionally and externally. The Commonfund is responsible for almost 10% of all US university endowment mandates by number and is the second largest manager of outsourced US endowment assets. In collaboration with NACUBO (the National Association of College and University Business Officers), the Commonfund produced benchmarking reports for US university endowments starting in 1977. These reports were the main source of return data for our analysis.
Since the 1980s, the largest endowments have evolved into a class of sophisticated and professionally managed investors that are leading the shift into alternative investments. This strategic move has been propelled, in part, by competition among the leading universities (Goetzmann and Oster 2015). These large endowments have enjoyed better investment performance than their smaller brethren. Lerner, Schoar, and Wang (2008) attributed the long-term investment success of the Ivy League schools to the quality of their alumni network in finance and business, their aggressive adoption of alternative assets, and their exceptional manager selection ability in private equity (see also Lerner, Schoar, and Wongsunwai 2007). However, Brown, Garlappi, and Tiu (2010) and, in this Journal, Barber and Wang (2013) reported that the average US university endowment did not generate significant risk-adjusted or style-adjusted returns. Lo, Matveyev, and Zeume (2020) studied nonprofit endowment funds and found substantial heterogeneity in investment returns among funds, and they found that large funds outperform small ones in all nonprofit sectors. Hammond (2020) reported that, based on 58 years of data sourced from NACUBO, the average US university endowment has underperformed a traditional 60% equity/40% bond passive benchmark. Recently, Ennis (2020, forthcoming) highlighted the disappointing performance of endowments over the last decade, not least because of the diminished attraction of alternative assets. This finding is consistent with claims made by Sensoy, Wang, and Weisbach (2014) that the superior private equity performance of university endowments disappeared after 2000 mainly as a result of the growing maturation of the private equity asset class.
The US endowment model, often attributed to David Swensen, the chief investment officer of the Yale endowment, is thought to distil the investment philosophy and process underlying the investment success of the leading endowments into a few central tenets. One is a strong belief that public markets are highly efficient; see Brown (2020) for a discussion of the contribution by this Journal to the debate on the efficient markets hypothesis and its practical and intellectual implications. Another central tenet is that long-horizon investors should construct their portfolios around a substantial allocation to equities and/or illiquid assets (Swensen 2009). In every country for which there is a continuous time series of price and dividend data, common stocks have generated a substantial long-term real return and proved to be the best performing asset class over the last 120 years (Dimson, Marsh, and Staunton 2002, 2020).
An accompanying tenet of the endowment model is that engaging in market timing is futile. Sharpe (1975) provided an early exposition of this view in this Journal at a time when the vast majority of investors believed the exact opposite. Yet, long before the superior returns to equities became apparent, John Maynard Keynes had shifted his Cambridge college endowment into equities in the 1920s and had discovered for himself the challenges of timing markets (Chambers and Dimson 2013; Chambers, Dimson, and Foo 2015). As a result of his experiences and his advocacy for equities as the preferred asset class for long-term investors, the great economist had a considerable influence on the US endowment model (Chambers and Dimson 2015).
Finally, we should acknowledge that university endowments are tax-exempt investors, which confers on them a certain freedom in asset allocation that taxable investors do not enjoy (Geddes, Goldberg, and Bianchi 2015).
Institutional Investors and Herding
There is an established literature on the herding behavior of institutional investors. Mutual funds exhibit herding behavior mainly because of their incentive contracts and reputational considerations. Because managers are evaluated against one another, they tend to downplay their own information and beliefs in favour of staying close to their peers and not deviating from their benchmarks (Maug and Naik 2011). In addition, reputational concerns can lead fund managers to imitate past trades (Dasgupta, Prat, and Verardo 2011). Herding behavior has been examined among various types of institutional investors, such as pension funds (Blake, Sarno, and Zinna 2017) and passive funds (Fisch, Hamdani, and Solomon 2019), on the part of investor cliques (Crane, Koch, and Michenaud 2019), and in futures markets (Boyd, Büyükşahin, Haigh, and Harris 2016) and bond markets (Cai, Han, Li, and Li 2019).
Most relevant to our study is the finding that investors with short horizons tend to herd on the same information when trying to learn what other informed traders know (Froot, Scharfstein, and Stein 1992). Other papers relevant to the herding and trading literature are Sias (2004), Nofsinger and Sias (1999), Bulow and Klemperer (1994), and Dennis and Strickland (2002). As for the performance effects of herding, Jiang and Verardo (2018) recently showed a negative relationship between herding behavior and skill in mutual funds. In contrast to other institutional investors, endowment funds, because of the long-term focus of their investment objectives, should be less susceptible to herding behavior. Nonetheless, their managers still operate in a competitive environment for investment performance, and hence they may at times find it difficult not to herd. For example, Kaffe (2020) found that after adoption of the external investment manager approach during the 1980s, endowments tended to follow one another in their decisions to hire and fire external managers.
Prior studies have considered whether institutional investors exhibit herd behavior specifically at times of market distress—particularly, during the 2007–08 global financial crisis (GFC). Papaioannou et al. (2013) discussed the procyclical behavior of pension funds and mutual funds during the crisis, and Duijm and Steins Bisschop (2018) reported similar behavior by insurance companies. Mutual funds played a role in propagating the crisis by selling corporate bonds when faced with liquidity shocks (Manconi et al. 2012). Hedge funds—primarily responding to tighter funding by investors and lenders—exited the stock market as the crisis evolved (Ben-David, Franzoni, and Moussawi 2012). Similar behavior was on show during the 1999–2000 dot-com bubble. Dass, Massa, and Patgiri (2008) asserted that herding behavior driven by the contractual incentives of mutual funds contributed to this bubble. In particular, young and inexperienced mutual fund managers displayed procyclical behavior by increasing their technology holdings during the run-up and decreasing those holdings during the subsequent downturn (Greenwood and Nagel 2009). US life insurers sold equities in a falling market from 2000 onwards (Impávido and Tower 2009).
Of course, examples of countercyclical behavior also exist. During the dot-com bubble, some hedge funds were able to ride the bubble up and then reduce exposure to individual stocks before prices collapsed (Brunnermeier and Nagel 2004). Rebalancing is a particular example of countercyclical investing. Perold and Sharpe (1988) explained in this Journal how countercyclical investment can capitalize on reversals and thereby outperform a buy-and-hold strategy. Building on this argument, Ang (2012) and Norges Bank Investment Management (NBIM 2012) claimed that rebalanced portfolios display both higher returns and lower risk than do passive strategies. Most investors find following a rigorous rebalancing process difficult—especially during periods of stock market dislocation (Chien, Cole, and Lustig 2012). Some, however, such as Norway’s sovereign wealth fund, did successfully rebalance back to strategic benchmark weights in equities after the 2007–08 financial crisis hit (Dahlquist and Ødegaard 2018). Notwithstanding such arguments in favor of rebalancing, Yale’s pursuit of rebalancing out of equities and into bonds in the mid-20th century led to the university missing out on a long bull market (Ellis and Vertin 1991 p. 282). In this connection, another article in the Journal (Dybvig 1999) explained how endowments may be better off adopting a variant of portfolio insurance that protects committed expenditures from stock market distress while benefitting from long-term bull markets.
Our study adds to the above literature by describing the evolution of US university endowment asset allocation over a long sample period. Although many changes have taken place over the past 75 years, our study goes back even further, and we have evaluated the strategic behavior of endowments over more than a century. Our central question is the extent to which these US university endowments were able to exploit their long horizon by investing countercyclically.
Data
To address our research question, we used a hand-collected body of information covering the investments of 12 US university endowments for the period 1900–2017, which extends the dataset assembled by Foo (2013). Our sample starts with the eight Ivy League schools: Brown University, Columbia University, Cornell University, Dartmouth University, Harvard University, Princeton University, the University of Pennsylvania (U Penn), and Yale University. Drawing on Harmon and Soldz (1963; see their Table 7), we extended this sample by including four universities that were ranked in the early 1920s among the top 20 colleges classified by doctorate production—namely, Johns Hopkins University, the Massachusetts Institute of Technology (MIT), Stanford University, and the University of Chicago.
Our university-level data contrast with Cain’s (1942) survey for the 1926–41 period, which was undertaken for the American Council on Education Studies. Although covering a larger number of university endowments than our study, Cain reported asset allocations averaged across large, medium, and small endowments. Our sample of institutions represents the wealthiest university endowments in existence in the early 20th century. Interestingly, 7 of these universities are today among the 10 richest universities in the United States (Kerr 2019) and all 12 rank among the top 25 wealthiest according to the 2019 NACUBO-TIAA study.
Our dataset includes asset allocations, endowment market values, and investment returns for fiscal years ending in June. For data prior to 1989, we hand-collected data from the treasurer reports and financial reports of the individual universities. These data go back to 1900 in the case of Columbia, Harvard, MIT, Princeton, U Penn, and Yale and go back to 1901 for Brown, 1904 for Chicago and Cornell, 1909 for Dartmouth, 1914 for Stanford, and 1925 for Johns Hopkins. These reports fully disclose total assets under management (AUM), investment portfolios, and asset allocation at each year end. For years up to 1956, only book values are reported; thereafter, market values are also reported.
Starting in 1977, we were able to source endowment returns—and starting in 1989, asset allocations—from the reports of NACUBO and Commonfund. In the few cases where asset allocation data from NACUBO were incomplete, we used the data from the institution’s treasurer reports. Before 1977, neither the treasurer reports nor any other records that we have been able to locate disclosed endowment performance. Hence, for the earlier period, we estimated endowment returns by multiplying the allocation to fixed income, equities, and cash for each endowment-year by the corresponding asset class benchmark return from Dimson et al. (2020). In the case of real estate, which has recently represented a modest proportion of endowment asset values, we estimated a benchmark return by assuming this asset class is proxied by a 50/50 exposure to equities and corporate bonds. Data on gifts to the endowments came from the Voluntary Support for Education dataset produced by the Council for Aid to Education after 1969 and before that date, from Foo (2013).
We used the stock market index returns of Dimson et al. (2020), from which the following description is abstracted: Equity returns for 1900–1925 are from Wilson and Jones (2002) and include reinvested dividends; for 1926–1961, returns are from the Center for Research in Security Prices (CRSP) capitalization-weighted indexes of all stocks traded on the NYSE; and for 1962–2017, returns are CRSP returns on all major US exchanges. Government bond returns are based on Dimson et al. (2020) estimates for 1900–1926 and Ibbotson Associates long bond index distributed by Morningstar for 1927–2017. Corporate bond returns are similarly based on Dimson et al. (2020) estimates for 1900–1926 and on series distributed by Morningstar for 1927–2017. US Treasury bill returns are commercial bills for 1900–1918 and US T-bills for 1919–2017. Inflation is from Jones and Wilson (2006) for 1900–1913 and is the US Consumer Price Index for 1914–2017. In most long-term return studies, annual index numbers are reported from start-year to end-year; for example, a return for 1900–2017 would span 118 calendar years. In our research, returns are measured over financial years ending 30 June. Because endowments report at midyear, the research period is shorter than in other studies by one year, so a 1900–2017 return is measured over an interval of 117 years.
For much of the period we covered, little or no disclosure about spending policy is available. Only towards the end of the 20th century and following Tobin’s (1974) introduction of the concept of intergenerational equity did endowments think about spending policy beyond simply paying out income. Hammond (2020) noted that the first year in which NACUBO reported endowment spending rates was 1974. Incorporating assessments for earlier years, Hammond estimated that the compound spending rate of US endowments over the 58-year period of 1962–2019 averaged 5.0%, a level that has “moderated downward” in recent years to 4.5%. A more detailed, although less recent, analysis of US university endowment spending is provided by Brown, Dimmock, Kang, and Weisbenner (2014).
The financial goal of an endowment is to preserve or increase capital in real terms while helping with operating expenses when needed. Return objectives become more challenging over a period when expected returns have declined, as has been the case in the first two decades of the 21st century. Dimson et al. (2020) estimated a worldwide annualized long-run equity risk premium of approximately 3.5%. Because long-term US government bonds are currently yielding close to zero in real terms, the implication is that an expected return for a 60% equity/40% bond portfolio is around 2% in real terms [(0.60 × 3.5%) + (0.40 × 0) ≈ 2%]. A spending rate of 4.5% is, therefore, unsustainably high; it cannot be maintained unless the university is able to count on gifts. As Campbell and Sigalov (2020) noted, sustainable spending constraints may have given added impetus to the move into riskier asset classes.
Endowment Investing over the Long Run
provides the year of establishment for each of the 12 universities, the AUM of each endowment in 1900 and in 2017 at current prices, and the annualized real growth rate. AUM in 1900 are reported at book value. The amount of AUM would be unlikely to diverge substantially from that stated at market value, however, because the portfolios were largely invested in investment-grade bonds trading close to par value. In the case of Cornell, for which data are available only from 1904, we imputed AUM in 1900 from the 1900–03 median growth rate for the Ivy League schools. Note that the growth rates for Stanford and Johns Hopkins were estimated from the year they entered the sample.
Table 1. Annualized Real Growth Rates of Endowment Assets under Management
The assets of the average endowment in our sample grew at a real annualized rate of 4.1% over the whole period. Princeton’s assets grew the fastest (5.3% per year), and Johns Hopkins’ assets grew the slowest (2.6%). The average growth rate of Ivy League assets (4.3%) exceeded that of non–Ivy League assets (3.7%), although the difference is not statistically significant.
Of course, endowment AUM grow thanks both to gifts into the endowment and to investment performance. Between 1957—the first year in which endowments consistently reported market values—and 2017, the aggregate real market value of our endowment sample increased by US$160 billion. Of this increase, 35% came from gifts, with the remainder coming from investment performance (net of spending).
Turning to investment performance, summarizes the long-term total returns of each of our endowments. We computed arithmetic mean returns and their standard deviation as well as geometric mean returns and Sharpe ratios. In addition to the period from inception to 2017, we provide the same statistics for the modern period in endowment management, 1950 to 2017.
Table 2. Endowment Performance and Risk
As shows, the average endowment in our sample had for the whole period a geometric return of 5.6%, an arithmetic return of 6.4%, and a Sharpe ratio of 0.45 (Panel A). The fact that a few universities entered the sample at different dates makes precise comparisons of performance difficult. Broadly speaking, however, there is no material difference in the long-run performance of Ivy League versus non–Ivy League endowments. The returns lie between the geometric returns of 6.5% on US equities and 2.0% and 2.7% on, respectively, US government bonds and US corporate bonds. Benchmark returns are for the period 1900 to 2017.
Although 60/40 or 70/30 equity/fixed income benchmarks became popular in the last quarter of the 20th century, for most of the 1900s such benchmarks were unusual. In the case of pension funds, Murray (1953, p.72) wrote that
during the past three or four years, the rate of common stock investing has been increasing rapidly in the pension trusts administered for the employees of private business organizations. Targets of 25 to 35% in equities are no longer unusual.
Panel B of indicates that performance since 1950 improved over the earlier period. For individual universities, arithmetic returns range between 8.7% for Princeton and 6.2% for Johns Hopkins, and Sharpe ratios range between 0.64 for Princeton and 0.47 for Brown. The improvement in overall performance since 1950 is, in part, a result of major changes in asset allocation, as we show below—the heavier weighting in equities in the second half of the last century and the shift into equity-like (alternative) assets from the late 1980s onwards. The improvement probably also derives from the gradual professionalisation of endowment investment management from the mid-20th century onwards—a process that coincides with the emergence of this Journal and CFA Institute.
Brown et al. (2010) suggested that asset allocation policy accounts for most of the time-series variation in endowment portfolio returns. Hence, we turn our attention now to asset allocation and how it has evolved over our long sample period. Long-horizon investors have a natural advantage in allocating to risky assets to earn the risk premiums such assets offer. The question is to what extent and when did our endowments exploit this advantage.
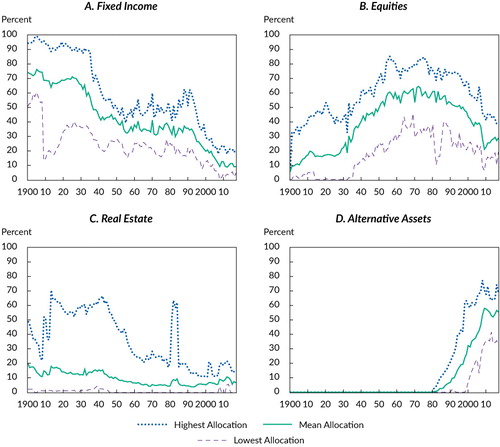
We summarize in the average, maximum, and minimum allocations to fixed income, equity, real estate, and alternative assets for each year from 1900 through 2017. Fixed income includes the total allocation to bonds, mortgages, and cash (the allocation to cash averaged only 2.4% over the whole period). The equity allocation comprises both common and preferred stock. Alternative assets embrace both private equity (venture capital and buyouts) and hedge funds.
Notes: For our sample of 12 endowments, their allocations to fixed income (bonds, mortgages, and cash), equities, real estate, and alternative assets (private equity and hedge funds) are shown from 1900 onward. For the first 3 decades of the 20th century, Equities typically includes preferred as well as common stock; thereafter, it denotes common stock only.
Although preferred stock figured prominently in endowment portfolios in the early decades of the 20th century, the majority of endowment reports did not distinguish between the two types of stock. In our sample, common stock and preferred stock weights were 18.8% and 16.1% in the 1930s, 32.8% and 13.1% in the 1940s, 50.3% and 6.4% in the 1950s, and 58.6%, and 1.8% in the 1960s, respectively. Hence, as we entered the second half of the last century, preferred stock had virtually disappeared from endowment portfolios. According to Yale’s classification from 1940,
preferred stocks and bonds in good standing were classified as fixed-income-bearing securities while defaulted bonds, preferred stocks paying no dividends, and common stocks were classified as equities. (Ellis and Vertin 1991, p. 284)
This classification suggests that the approach we were forced to follow in of bundling preferred stock together with common stock probably overestimates the allocation to equities in the early part of our sample. Nonetheless, the story told by the time-series trend remains broadly true.
In the first four decades of the 20th century, the allocation of the average endowment in our sample to fixed income—largely investment-grade corporate bonds—was 50% or more. The allocation to equities, however, was already beginning to rise by the 1930s—which is consistent with the findings of Goetzmann, Griswold, and Tseng (2010) and Carpenter (1956). It surpassed fixed income in the 1950s and reached approximately 60% from the 1960s to the 1980s.
shows the equity allocation in our sample in the Ivy League and non–Ivy League universities by decade. During the 1990s and after, this weighting began to decline steadily as funds were shifted into alternative assets. Consistent with Sharpe (1973), neither bonds nor stocks completely dominated in the asset allocations of our sample of endowments throughout most of the last century.
Table 3. Equity Allocation: Ivy League vs. Non–Ivy League
Solnik (1974), among others, was counselling US investors from the early 1970s in this Journal about the advantages of geographically diversifying their equity portfolios. Despite this advice, the overwhelming majority of the common stocks held by our sample of endowments were those of US companies until the 1990s. In that decade, the non-US equity allocation jumped from a few percent to double-digit percent, and it has remained at least as important as that of domestic equities ever since.
The real estate weight in US endowment portfolios remained low during the whole period we studied. This practice contrasts with that of the wealthiest universities in the United Kingdom—namely, Cambridge and Oxford—which historically have devoted a significant proportion of their portfolio to real estate (Chambers, Spaenjers, and Steiner 2019). The maximum real estate allocation in the sample throughout our sample period and graphed in is that of Columbia University. This circumstance reflects the impact of the substantial gift of Manhattan property in New York City made to the university in the 1910s and is further evidenced by the jump in value in the late 1970s when Columbia’s Rockefeller Center holdings were revalued. Finally, alternative assets were introduced into endowment portfolios in the 1980s, and they have today replaced equities as the dominant asset class in the largest university endowment portfolios, with an average weighting close to 50% of their endowment wealth. This strategic change has remained notwithstanding the challenge to illiquid assets posed by the GFC and by rising concerns about the asset class’s alpha-generating capability.
Clearly then, two big allocation shifts occurred within the portfolios of our university endowments over this long sample period—first, into equities and, then, into alternative assets. Although our cross-section is small, we analysed which institutions were the early adopters among our sample in terms of endowment size, university age, geographical location, and Ivy League versus non–Ivy League status. Only the Ivy League versus non–Ivy League variable had any relationship to the pace of the shift into equities and alternative assets. Panel A of summarises the average allocations to alternative assets by decade. As is the case with equity allocations in , shows that Ivy League endowments led the move into the new asset class of the day. Ivy League schools allocated a statistically significantly higher portion of their endowments to equities than the non–Ivy League schools until the 1960s; similarly, Ivy League schools allocated larger amounts to alternatives in the 1990s.
Table 4. Alternative Asset Allocation: Ivy League vs. Non–Ivy League
As Panel B of shows, the Big Three of the Ivy League (Harvard, Yale, and Princeton) led the rest of the Ivy League schools in the move into alternative assets and continued their disproportionately higher allocation to this new asset class —a finding which is consistent with the literature.
Since we entered the 21st century, two other significant shifts have occurred in asset allocation among asset owners in general: (1) a move from active to passive investing (see Brown’s 2020 Journal piece) and (2) the pursuit of factor investing (see Goetzmann 2020 for his contribution to the Journal on this topic). To the best of our knowledge, the leading university endowments have not participated to any material degree in these shifts.
Do Endowments Behave Countercyclically?
Next, we investigated whether these endowment funds behave as long-term investors by examining their investment behavior around the time of major financial crises. Such events provide opportunities for investors willing to lean against a cold wind. Prior studies have claimed that other types of institutional investor, such as pension funds and mutual funds, behave procyclically during crises—that is, buying assets when prices are high and selling them when they are low (Manconi et al. 2012; Papaioannou et al. 2013; Duijm and Steins Bisschop 2018). We now discuss whether our sample of university endowments exhibited procyclical or countercyclical tendencies in their trading behavior in crisis periods.
For this examination, we studied the allocation of endowments to risky assets during the worst stock market crises in US history since 1900. We regarded equities as the risky asset. We focused on the six major crisis periods of the 20th and 21st centuries and used Shiller’s (2020) online dataset to identify the peaks and troughs of the US equity market in each crisis period. The crises are the Panic of 1906–1907 (for which, Shiller 2020 estimated, a peak-to-trough stock market decline of –38%), the Wall Street Crash of 1929 (–84%), the economic recession of 1937 (–45%), the stock market crash of 1973–1974 (–43%), the bursting of the dot-com bubble of 2000 (–43%), and the GFC of 2008 (–51%). We did not analyse crisis periods with origins before the 20th century or ending less than three years before the date of this article (which would have included the Panic of 1901, the cryptocurrency crash, and the Covid-19 outbreak); nor did we analyse minicrashes, transitory collapses (such as Black Monday in 1987), or flash crashes (Zweig 2010). Our first two crises were recognised as major events in the pages of the Journal from its first year of publication when Edwards (1946) wrote about “the drastic losses to most investors following the summer of 1929 [and the] serious losses in late 1937 and early 1938 when there occurred a generally unexpected 50% decline in stock prices” (p. 3).
To capture active allocation changes, we adopted the methodology described in Calvet et al. (2009) and Bams et al. (2016), which decomposes the total change in asset allocation into a passive change (resulting from market fluctuations) and an active change (caused by rebalancing). We estimated the active changes by using the US equity and corporate bond total-return index series from Dimson et al. (2020).
When the risky asset is equities, we calculated the actual change as follows:
We define the passive risky asset return as the return on the equity index,
. For simplicity, we assume
that the portfolio is allocated between equities and fixed income, and the fixed-income
allocation earns a return of
. Therefore, the risky
asset weight in the portfolio is calculated as follows:
This is also the zero-rebalancing weight in the risky asset. The active change in the risky asset weight resulting from investment decisions taken by the endowment is then:
In both pre-crisis and post-crisis periods, endowments could behave countercyclically, procyclically, or have no discernible strategy. Countercyclical behavior would have involved selling the risky asset before the crisis onset and buying after. Procyclical behavior would have involved buying the risky asset before the crisis onset and selling after. To investigate their cyclical tendencies, we estimated the active changes in percentage terms of the endowment equity allocation around the six financial crises.
summarizes the active change in the equity allocation for the average endowment portfolio averaged over all six crises (Panel A), in only 20th century crises (Panel B), and in only 21st century crises (Panel C). Time is measured in financial years ending 30 June. Time t is the year of the onset of the crisis, t – 1 is the year before the onset of the crisis, t + 1 is the year after the onset of the crisis, and so on. Because our endowments report their asset allocations at the end of June, we calibrated time in terms of their financial year rather than calendar years. Time t for each crisis is, therefore, the 12 months ended, respectively, June 1907, 1930, 1937, 1973, 2000, and 2008. We report p-values of the t-test of the average active allocation change being statistically different from zero.
Table 5. Average Active Change in the Equity Allocation of Endowments around Crisis Periods(p-values in italics)
shows that, averaged across all crises and separately for crises in the 20th and 21st centuries, endowments increased their exposure to equities, on average, in the three years following the onset of a crisis—that is, after prices had fallen from their peak levels. also provides evidence of a decrease in exposure as markets were rising towards unsustainable levels at the time of the dot-com bubble of 2000 and the 2008 GFC (see Panel C).
Of course, since 2000, the allocation to private equity has become more important in these endowment portfolios. Adding it to the portfolios can be regarded as adding to equity exposure. Expanding our definition of the risky asset to comprise both public and private equity is problematic, however, for two reasons. First, private equity is more illiquid than public equities and less easily traded during crisis periods. Second, private equity changes will be partly driven by the timing of capital distributions and capital calls made by the private equity fund managers rather than the endowments themselves. Hence, Robinson and Sensoy (2013) showed that private equity capital distributions usually take place at the top of the cycle (thus in the run-up) and capital calls at the bottom of the cycle.
Conclusion
During the past 75 years, the Financial Analysts Journal has made an extraordinary contribution to the practice of investment management. Reported advances have been developed by practitioners and academics, many of whom were supported by the world’s top universities and business schools. This moment is a good time to reflect on how university endowments have evolved over the same 75-year interval and over even longer periods.
University endowments are one of the oldest classes of institutional investor. They focus on a distinctively long horizon and have pursued an approach that many investors subsequently adopted. Particularly informative is a study of how they allocated their portfolios over the long run and how they invested during the most important financial crises since the beginning of the 20th century.
In the first part of this article, we documented the distinctive trends in endowments’ long-term asset allocations, such as the early adoption of equity investing and the more recent shift into alternative assets. We highlighted that Ivy League schools were the ones initiating the switches into relatively new asset classes. The heavier weighting in equities and then equity-like alternative assets from the mid-20th century onwards helped drive endowment returns in the second half of our long sample period. In the last half-century, we witnessed at these endowments the professionalisation of investment management, with support from CFA Institute and the Financial Analysts Journal. Endowment asset management profited from the insights of academic finance and benefitted from advances in the investment industry in general.
In the second part of the article, we examined how these important long-horizon investors behaved around times of crisis. Calculating changes in active risky-asset allocations, we found that endowments typically exhibited a countercyclical investment pattern—in particular, increasing their allocations to equities after the onset of a crisis. In comparison, extensive prior evidence indicates that retail and other investors without the advantage of a long horizon exhibit strongly procyclical behavior. We hope that this study deepens understanding of the investment strategies of university endowments over the very long run.
We thank the editors, Stephen J. Brown and Heidi Raubenheimer, CFA, and Francesca Cornelli, Justin Foo, Will Goetzmann, John Griswold, Antti Ilmanen, Bradley Jones, Allison Kaspriske, Paul Marsh, Zhenkai Ran, Ken Redd, Pedro Saffi, Mike Staunton, Larry Tavares, as well as Luis Garcia-Feijóo, CFA, CIPM, Daniel Giamouridis, and Steven Thorley, CFA, for valuable insights, suggestions, and data contributions. The authors acknowledge support from FTSE Russell, the Centre for Endowment Asset Management at Cambridge University, the Cambridge Endowment for Research in Finance, the Foundation for Education and European Culture, and the Cambridge Trust Scholarship.
References
- Acharya, S., and E. Dimson. 2007. Endowment Asset Management: Investment Strategies in Oxford and Cambridge. Oxford, UK: Oxford University Press https://doi.org/10.1093/acprof:oso/9780199210916.001.0001.
- Ang, A.. 2012. “Dynamic Portfolio Choice.” Working paper, BlackRock (11 July). Available at https://ssrn.com/id=2103734 https://doi.org/10.2139/ssrn.2103734.
- Ang, A., A. Goyal, and A. Ilmanen. 2014. “Asset Allocation and Bad Habits.” Rotman International Journal of Pension Management, vol. 7, no. 2: 16–27.
- Bams, D., P. C. Schotman, and M. Tyagi. 2016. “Asset Allocation Dynamics of Pension Funds.” Netspar Discussion Paper No. 03/ 2016-016 (20 April). Available at https://ssrn.com/id=2766491 https://doi.org/10.2139/ssrn.2766491.
- Barber, B. M., and G. Wang. 2013. “Do (Some) University Endowments Earn Alpha?” Financial Analysts Journal, vol. 69, no. 5: 26–44 https://doi.org/10.2469/faj.v69.n5.4.
- Barker, R. R.. 1969. Managing Educational Endowments. New York: Ford Foundation.
- Ben-David, I., F. Franzoni, and R. Moussawi. 2012. “Hedge Fund Stock Trading in the Financial Crisis of 2007–2009.” Review of Financial Studies, vol. 25, no. 1: 1–54 https://doi.org/10.1093/rfs/hhr114.
- Black, F.. 1976. “The Investment Policy Spectrum: Individuals, Endowment Funds and Pension Funds.” Financial Analysts Journal, vol. 32, no. 1: 23–31 https://doi.org/10.2469/faj.v32.n1.23.
- Blake, D., L. Sarno, and G. Zinna. 2017. “The Market for Lemmings: The Herding Behavior of Pension Funds.” Journal of Financial Markets, vol. 36, no. November: 17–39 https://doi.org/10.1016/j.finmar.2017.03.001.
- Boyd, N. E., B. Büyükşahin, M. S. Haigh, and J. H. Harris. 2016. “The Prevalence, Sources, and Effects of Herding.” Journal of Futures Markets, vol. 36, no. 7: 671–94 https://doi.org/10.1002/fut.21756.
- Brown, J., S. Dimmock, J. Kang, and S. Weisbenner. 2014. “How University Endowments Respond to Financial Market Shocks: Evidence and Implications.” American Economic Review, vol. 104, no. 3: 931–62 https://doi.org/10.1257/aer.104.3.931.
- Brown, K. C., L. Garlappi, and C. Tiu. 2010. “Asset Allocation and Portfolio Performance: Evidence from University Endowment Funds.” Journal of Financial Markets, vol. 13, no. 2: 268–94 https://doi.org/10.1016/j.finmar.2009.12.001.
- Brown, S. J.. 2020. “The Efficient Market Hypothesis, the Financial Analysts Journal, and the Professional Status of Investment Management.” Financial Analysts Journal, vol. 76, no. 2: 5–14 https://doi.org/10.1080/0015198X.2020.1734375.
- Brunnermeier, M. K., and S. Nagel. 2004. “Hedge Funds and the Technology Bubble.” Journal of Finance, vol. 59, no. 5: 2013–40 https://doi.org/10.1111/j.1540-6261.2004.00690.x.
- Bulow, J., and P. Klemperer. 1994. “Rational Frenzies and Crashes.” Journal of Political Economy, vol. 102, no. 1: 1–23 https://doi.org/10.1086/261919.
- Cai, F., S. Han, D. Li, and Y. Li. 2019. “Institutional Herding and Its Price Impact: Evidence from the Corporate Bond Market.” Journal of Financial Economics, vol. 131, no. 1: 139–67 https://doi.org/10.1016/j.jfineco.2018.07.012.
- Cain, H.. 1942. College and University Investments and Income, 1925–1941. Washington, DC: American Council on Education Studies.
- Calvet, L. E., J. Y. Campbell, and P. Sodini. 2009. “Fight or Flight? Portfolio Rebalancing by Individual Investors.” Quarterly Journal of Economics, vol. 124, no. 1: 301–48 https://doi.org/10.1162/qjec.2009.124.1.301.
- Campbell, J.Y., and R. Sigalov. 2020. “Portfolio Choice with Sustainable Spending: A Model of Reaching for Yield.” NBER Working Paper No. 27025 (April) https://doi.org/10.3386/w27025.
- Carpenter, A. E.. 1956. “College and University Endowment Funds: How Much Common?” Analysts Journal, vol. 12, no. 2: 63–65 https://doi.org/10.2469/faj.v12.n2.63.
- Cary, W. L., and C. B. Bright. 1969. The Law and Lore of Endowment Funds. New York: Ford Foundation.
- Chambers, D., and E. Dimson. 2013. “Retrospectives: John Maynard Keynes, Investment Innovator.” Journal of Economic Perspectives, vol. 27, no. 3: 213–28 https://doi.org/10.1257/jep.27.3.213.
- Chambers, D., and E. Dimson. 2015. “The British Origins of the US Endowment Model.” Financial Analysts Journal, vol. 71, no. 2: 10–14 https://doi.org/10.2469/faj.v71.n2.7.
- Chambers, D., E. Dimson, and J. Foo. 2015. “Keynes the Stock Market Investor: A Quantitative Analysis.” Journal of Financial and Quantitative Analysis, vol. 50, no. 4: 843–68 https://doi.org/10.1017/S0022109015000186.
- Chambers, D., C. Spaenjers, and E. Steiner. 2019. “The Rate of Return on Real Estate: Long-Run Micro-Level Evidence.” HEC Paris Research Paper No. FIN–2019-1342 (26 September). Available at https://ssrn.com/id=3407236 .
- Chien, Y., H. Cole, and H. Lustig. 2012. “Is the Volatility of the Market Price of Risk Due to Intermittent Portfolio Rebalancing?” American Economic Review, vol. 102, no. 6: 2859–96 https://doi.org/10.1257/aer.102.6.2859.
- Crane, A. D., A. Koch, and S. Michenaud. 2019. “Institutional Investor Cliques and Governance.” Journal of Financial Economics, vol. 133, no. 1: 175–97 https://doi.org/10.1016/j.jfineco.2018.11.012.
- Dahlquist, M., and B. A. Ødegaard. 2018. “A Review of Norges Bank’s Active Management of the Government Pension Fund Global.” Swedish House of Finance Research Paper No. 18-7 (13 April) https://doi.org/10.2139/ssrn.3114175.
- Dasgupta, A., A. Prat, and M. Verardo. 2011. “The Price Impact of Institutional Herding.” Review of Financial Studies, vol. 24, no. 3: 892–925 https://doi.org/10.1093/rfs/hhq137.
- Dass, N., M. Massa, and R. Patgiri. 2008. “Mutual Funds and Bubbles: The Surprising Role of Contractual Incentives.” Review of Financial Studies, vol. 21, no. 1: 51–99 https://doi.org/10.1093/rfs/hhm033.
- Davidson, H. A.. 1971. “Investing College Endowment Funds: A Comparison of Internal and External Management.” Financial Analysts Journal, vol. 27, no. 1: 69–74 https://doi.org/10.2469/faj.v27.n1.69.
- Dennis, P. J., and D. Strickland. 2002. “Who Blinks in Volatile Markets, Individuals or Institutions?” Journal of Finance, vol. 57, no. 5: 1923–49 https://doi.org/10.1111/0022-1082.00484.
- Dimson, E., P. Marsh, and M. Staunton. 2002. Triumph of the Optimists: 101 Years of Global Investment Returns. Princeton, NJ: Princeton University Press https://doi.org/10.1515/9781400829477.
- Dimson, E., P. Marsh, and M. Staunton. 2020. Global Investment Returns Yearbook 2020. Zurich: Credit Suisse Research Institute.
- Duijm, P., and S. Steins Bisschop. 2018. “Short-Termism of Long-Term Investors? The Investment Behaviour of Dutch Insurance Companies and Pension Funds .” Applied Economics, vol. 50, no. 31: 3376–87 https://doi.org/10.1080/00036846.2017.1420898.
- Dybvig, P. H.. 1999. “Using Asset Allocation to Protect Spending.” Financial Analysts Journal, vol. 55, no. 1: 49–62 https://doi.org/10.2469/faj.v55.n1.2241.
- Edwards, W. F.. 1946. “Judgment versus Mechanical Investment Plans: The Dow Theory in Retrospect.” Analysts Journal, vol. 2, no. 1: 3–8 https://doi.org/10.2469/faj.v2.n1.3.
- Ellis, C. D., and J. R. Vertin. 1991. Capital II: Another Investor’s Anthology. New York: McGraw-Hill.
- Ennis, R. M.. 2020. “Institutional Investment Strategy and Manager Choice: A Critique.” Journal of Portfolio Management, vol. 46, no. 5: 104–17 https://doi.org/10.3905/jpm.2020.1.141.
- Ennis, R. M. Forthcoming. “Endowment Performance.” Journal of Portfolio Management.
- Fisch, J., A. Hamdani, and S. D. Solomon. 2019. “The New Titans of Wall Street: A Theoretical Framework for Passive Investors.” University of Pennsylvania Law Review, vol. 168: 17–72.
- Fisher, G. H.. 1953. “The Input-Output Technique as an Aid in Security Analysis.” Analysts Journal, vol. 9, no. 1: 85–92 https://doi.org/10.2469/faj.v9.n1.85.
- Foo, J. F. S.. 2013. “Essays on Long Term Investing.” PhD thesis, Cambridge Judge Business School, Cambridge University.
- Froot, K., D. S. Scharfstein, and J. C. Stein. 1992. “Herd on the Street: Informational Inefficiencies in a Market with Short-Term Speculation.” Journal of Finance, vol. 47, no. 4: 1461–84 https://doi.org/10.1111/j.1540-6261.1992.tb04665.x.
- Geddes, P., L. R. Goldberg, and S. W. Bianchi. 2015. “What Would Yale Do If It Were Taxable?” Financial Analysts Journal, vol. 71, no. 4: 10–23 (corrected January 2016).
- Goetzmann, W. N.. 2020. “The Financial Analysts Journal and Investment Management.” Financial Analysts Journal, vol. 76, no. 3: 5–21 https://doi.org/10.1080/0015198X.2020.1766287.
- Goetzmann, W. N., J. Griswold, and Y.-F. A. Tseng. 2010. “Educational Endowments in Crises.” Journal of Portfolio Management, vol. 36, no. 4: 112–23 https://doi.org/10.3905/jpm.2010.36.4.112.
- Goetzmann, W. N., and S. Oster. 2015. “Competition among University Endowments.” In How the Financial Crisis and Great Recession Affected Higher Education edited byBrown, J. R., and C. M. HoxbyChicago: University of Chicago Press.
- Graham, B.. 1946. “On Being Right in Security Analysis.” Analysts Journal, vol. 2, no. 1: 18–21 https://doi.org/10.2469/faj.v2.n1.18.2.
- Graham, B.. 1949. The Intelligent Investor. New York: Harper & Brothers.
- Greenwood, R., and S. Nagel. 2009. “Inexperienced Investors and Bubbles.” Journal of Financial Economics, vol. 93, no. 2: 239–58 https://doi.org/10.1016/j.jfineco.2008.08.004.
- Hammond, D.. 2020. “A Better Approach to Systematic Outperformance? 58 Years of Endowment Performance.” Journal of Investing, vol. 29, no. 5: 1–25 https://doi.org/10.3905/joi.2020.1.138.
- Harmon, L. R., and H. Soldz, eds.1963. Doctorate Production in United States Universities, 1920–1962, with Baccalaureate Origins of Doctorates in Sciences, Arts, and Professions. Washington, DC: National Research Council of the National Academy of Sciences.
- Impávido, G., and I. Tower. 2009. “How the Financial Crisis Affects Pensions and Insurances and Why the Impacts Matter.” IMF Working Paper 09-151.
- Innocenti, R. E.. 1969. “The Stock-Bond Split Decision for Pension Funds.” Financial Analysts Journal, vol. 25, no. 6: 97–101 https://doi.org/10.2469/faj.v25.n6.97.
- Jiang, H., and M. Verardo. 2018. “Does Herding Behavior Reveal Skill? An Analysis of Mutual Fund Performance.” Journal of Finance, vol. 73, no. 5: 2229–69 https://doi.org/10.1111/jofi.12699.
- Jones, B.. 2017. “Leaning with the Wind: Long-Term Asset Owners and Procyclical Investing.” Journal of Investment Management, vol. 15, no. 2: 16–38.
- Jones, C. P., and J. W. Wilson. 2006. “The Impact of Inflation Measures on the Real Returns and Risk of U.S. Stocks.” Financial Review, vol. 41, no. 1: 77–94 https://doi.org/10.1111/j.1540-6288.2006.00131.x.
- Kaffe, C.. 2020. “Essays in Asset Management: Long Horizon Investing.” PhD thesis, Cambridge Judge Business School, Cambridge University.
- Kerr, E.. 2019. “10 Universities with the Biggest Endowments.” U.S. News & World Report24 (September) www.usnews.com/education/best-colleges/the-short-list-college/articles/ 10-universities-with-the-biggest-endowments.
- Kochard, L. E., and C. M. Rittereiser. 2008. Foundation and Endowment Investing. Hoboken, NJ: John Wiley & Sons.
- Lerner, J., A. Schoar, and J. Wang. 2008. “Secrets of the Academy: The Drivers of University Endowment Success.” Journal of Economic Perspectives, vol. 22, no. 3: 207–22 https://doi.org/10.1257/jep.22.3.207.
- Lerner, J., A. Schoar, and W. Wongsunwai. 2007. “Smart Institutions, Foolish Choices: The Limited Partner Performance Puzzle.” Journal of Finance, vol. 62, no. 2: 731–64 https://doi.org/10.1111/j.1540-6261.2007.01222.x.
- Lo, A., E. Matveyev, and S. Zeume. 2020. “The Risk, Reward, and Asset Allocation of Nonprofit Endowment Funds.” Working paper (7 August). Available at https://ssrn.com/id=3560240 .
- Lorie, J., and M. T. Hamilton. 1973a. The Stock Market: Theories and Evidence. Burr Ridge, IL: Irwin.
- Lorie, J., and M. T. Hamilton. 1973b. “New Focus for Investment Counselling to Pension and Endowment Portfolios: Long Range Risk Policy.” Financial Analysts Journal, vol. 29, no. 4: 46–50 https://doi.org/10.2469/faj.v29.n4.46.
- Manconi, A., M. Massa, and A. Yasuda. 2012. “The Role of Institutional Investors in Propagating the Crisis of 2007–2008.” Journal of Financial Economics, vol. 104, no. 3: 491–518 https://doi.org/10.1016/j.jfineco.2011.05.011.
- Markowitz, H. M.. 1952. “Portfolio Selection.” Journal of Finance, vol. 7, no. 1: 77–91.
- Maug, E., and N. Naik. 2011. “Herding and Delegated Portfolio Management: On Asset Allocation.” Quarterly Journal of Finance, vol. 1, no. 2: 265–92 https://doi.org/10.1142/S2010139211000092.
- McDonald, M.. 2019. “Harvard Piles into Hedge Funds as New Chief Overhauls Endowment.” Bloomberg.com6 (May) .
- Murray, R. F.. 1953. “Trusts and Mutual Savings Banks.” Financial Analysts Journal, vol. 9, no. 3: 72–74 https://doi.org/10.2469/faj.v9.n3.72.
- Naess, R. D.. 1949. “The Enigma of Investment Management.” Analysts Journal, vol. 5, no. 3: 5–9 https://doi.org/10.2469/faj.v5.n3.5.
- NBIM. 2012. “Empirical Analysis of Rebalancing Strategies.” Discussion noteNorges Bank Investment Management (30 March).
- Nofsinger, J. R., and R. W. Sias. 1999. “Herding and Feedback Trading by Institutional and Individual Investors.” Journal of Finance, vol. 54, no. 6: 2263–95 https://doi.org/10.1111/0022-1082.00188.
- Papaioannou, M. G., J. Park, J. Pihlman, and H. V. D. Hoorn. 2013. “Procyclical Behavior of Institutional Investors during the Recent Financial Crisis: Causes, Impacts, and Challenges.” IMF Working Paper 2013/193 (September) https://doi.org/10.5089/9781484336083.001.
- Perold, A. F., and W. F. Sharpe. 1988. “Dynamic Strategies for Asset Allocation.” Financial Analysts Journal, vol. 44, no. 1: 16–27 https://doi.org/10.2469/faj.v44.n1.16.
- Robinson, D. T., and B. A. Sensoy. 2013. “Do Private Equity Fund Managers Earn Their Fees? Compensation, Ownership, and Cash Flow Performance.” Review of Financial Studies, vol. 26, no. 11: 2760–97 https://doi.org/10.1093/rfs/hht055.
- Sensoy, B. A., Y. Wang, and M. S. Weisbach. 2014. “Limited Partner Performance and the Maturing of the Private Equity Industry.” Journal of Financial Economics, vol. 112, no. 3: 320–43 https://doi.org/10.1016/j.jfineco.2014.02.006.
- Sharpe, W. F.. 1973. “Bonds versus Stocks: Some Lessons from Capital Market Theory.” Financial Analysts Journal, vol. 29, no. 6: 74–80 https://doi.org/10.2469/faj.v29.n6.74.
- Sharpe, W. F.. 1975. “Likely Gains from Market Timing.” Financial Analysts Journal, vol. 31, no. 2: 60–69 https://doi.org/10.2469/faj.v31.n2.60.
- Shiller, R. J.. 2020. “Online Data Robert Shiller.” www.econ.yale.edu/~shiller/data.htm.
- Sias, R. W.. 2004. “Institutional Herding.” Review of Financial Studies, vol. 17, no. 1: 165–206 https://doi.org/10.1093/rfs/hhg035.
- Solnik, B. H.. 1974. “Why Not Diversify Internationally Rather Than Domestically?” Financial Analysts Journal, vol. 30, no. 4: 48–54 https://doi.org/10.2469/faj.v30.n4.48.
- Swensen, D. F.. 2009. Pioneering Portfolio Management: An Unconventional Approach to Institutional Investment2nd ed.New York: Free Press.
- Tobin, J.. 1974. “What Is Permanent Endowment Income?” American Economic Review, vol. 64, no. 2: 427–32.
- University of Michigan Survey. 1931. Records of the Treasurer of Harvard University Archive UAI50 Box 77, F16Cambridge, MA: Harvard University.
- Weston, J. F., and W. Beranek. 1955. “Programming Investment Portfolio Construction.” Analysts Journal, vol. 11, no. 2: 51–55 https://doi.org/10.2469/faj.v11.n2.51.
- Wilson, J., and C. Jones. 2002. “An Analysis of the S&P 500 Index and Cowles’s Extensions: Price Indexes and Stock Returns, 1870–1999.” Journal of Business, vol. 75, no. 3: 505–33 https://doi.org/10.1086/339903.
- Yogg, M. R.. 2014. Passion for Reality: The Extraordinary Life of the Investing Pioneer Paul Cabot. New York: Columbia University Press.
- Zweig, J.. 2010. “Back to the Future: Lessons from the Forgotten ‘Flash Crash’ of 1962.” Wall Street Journal29 (May) .