?Mathematical formulae have been encoded as MathML and are displayed in this HTML version using MathJax in order to improve their display. Uncheck the box to turn MathJax off. This feature requires Javascript. Click on a formula to zoom.
Abstract
Expenditures on the creation of intangible capital have increased, but accounting standards have not kept pace. We investigated whether this has affected the value relevance of book value and earnings. We constructed a composite measure of intangible intensity by which to classify industries. The measure is based on intangible assets capitalized on the balance sheet; research and development expenditures; and sales, general, and administrative expenditures. We show that the value relevance of book value and earnings has declined for high-intangible-intensity companies in the United States and abroad, but for the low-intangible-intensity group, it has remained stable in the United States while increasing internationally.
Editor’s Note:
Submitted 19 October 2020
Accepted 30 December 2020 by Stephen J. Brown
Disclosure: The authors report no conflicts of interest.
This article was externally reviewed using our double-blind peer-review process. When the article was accepted for publication, the authors thanked the reviewers in their acknowledgments. John Adams and one anonymous reviewer were the reviewers for this article.
Expenditures for the creation of intangible capital have increased since the 1990s, but accounting standards have not adapted to this increase. Among the sample of non-US companies we studied for this article, the proportion of capitalized intangible assets (excluding goodwill) relative to total assets increased from 0.2% to 2.2% between 1994 and 2018, and for US companies, these assets rose from 2.75% to 6.12%. Uncapitalized intangible capital expenditures, such as those on research and development (R&D), also increased over the same period. For our sample of international companies, R&D expenses relative to total revenues rose from 1.52% to 2.20%, and for US companies, they grew from 9.47% to 14.36% from 1994 to 2018.
Recently, several authors investigated the impact of the increase in importance of intangible assets relative to that of physical assets on US value investing strategies (Arnott, Harvey, Kalesnik, and Linnainmaa 2021; Amenc, Goltz, and Luyten 2020; Lev and Srivastava 2019). They adjusted book-to-price ratios (B/Ps) to account for the biases caused by unrecorded intangible capital, but they concurred that the decline in the effectiveness of value-based investment strategies in the United States cannot be attributed to the structural economic changes generated by intangibles or the failure of accounting standards to adapt to those changes. Li (2020) extended their work to certain other countries—the United Kingdom, the countries of continental Europe, Japan, and Asia ex Japan.
Our work does not predict whether or when the performance of US value strategies will recover, advocate the use of one or more preferred value measures, or recommend adjustment of valuation ratios to compensate for omitted intangibles in the quest for higher stock returns. Instead, we offer a way to adapt traditional equity investment analysis to handle the effect of variations in intangible asset intensity among companies and industries and extend the US research on this topic to the world’s 14 largest international economies—8 of the developed markets studied by Li (2020) and 6 emerging markets. We show that the relationship between financial variables and contemporaneous stock prices has weakened so much for high-intangible-intensity companies in both the United States and abroad that investors can no longer afford to ignore the changes in the economic environment created by intangibles.
Global accounting standards require companies to expense, rather than capitalize, the amounts spent on activities that create intangible capital. This requirement results in a systematic and persistent understatement of the book value of equity. Some other value metrics that can be used to identify value stocks, such as earnings to price and cash flow to price, are also affected by accounting distortions. The reason is that the costs incurred for creating intangible capital are expensed immediately whereas the corresponding revenues/cash inflows that the assets generate typically occur over one or more future periods. The result is a mismatch between expenses and revenues on income statements. Footnote1 For example, Lev and Sougiannis (1996) showed that in the chemical and pharmaceutical industries, an initial outlay on R&D that is immediately expensed can beneficially affect revenues and earnings for up to nine years. Moreover, capitalized intangible assets affect reported earnings over long periods as they are gradually amortized (expensed), although amortization practices vary by intangible type and by industry and country.
Arnott et al. (2021) and Amenc et al. (2020) showed that adjustments to book value to account for the effect of intangibles do improve the return prediction ability of B/P for US companies, and Li (2020) confirmed this finding for companies in several international markets. Nevertheless, Arnott et al. (pp. 61, 65) conceded,
This improved measure of value has also recently suffered a large drawdown and after 2007 has still not been as good as S/P [sales to price] or E/P [earnings to price]. Perhaps intangibles-adjusted B/P is still missing something important. . . . It will be an interesting topic for future research to gauge which metrics perform best in producing a better HML [high book-to-market value minus low book-to-market value] value factor or in predicting future corporate profits and whether optimal settings for these metrics vary by industry, sector, or country.
We complement the work in these areas by exploring other measures of value and the variation in those measures among industries and countries. We propose a composite measure of intangible intensity that captures the interindustry variation in the impact on the financial statement of three types of intangible capital: intangible assets reported on the balance sheet (excluding goodwill), innovation (R&D) capital, and organization (sales, general, and administrative) capital.
Using this composite to classify industries into high- and low-intangible-intensity groups, we analyzed the contemporaneous relationship between (1) stock prices and (2) book values and earnings within each intensity group for both US and international companies. We found that within the high-intangible-intensity group, the combined value relevance of book value and earnings declined between 1994 and 2018 for both US and international companies. In contrast, the value relevance of these variables for the low-intangible-intensity group remained stable in the United States but increased internationally over the same period. We show that the divergence in the value relevance of book value and earnings between the high- and low-intangible-intensity groups is greater for international companies and has increased more in international markets than in the US market. Our results are especially important for international equity investors seeking to build investment strategies that account for the impact of intangible intensity on valuation ratios and other financial metrics used to assess the profitability, quality, growth, and risk characteristics of companies.
Motivation for the Study
Our research was motivated by (1) the potential effect of intangibles on equity valuation ratios that link book values and earnings to the intrinsic value of companies via the Ohlson (1995) residual income valuation model and (2) the possible effect of intangibles on other investment metrics of importance to equity investors. Intangibles and their inadequate accounting can affect corporate value and risk factors, such as asset growth or debt-to-equity ratios. Via their impact on reported earnings, intangibles and their inadequate accounting can also affect profitability characteristics, such as return on equity. The adjustments to B/P suggested by Arnott et al. (2021) , Amenc et al. (2020), and Li (2020) provide no information about this issue. Our broad examination of whether the rise of intangibles has influenced the relationship between fundamental financial variables, such as book value and earnings, and contemporaneous stock prices can provide insights into these aspects.
Prior research evidence in US markets on how investments in intangible capital affect the value relevance of book value and earnings is inconclusive. Lev and Gu (2016, p. 89) showed that correlations between contemporaneous stock prices and both book value and earnings have dropped from 1950 to 2013 because of increasing investments in intangible capital. Barth, Li, and McClure (2018) argued, however, that although the value relevance of certain items, such as net income, has declined, the aggregate value relevance of the “accounting amounts” they examined remained unchanged from 1962 through 2014.Footnote2 Collins, Maydew, and Weiss (1997) concluded that the combined value relevance of earnings and book value of US intangible-intensive companies did not decline over the 1953–93 period, but Ciftci, Darrough, and Mashruwala (2014) inferred the opposite from their analysis of a similar set of companies between 1975 and 2007. Core, Guay, and Buskirk (2003) examined the same issue for the 1975–99 period for a broad sample of US companies and for subsamples they considered to be emblematic of the “New Economy.” They found that the explanatory power of their model deteriorated in the New Economy subperiod (1995–1999) for all types of companies. These conflicting findings from prior research indicate that the magnitude and direction of the influence of intangibles on the value relevance of book value and earnings are unclear. Possibly, in the US market, the correlation between stock prices and these two financial variables may have fluctuated over time.
International evidence about the impact of intangibles on the value relevance of book value and earnings has been extremely scarce and has generally been limited to the UK and Australian markets. Silva (2012) showed that in the UK market, book value is the better predictor of share price for low-intangible-intensity industries whereas earnings have greater efficacy in high-intangible-intensity industries. Goodwin and Ahmed (2006) found for the Australian market that during the period prior to the 2005 implementation of the Australian equivalent to International Financial Reporting Standards, when both expensing and capitalization of intangibles were permitted, the value relevance of earnings for Australian companies decreased but the decline was less pronounced for companies that recognized intangible assets (“capitalizers”). A significantly higher proportion of the capitalizers belonged to intangible-intensive industries. Fraser, Tarbert, and Tee (2009) demonstrated that in the UK market, the share price reaction to disclosures of interim reports, preliminary earnings reports, and annual reports to shareholders was less significant in sectors where investment in intangible assets was relatively high, indicating that financial variables had lower value relevance for intangible-intensive companies than for other companies.
Thus, the conclusions of past research on the value relevance of book value and earnings in US markets are mixed and do not extend beyond 2012. We used evidence from more recent time periods to reexamine this issue and assess whether changes in the value relevance of book value and earnings as a result of the increase in intangible intensity in the US market also extend to international markets.
Past (univariate) approaches focusing on specific types of uncapitalized expenditures that create intangible capital did not permit measurement of the aggregate effects of corporate spending on various types of intangible capital and evaluation of interindustry differences arising from the influence of such spending on valuation ratios or other investment metrics.Footnote3 Some researchers (e.g., Israel, Laursen, and Richardson 2020) have recommended intra-industry valuation of companies to account for differences in the types and amounts of intangible capital on equity valuations among industries. Our composite intangible-intensity measure offers investors an alternative way to capture the financial statement effects of variations in intangible capital in various industries and compare their different effects. We demonstrate that our intangible-intensity measure can do so consistently over time and across both the US and international investment universes.
Research on this topic also faces indeterminate data hurdles. Arnott et al. (2021) used company-level estimates of intangible capital provided to them by Peters and Taylor (2017) to adjust the book values of US companies. Amenc et al. (2020) made similar adjustments by using long histories of financial data and certain specific data items (e.g., industry-specific R&D depreciation rates from the US Bureau of Economic Analysis and the year of a company’s founding). Because of limited international research on this subject, whether enough breadth and history of fundamental and macroeconomic data are available to permit making such adjustments in all or most international markets is unclear. Footnote4 Using financial statement and market data from both developed and emerging international markets, we demonstrate that one can build the intangible-intensity metrics that we propose, and these metrics are robust enough for use in financial statement analysis and valuation of both US and international stocks.
Intangible-Intensity Metrics
Our composite measure of intangible intensity has three components: (1) total intangible assets reported on the balance sheet, excluding goodwill, (2) R&D expenses, and (3) sales, general, and administrative (SG&A) expenses. We discuss the reasons for the choice of these components and their measurement in the following subsections.
We used our composite measure to determine the intangible intensity of companies in all industries except the Banks, Insurance, and Diversified Financials industry groups [of the Global Industry Classification Standard (GICS) system] in the United States and abroad. We excluded these three industry groups because the metrics we used to gauge intangible intensity are affected by their atypical financial reporting practices.Footnote5 For example, because of the nature of their business, banks bundle and report several types of operating expenses in the SG&A category, and globally, almost no banks or insurance companies disclose R&D expenses.
Identifiable Intangible Assets.
We refer to a company’s total capitalized intangible assets except goodwill as identifiable intangible assets. In theory, any intangible assets reported on the balance sheet are already included in book value. Even so, we include them as a separate component in our composite intangible-intensity measure for three reasons.
First, accounting criteria for capitalization of expenditures that can create intangible capital are inconsistent. For example, in the United States, the cost of internally developed patents is required to be written off (i.e., expensed on the income statement), but if the ownership of those unrecorded patents is subsequently transferred as a result of a corporate acquisition or merger, they must be capitalized on the balance sheet of the acquirer at their fair value. Therefore, ignoring capitalized intangible assets could understate the aggregate level of intangible intensity for companies that have grown through acquisitions rather than organically. At the collective level, industries that have gone through periods of consolidation would appear to be less intangible intensive than other industries.
Second, we intended to compare the effects of intangible intensity on the value relevance of financial variables in the US and international markets. Hence, we noted that cross-country differences in accounting standards that govern the choice of expensing versus capitalizing expenditures to create intangible assets (and any change in those standards over time) can lead to problems in comparability. For example, some researchers have found changes in the value relevance of capitalized intangible assets before and after the introduction of International Financial Reporting Standards (IFRS), and some have found issues in subsamples of companies that made different financial reporting choices in regimes where both expensing and capitalization were permitted.Footnote6
Third, evidence from around the globe demonstrates that several types of intangible expenditures that have been capitalized and reported on the balance sheet were value relevant, both in aggregate and individually: Oliveira, Rodrigues, and Craig (2010) examined Portuguese companies, Ritter and Wells (2006) and Dahmash, Durand, and Watson (2009) studied companies in Australia, and Aboody and Lev (1998) evaluated the equity market effect of capitalized software development costs in the United States.
For these three reasons, we included capitalized identifiable intangible assets in our intangible-intensity composite.
We excluded goodwill from our measurement of the capitalized intangible assets for two reasons. First, our primary objective was to examine the stock market effects of various forms of intangible capital investments that have gained in importance because of the rapid transformation in corporate investment and business models since the 1990s. Since goodwill is simply an accounting byproduct of business combinations, it is unclear if it meets this criterion. Second, prior evidence regarding the value relevance of goodwill is mixed. The findings vary not only for the US and international equity markets but also for different time periods in the same market. The reason is that differences in the rules for writing off goodwill by market and over time have led to subjective assessments of the fair value of goodwill. Managerial discretion in applying goodwill valuation rules has exacerbated the problems that affect accurate measurement of goodwill (Dahmash et al. 2009).
R&D Expenses.
US accounting standards require the cost of both research and development to be expensed, but IFRS are a bit less restrictive, allowing the capitalization of development costs if certain criteria are met. In-process R&D (consisting of R&D assets acquired in business combinations or asset acquisition transactions) can also be capitalized. Thus, we can capture the effect of in-process R&D on financial statements in our first intangible capital metric—identifiable intangible assets—which was discussed previously. Although US accounting rules that require R&D costs to be expensed have remained consistent since 1974, international accounting guidance on this subject exhibits considerable variation and has continued to evolve. Footnote7 Some countries have been edging into greater conformity with the United States at an uneven pace as they move to IFRS.
Research evidence from the United States and abroad indicates that R&D expenditures create intangible innovation capital that is reflected in equity market values. This research includes that of Ahmed and Falk (2006), who examined Australian companies; a study of companies in France, Germany, the United Kingdom, and the United States by Zhao (2002); and findings by Smith, Percy, and Richardson (2001) from studying the Australian and Canadian markets. Lev and Sougiannis (1996) estimated the R&D capital of a sample of more than 800 US manufacturing companies, of which about half belonged to five high-intangible-intensity industries (chemicals and pharmaceuticals, machinery and computer hardware, electrical and electronics, transportation vehicles, and scientific instruments). The authors demonstrated that adjusting earnings and book values of companies for the capitalized value of R&D makes those variables more value relevant.
SG&A Expenses.
SG&A expenses have been used by several authors to proxy for another type of intangible company capital, namely, organization capital. Lev and Radhakrishnan (2005) characterize organization capital as the set of “unique systems and processes employed in the investment, production, and sales activities of the enterprise, along with the incentives and compensation systems governing its human resources” (p. 73). They used annual sales and general and administrative expenses reported in income statements to estimate changes in companies’ organization capital and showed that such changes explain differences between the market values and book values of US companies.
Using SG&A expenses to estimate the stock of organization capital for a sample of US companies, Eisfeldt and Papanikolaou (2013) concluded that companies with a high ratio of organization capital to book assets exhibit higher annual average market returns. Using an industry-relative measure of SG&A expenses, Angelopoulos, Giamouridis, and Vlismas (2012) showed that intangible organization capital is helpful in predicting stock returns for US companies. Comparable results for international companies, however, are sparse. Tronconi and Marzetti (2011) reported a positive link between an SG&A-based measure of organization capital and certain financial performance metrics for European companies.
Because the validity of SG&A expenses as a proxy for intangible organization capital has been confirmed by multiple studies, we used the same approach. Note that Arnott et al. (2021) and Amenc et al. (2020), however, considered only 30% of the total SG&A expenses reported on income statements to be capitalizable intangible assets. Our research was unaffected by this design choice because we used SG&A expenses to rank and classify companies according to their organization capital rather than attempt to assess its value relevance or adjust book values by the amount of unrecorded organization capital.
Other Types of Intangible Capital.
Two other financial statement items—advertising expenses and labor costs—have also been posited to create intangible capital. Advertising expenses are considered to be a gauge of intangible brand capital, and labor costs are regarded as an indicator of intangible human capital. We did not include these items in our composite measure of intangible capital for the following reasons.
Both US and international evidence corroborating the value relevance of advertising expenditures for UK companies (e.g., Shah and Akbar 2008; Shah, Stark, and Akbar 2009) is weak. Footnote8 Moreover, Govindarajan, Rajgopal, Srivastava, and Wang (2019) showed that in the United States, advertising has stayed constant since the 1980s at very low levels compared with expenditures on other forms of intangible capital, such as R&D.Footnote9 Finally, advertising expenses are a subcomponent of sales and marketing expenses, which are included in the aggregate SG&A expenses figure usually reported in income statements. Because we used aggregate SG&A expenses to represent organizational capital in our intangible-intensity composite, either sales and marketing expenses or, ideally, advertising expenses should be excluded from the aggregate SG&A expenses figure to avoid double counting of advertising expenses in the composite. Most companies, however, do not disclose either of these items separately. Because convincing evidence about the value relevance of intangible brand capital is lacking and in light of the practical difficulties related to its measurement, we did not include it in our composite measure of intangible intensity.
Prior evidence supporting the value relevance of human capital includes Angelopoulos et al. (2012), who reported that long–short portfolios based on an industry-relative human capital measure provide statistically significant risk-adjusted returns for only the first year after portfolio formation, and Pantzalis and Park (2009), who found that arbitrage portfolios based on a market valuation measure of intangible human capital provide excess returns only for small companies. Edmans (2011) considered employee satisfaction to be a type of intangible asset and demonstrated that for a limited number of companies (the “100 Best Companies to Work for in America”), it is positively correlated with shareholder returns. He acknowledged that the companies in his sample are unusually large and exhibit notably better earnings performance than other companies. In fact, not all the companies in his sample are publicly traded, which further limits data availability for comparable studies. A common theme underlying all studies in this area is that, unlike R&D and SG&A expenses that link intuitively to, respectively, innovation capital and organization capital, investments in human capital are notoriously difficult to measure, which prompts researchers to use indirect, output-based estimates. Because investments in intangible human capital assets are difficult to quantify and data to estimate such investments are hard to obtain in all 15 of the markets we studied, we did not include such investments in our intangible-intensity composite, but these assets remain a topic for future investigation.
Data and Methodology
Our sample consisted of companies based in countries ranked by 2018 GDP among the top 15 in the world according to the World Bank (2019).Footnote10 We obtained the requisite financial and market data for these companies from the Standard & Poor’s Xpressfeed database. We used data for fiscal years between 1994 and 2018 because that database is sparsely populated before 1994, especially for international companies.
For each year, we included companies that reported the required financial data (described later) for an annual financial reporting period that ended during that year. For our value-relevance tests, we used stock price data up to the end of 2019. We retained small and loss-making companies in our sample because prior research (Darrough and Ye 2007; Collins et al. 1997; Joos and Plesko 2005) indicated that such companies are often persistently unprofitable entities that tend to invest more heavily in R&D activities that create intangible capital than do larger and profitable companies.
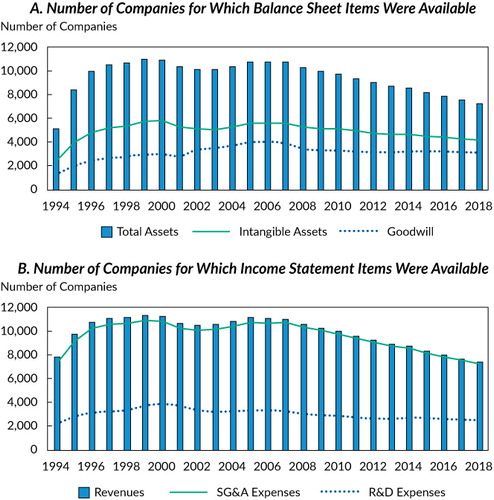
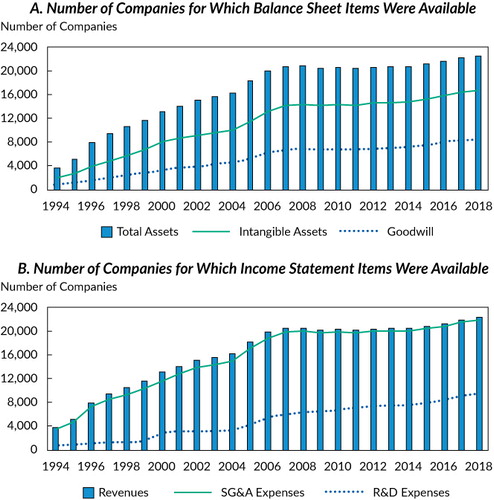
For each company, we computed three metrics of intangible intensity: Footnote11(1) total intangible assets, excluding goodwill, relative to total assets, (2) R&D expenses relative to total revenues, and (3) SG&A expenses relative to total revenues. Footnote12 and in Appendix A show changes in the data availability for these metrics over time in, respectively, the US universe and international universe. Because the first of our three intangibility metrics is derived from balance sheet items and the other two from income statement items, the presentations in and are structured accordingly.
Except for some narrowly focused studies in Australia and the United Kingdom, past research on this topic has focused on US companies, so our work adds to this literature by reporting on the relative availability of data to construct the aforementioned three metrics of intangible intensity in both the United States and 14 other countries. Footnote13 Note that on average, the information required to compute capitalized intangible assets was available for 52% (67%) of the companies in the US (international) universe that reported total assets and 33% (32%) of all US (international) companies that disclosed information about goodwill. SG&A expenses were available for 97% (95%) of US (international) companies; data on R&D expenses were available for 31% (30%) of US (international) companies that reported total revenues.Footnote14
Most of the previous work on this subject has focused on specific types of intangible capital (primarily, innovation capital created by R&D activities) one at a time. A drawback of such univariate approaches is that innovation capital dominates in certain industries, such as pharmaceuticals, because it is widespread and of large magnitude, but in other industries, different types of intangible capital may be more significant and value relevant than R&D. Investors who prefer to hold broadly diversified portfolios rather than a narrow selection of companies from specific industries can gain comprehensive insights about the effects of intangible capital investment by using our intangible-intensity composite to make investment decisions for all types of companies. By aggregating the impact of the main types of intangible capital that the literature has linked to stock prices and returns, the composite enables investors to classify and compare companies belonging to different industries on common ground.Footnote15 We expected the availability of financial data for computation of each of our three intangible capital metrics to vary according to the nature of a company’s business, which might, in turn, depend on its industry membership. Footnote16
For every year during our sample period, we computed the median intangible intensity for all companies within each of 21 four-digit GICS industry groups (which excludes Banks, Insurance, and Diversified Financials) for each of our three intangible-intensity metrics. Next, we ranked the 21 industries annually according to median intangible intensity, measured independently for each of the three metrics. Finally, we combined every industry’s annual rank on the three intangible-intensity metrics to obtain its equally weighted composite intangible-intensity rank for that year. Footnote17 Thus, we calculated a set of 21 annual composite intangible industry ranks for each of the 25 years in our sample period.
Applying this procedure independently to the US and international universes, we obtained two sets of ranks. In , we present the 25-year average composite intensity rank of each industry for the two investment universes. We used these average composite ranks to classify the 10 lowest-ranked industries into the “ low-intangible-intensity category” and the remaining 11 industries into the “high-intangible-intensity category.” The order of industries that resulted is remarkably similar for the two universes. Indeed, except for two differences (Energy and Retailing), the set of high- and low-intangible-intensity industries in the United States and abroad is identical.
Table 1. Average Composite Intangible-Intensity Ranks, 1994–2018
To evaluate the consistency of the US and international composite intangible-intensity rankings, we calculated and present in the Kendall’s coefficient of concordance—a W-statistic with a χ2 distribution (Zar 1999)—for each of the 25 years in our sample.Footnote18 Note that for all years, the W-statistics are highly significant. When we divided our 25-year study period into two subsamples, 1994–2006 and 2007–2018, we found similar results for the two subperiods that were also consistent with the full-sample results. For investors, the implication of the findings reported in is that the composite measure of intangible intensity that we propose is built on pervasive intangibility metrics. The composite can be used to classify industries by their intangible intensity in the United States and internationally in a similar fashion—an important consideration for investors who wish to use the composite to construct global investment strategies or compare factor performance among investment universes.
Table 2. Consistency of US and International Composite Intangible-Intensity Ranks, 1994–2018
In addition to assessing cross-universe consistency, we also evaluated the consistency of the annual intangible-intensity ranks across industries over time within each investment universe for each of the three intangible-intensity metrics and for the intangible-intensity composite. We, again, relied on Kendall’s concordance statistic to compare the relative annual intangible-intensity ranks for the 21 industries over the 25-year sample period (with slight exceptions for the intensity of R&D expenses because sufficient data were lacking for certain industries in early years). The results, provided in , show that for each of three types of intangible capital and for the intangible-intensity composite, relative industry ranks have remained stable over time at a statistical level of confidence exceeding 99%. Because the pace of evolution of intangible intensity among industries and various types of intangible capital varies, this finding is important. The time-series persistence of our composite measure of intangible intensity provides assurance that investment strategies based on the choice or weighting of factors that drive investment returns according to intangible intensity are likely to be stable and replicable.
Table 3. Consistency of Intangible-Intensity Ranks over Time, 1994–2018
Combined Value Relevance of Book Value and Earnings
We used our composite intangible-intensity measure to study the effect of investments in intangible capital on the value relevance of book value and earnings, which are often used to construct valuation ratios, as well as other financial metrics that investors use to evaluate the profitability, quality, growth, and risk characteristics of companies. Prior studies of this issue have defined intangible intensity in an ad hoc manner, typically with a focus on intangible innovation capital created by R&D and ignoring the identifiable intangible assets reported on the balance sheet. The reason is that most previous researchers adopted the following definition of intangible intensity, which was initially proposed by Collins et al. (1997, p. 51, footnote 16):
Note that intangible intensity does not refer to the presence of large amounts of recorded intangibles because the concerns raised in the literature relate more to unrecorded intangibles. Consequently, we define companies as intangible intensive when their production functions likely contain large amounts of unrecorded intangibles. We recognize that any such classification is somewhat ad hoc. We define intangible intensive as being companies in the two-digit SIC codes 48 (electronic components and accessories), 73 (business services), and 87 (engineering, accounting, R&D and management related services) and three-digit SIC codes 282 (plastics and synthetic materials), 283 (drugs), and 357 (computer and office equipment).
Since the time of the Collins et al. (1997) study, however, the relative importance of other types of intangible capital, especially organization capital, has grown and additional intangible-intensive industries, such as Media & Entertainment, with new types of intangible capital, like subscriber lists, have emerged. Moreover, as Lev and Gu (2016) showed, corporate investment in intangible assets has increased so much faster than the investment in tangible assets that since the mid-1990s, it has overtaken investment in tangible assets. As discussed in the section “Data and Methodology,” ignoring intangibles already recorded on the balance sheet may produce a misleading or inconsistent intangible intensity–based classification of industries. Therefore, ranking and classifying industries by a broader set of intangible-intensity metrics is warranted. Doing so may lead to conclusions that differ from prior work about interindustry variations in the combined value relevance of book value and earnings.
Oddly, the limited international research in this area has also relied on the Collins et al. (1997) categorization of intangible-intensive industries, although the system was initially conceived for the US universe. Hence, the implications of using our proposed composite intangible-intensity measure to study the effects of intangible intensity on the value relevance of book value and earnings in the international universe are unknown and deserve investigation.
Following previous research, we used regression analysis to investigate the impact of intangible intensity on the value relevance of earnings and book value. For each investment universe, we regressed contemporaneous share price on net income per share and book value per share for companies in each intangible-intensity category (based on the ranks of industry groups in ). For all sample companies, we obtained book values, net income, and the outstanding number of shares for each fiscal year between 1994 and 2018. We also extracted, using the filing dates for the reports provided by Xpressfeed, the month-end share price for the month in which the financial report containing book value and net income became publicly available. To match book value and net income with contemporaneous share prices, we excluded observations for which the month-end date of the share price was more than six months beyond the end of the annual fiscal period covered by the financial report.
We estimated all regressions annually and computed the R2 values for each regression; higher R2 values denote more combined value relevance for net income and book value. We made the following hypotheses: (1) If investments in intangible capital affect the value relevance of financial statements of companies in the high-intangible-intensity group more unfavorably than in the low-intangible-intensity group, the combined R2 of book value and earnings should be lower for the high-intangible-intensity group, and (2) if the adverse effect of intangible capital investment on the value relevance of earnings and book value for high-intangible-intensity companies has intensified over time, regression R2 values for that group should be shown to decline gradually over time and should slide below that for the low-intangible-intensity group.
The R2 values obtained from our annual regressions are plotted in for the US universe and for the international universe, where the dashed lines are the linear trends. These data tend to support our hypothesis, although the inference is weaker for US companies than for international companies.
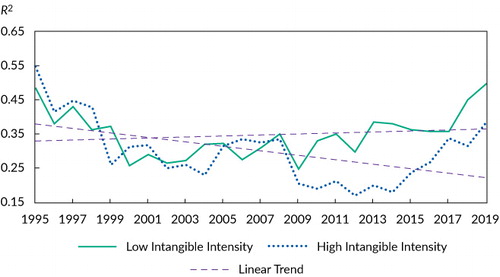
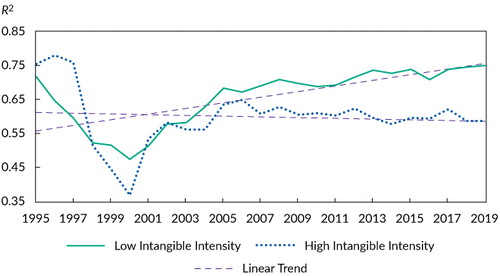
Overall, our findings are consistent with the results of comparable analyses conducted by Ciftci et al. (2014) and Core et al. (2003) for US companies. First, in and , we detect a declining linear trend for the value relevance of earnings and book value among companies in the high-intangible-intensity group in both the US and international universes over the sample period. Second, we note a sharp drop in the value relevance of these financial variables for both groups during the 1995–99 so-called New Economy period in both investment universes.Footnote19 Thus, our objective and comprehensive methodology for classifying industries into low- or high-intangible-intensity categories leads to conclusions that are comparable to the conclusions from previous research for companies in the United States. As for the international universe, we believe our study is the first to document that similar relationships exist between intangible intensity and the value relevance of earnings and book values for international companies.
Nevertheless, we also note some differences in results from analogous past research on US companies. indicates that the value relevance of book value and earnings for companies in the low-intangible-intensity group increased from 2009 on; this relatively recent period was not included in the Ciftci et al. (2014) and Core et al. (2003) studies. For companies in the high-intangible-intensity group, a similar upswing is visible beginning in 2014.
To evaluate the statistical significance of the change in R2 values over time, we conducted two types of tests. First, to determine the trend of annual R2 values, we computed the Theil–Sen Footnote20 slope of each of the four sets of 25 (for each year) R2 values (i.e., for the two intangible-intensity groups in each investment universe) and the related z-statistic for each slope estimate. These results are reported in .
Table 4. Trend of R2 Values from Regressions of Share Price on Book Value per Share and Net Income per Share, 1995–2019
For the US universe, shows that the trend was strongly negative and statistically significant for the high-intangible-intensity group and slightly positive but insignificant for the low-intangible-intensity group. The 95% confidence intervals for the two trend estimates do overlap slightly. Footnote21 Taken together, these findings imply that in the United States, the combined value relevance of book value and earnings has decreased over time for companies in the high-intangible-intensity group but this decrease has not occurred for companies in the low-intangible-intensity group. From , a clear divergence in value relevance for high- and low-intangible-intensity industries is evident in the US universe after 2008, but the magnitude of the difference between the two groups fluctuates over time.
For the international universe, the z-statistic for the trend of the combined value relevance of earnings and book value is negative but statistically insignificant for the high-intangible-intensity group but positive and significant for the low-intangible-intensity group. Furthermore, note that the 95% confidence intervals for the trend of R2 values for the high- and low-intangible-intensity groups do not overlap.Footnote22 The nonoverlapping confidence intervals allow us to infer that the difference between the slight downward trend for the high-intangible-intensity group and the upward trend for the low-intangible-intensity group is statistically meaningful.
The R2 values for the international universe plotted in show a steady decline beginning in 2006 in the combined value relevance of book values and earnings for the high-intangible-intensity companies but a gradual increase in value relevance for low-intangible-intensity companies. This increasing divergence between the two groups for international companies may be the result of standardization of accounting policies governing the capitalization of intangibles after the widespread adoption of IFRS in 2005. In the pre-IFRS period, legacy accounting standards in several countries—notably, Australia, France, and the United Kingdom—permitted both capitalization and expensing of the costs incurred to create intangible capital assets. Goodwin and Ahmed (2006) and Oswald, Simpson, and Zarowin (2017) provided evidence that in the more permissive pre-IFRS regime, capitalization was informative to investors for companies that were intangible intensive. IFRS adoption compelled international companies to hew more closely to US accounting provisions, which tend to prohibit capitalization of intangibles. Scaling back the capitalization option may have caused the informativeness of book value and earnings to drop after implementation of IFRS, especially for highly intangible intensive international companies.
and also highlight the differences between the high- and low-intangible-intensity groups in how the combined value relevance of book value and earnings changed during and immediately after the New Economy period. For both US and international companies, the value relevance of book value and earnings fell more sharply for high-intangible-intensity industries than low-intangible-intensity industries during the dot-com bubble of 1995–1999, but as noted by Core et al. (2003) and Ciftci et al. (2014), the cause may have been temporary overoptimism about companies that represented the New Economy. Furthermore, for international companies, the extraordinary increase in intangible investment in the mid- and late 1990s seems to have reversed course in 2000, leading to a correspondingly greater rebound in value relevance of book value and earnings for high-intangible-intensity industries. For US companies, the period of excessive optimism seems to have been longer, the decline in value relevance more gradual, and the subsequent rebound more muted and occurring over a shorter period.
To gain assurance that these empirical findings were not driven by a few industries in either of the two intangible-intensity groups or by systematic interindustry differences in the relationship between the fundamental financial variables and stock prices, we conducted an additional test. We regressed the contemporaneous share price on net income per share and book value per share for companies in each of the 21 industries and estimated the time trend of the 25 annual R2 values for each industry. For each investment universe, we then calculated the correlation between the 21 industry time trends and the corresponding 25-year average composite intangible intensities for the 21 industries. We found that for the US (international) universe, the correlation between the time trend of R2 values and composite intangible intensity across all 21 industries was –0.59 (–0.62). Both correlations are significant at the 99% level of confidence. They confirm the existence of a strong negative relationship between intangible intensity and the value relevance of book value and earnings for industries around the world.
In addition to analyzing the trend of R2 values for each intangible-intensity group, we used the methodology in Ciftci et al. (2014) to test for differences in the combined value relevance of book value and earnings between the high- and low-intangible-intensity groups. For each investment universe, we estimated the following panel regression of the 25 annual R2 values for both intangible-intensity groups together. We used dummy variables to designate time, intangible intensity, and the interaction of time and intangible intensity, and we included certain scale control variables.
The regression was(1) where
= the R2 for the regression of share
price on earnings and book value for each year, t, and intensity
group, g
TIME = a variable with values between 1 and 25 depending on the year of the regression
= a variable with the value of 1 if the R2
was for an observation in the high-intangible-intensity group and 0 otherwise
= the value of
multiplied by TIME
= the coefficient of variation of share price for each year
and intensity group
= the coefficient of variation of book value per share for each
year and intensity group
= the regression error for each year and intensity group
Ciftci et al. (2014) and Brown, Lo, and Lys (1999) emphasized that R2 values are not comparable across regressions conducted on subsamples of companies because of differences in scale. To control for such differences, they recommended that certain additional independent variables be included when combining or comparing regression results for different samples of companies or time periods. In fact, Ciftci et al.’s replication of the Collins et al. (1997) study that included controls for differences in scale led to conclusions about changes in the value relevance of book value and earnings over time that were opposite to those of Collins et al. Therefore, we included the two independent scale control variables in our panel regressions, the coefficient of variation of share price and the coefficient of variation of book value per share, as suggested by Brown et al. Our results for regressions that did not include the scale control variables (not reported for brevity) are, however, qualitatively similar.
Regression results for both the US and international universes are reported
in . The coefficient
b3 for the variable is of particular interest because it captures the difference
in slopes between the low- and high-intangible-intensity groups. For both the US
and the international universes, this regression coefficient is negative and
statistically significant, at confidence levels exceeding, respectively, 99% and
93%. This finding indicates that for US and international companies, the slope
of R2 values representing the combined efficacy of
book value and earnings in explaining contemporaneous share prices has been dropping
over time for the high-intangible-intensity group relative to the
low-intangible-intensity group.Footnote23
This trend is visually depicted in
and and confirms our previous
analysis of the nonparametric trend of R2
values.Footnote24
Table 5. Trend of R2 Values from Regression of Share Price on Book Value per Share and Net Income per Share, 1995–2019
Finally, from and , we also conclude that the declining linear trend of the (combined) value relevance of book value and earnings for high-intangible-intensity companies has been slightly greater in the United States than internationally. Over the full period of our study, the R2 of the regression fell by about 30% (from 0.55 to 0.385) for the high-intangible-intensity group of US companies as opposed to a 22% drop (from 0.75 to 0.585) for the high-intangible-intensity group of international companies.
To our knowledge, the findings we report here for international companies constitute a new contribution to the literature because no past studies have examined how intangible intensity affects the relationship between financial statement variables and stock prices in multiple countries.
Conclusions
Earnings and book value are of interest to investors because these variables underlie two corresponding valuation ratios—earnings to price and book to price—that are the basis of popular value investing and other types of investment strategies based on the profitability, quality, growth, and risk characteristics of companies. However, the efficacy of value-investing strategies has fallen precipitously in recent years. A possible reason is that the volume and variety of corporate expenditures on activities that create intangible capital have increased, albeit unevenly, over time and for different industries but financial reporting standards did not accommodate such structural economic changes. Our primary conclusion is that intangible capital intensity is, in fact, related to changes in the value relevance of earnings and book value, as reflected in the power of these financial variables to explain contemporaneous movements and cross-sectional variation in stock price in the 1994–2019 time period for the companies in our global sample.
To investigate the value relevance of earnings and book value, we proposed and validated a composite measure of intangible intensity that captures the financial statement impact of three types of intangible capital: intangible assets reported on the balance sheet (excluding goodwill), innovation capital created by R&D expenditures, and organization capital resulting from SG&A expenses. We first showed that our composite intangible-intensity measure is consistent over time and across the US and international investment universes in its ability to rank and classify industries by their intangible intensity. We then analyzed the contemporaneous relationship between stock price and the two financial variables of interest, book value per share and net income per share, for US and non-US companies. We formed these subsamples on the basis of the intangible intensity of the industry to which the companies belong. As we hypothesized, we did find a decline in the combined value relevance of earnings and book value of companies in the high-intangible-intensity group in both the US and international universes, but we did not find such a decline for companies in the low-intangible-intensity group.
Our approach to this issue differs from that of Arnott et al. (2021), Amenc et al. (2020), and Li (2020), who attempted to adjust book values for the impact of unaccounted intangible capital, and from that of Angelopoulos et al. (2012), who estimated industry-relative intangible intensity for companies in each industry. Although such methods can compensate for biases in valuation metrics that result from inadequate accounting of intangible capital, company-level estimates of intangible capital may be volatile and fraught with measurement error. The industry-level methodology for gauging intangible intensity that we used in this study can mitigate both problems. Moreover, industry-level measures of intangible intensity can capture macroeconomic aspects of intangible intensity—such as industry concentration (see Crouzet and Eberly 2019) and product/market competition (see Gu 2016)—that industry-relative estimates of the intangible intensity of individual companies are unable to incorporate. Nevertheless, we acknowledge that all these alternatives are imperfect ways to address this important but complex issue.
Our conclusions held for both US and international companies in the largest 14 economies of the world. Importantly, our conclusions about the impact of intangible intensity on the value relevance of earnings and book value are stronger for international companies, in that the divergence between the low- and high-intangible-intensity groups of industries is greater in the international arena and has continued to increase over time. For investors who aim to build and use value investing or other types of strategies that rely on book values and earnings, the implication is that such strategies may benefit from taking variations in intangible intensity into account. Our primary objective in this study, however, was to measure intangible intensity and establish that it is relevant for investors as a step toward building a robust and consistent investment framework. Therefore, we did not attempt to investigate whether value investors can enhance the return prediction ability of their valuation models or whether equity investors in general can improve their assessments of the profitability, quality, growth, and risk of companies by accounting for cross-sectional variations in intangible intensity. We leave these issues to future research.
The authors gratefully acknowledge the suggestions of Executive Editor Stephen J. Brown and Co-Editor Steven Thorley, CFA. They also thank their colleagues at Bridgeway Capital Management, especially Andrew Berkin (head of research) for his guidance and encouragement and other members of the investment management team for helpful comments.
Notes
1 The mismatch may be more acute for business entities that are in the early stages of their life cycle, when spending on activities that create intangible assets (e.g., research and development or customer acquisition) is high.
2 In addition to net income and book value, they studied cash flow from operations, cash, total assets, intangible assets, sales, sales growth, R&D expenses, advertising expenses, cost of goods sold, capital expenditures, other comprehensive income, and special items.
3 Intangible capital items may include computerized information, innovation (including both scientific R&D and nonscientific discovery and development; Corrado, Hulten, and Sichel 2005), human resources (Pantzalis and Park 2009), organizational competencies (Lev and Radhakrishnan 2005), customer franchises (Bonacchi, Kolev, and Lev 2015), and brand values (Barth, Clement, Foster, and Kasznik 1998).
4 Li (2020) argued and showed that, at least in developed international markets, book value can be successfully adjusted without relying on the complex procedures suggested by Peters and Taylor (2017).
5 Of the 236,008 (411,330) company-year observations in our US (international) sample for which ubiquitous financial statement items, such as total assets, were available in the Xpressfeed database, 63,602 (46,160) company-year observations were for companies in the Banks, Insurance, and Diversified Financials industry groups.
6 In a pre-IFRS reporting regime, certain countries (including Australia, the United Kingdom, and France) permitted both expensing and capitalization of R&D expenditures. Oswald, Simpson, and Zarowin (2017) found differences in (1) the value relevance of the capitalized versus expensed development costs in a pre-IFRS regime and (2) changes in the value relevance of R&D expenditures before and after IFRS adoption for UK companies that switched from expensing to capitalization. Jaafar (2011) showed that the adoption of Australian-equivalent IFRS led to an increase in the value relevance of identifiable intangible assets.
7 For example, Lee and Lee (2020) stated that prior to 1999 in South Korea, R&D expenditures were classified as either ordinary or extraordinary depending on the characteristics of the activities; R&D expenditures that occurred in the ordinary course of business were expensed, whereas those not meeting this criterion were capitalized.
8 Most prior studies on this subject (e.g., Bublitz and Ettredge 1989) have shown that the life of brand value assets created by advertising expenditures is no more than one to two years.
9 In unreported results, we found that for our sample of US companies, advertising expenditures dropped from about 3.6% to 1.6% of total revenues while R&D expenditures rose from about 9.5% to more than 14.0% in the 1994–2018 period.
10 In descending order of GDP, the top 15 countries in the world are the United States, China, Japan, Germany, the United Kingdom, France, India, Italy, Brazil, Canada, Russia, South Korea, Australia, Spain, and Mexico. The complete list by GDP ranking is available from the World Bank (2019).
11 Xpressfeed reports R&D expenses and SG&A expenses as separate components of the income statement item under “Other Operating Expenses.” Our three metrics had to have nonnegative values, and their intensity could not be computed if the scaling variable (total assets or total revenues) was missing or zero. Such cases (amounting to fewer than 0.4% of all available company-year observations) were treated as data errors and excluded from our sample.
12 Relative rankings for intangible intensity based on alternative measures (total assets or total expenses) to scale R&D expenses and SG&A expenses were similar and are not reported here for brevity.
13 in Appendix A provides some summary information about the availability of such data separately for developed and emerging countries.
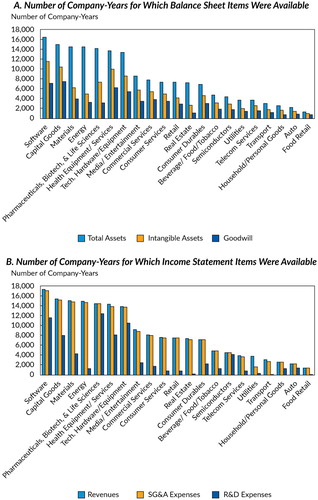
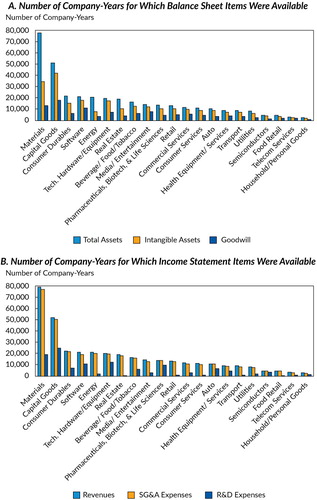
14 In light of our focus on interindustry differences in intangible intensity, we provide, in and in Appendix A, information about the availability of the requisite data at the industry level for, respectively, the United States and other countries.
15 We recognize that this approach is imperfect. Within the four-digit GICS classifications that we used, intangible intensity can vary at the subindustry level; for example, within the Utilities sector, the wind and solar power sectors are likely to differ from those that rely on fossil fuels and nuclear energy. A more granular industry classification approach would yield additional insights but would come at the expense of reduced sample sizes at the industry level.
16 and confirm this conjecture.
17 We acknowledge that our assumption that all sources of intangible capital are equally important contributors to intangible intensity is subjective. The three metrics of intangible capital have different useful lives, and they differ in the amount and timing of the cash flows they generate. Accurate measurement of these attributes would enable assignment of more appropriate (unequal) weights to different sources of intangible capital.
18 We required at least three companies in an industry for estimation of the median intangible intensity, and we required that intangible intensity medians for at least two of the three metrics be available for computation of the composite intangible intensity in any year.
19 According to Core et al. (2003), this period was marked by several unusual economic developments, including high stock market returns, high valuations, and increased productivity driven by the declining price of computing power and investments in information technology and modern manufacturing facilities that benefit from information technology.
20 The Theil–Sen estimator (Theil 1950; Sen 1968) is a nonparametric technique for estimating a linear trend by choosing the median of the slopes of all lines through pairs of points in the sample. This procedure produces a (statistically) efficient estimator that is insensitive to outliers. It can be significantly more accurate than a nonrobust simple linear (least-squares) regression for skewed and heteroskedastic data.
21 For the US universe, the 95% confidence intervals for, respectively, the high- and low-intangible-intensity groups are (–0.011, 0.000) and (–0.002, 0.007). For the international universe, the 95% confidence intervals are (–0.005, 0.004) and (0.005, 0.012).
22 See previous note.
23 We repeated the analyses in
and for a full
“global” sample of companies. For this test, we combined
US and international companies in the high-intangible-intensity groups,
added an indicator variable to distinguish whether a particular company
belonged to the US or international universe, and ran our primary annual
cross-sectional regression of stock price on book value and earnings for
this “global” sample of high-intangible-intensity companies.
We obtained 25 R2 values. We repeated the same
procedure for the low-intangible-intensity companies. The
Theil–Sen’s slopes (z-statistics) for the
high- and low-intangible-intensity groups were, respectively, –0.00
(0.26) and 0.007 (3.10), and the coefficient (t-statistic)
for was –0.007 (–3.49).
24 The coefficient on the TIME variable is positive and significant for both the US and international regressions, indicating that the combined value relevance of earnings and book value has increased for companies in the low-intangible-intensity group for the time period and sample of companies included in our study.
References
- Aboody, David, and Baruch Lev. 1998. “The Value Relevance of Intangibles: The Case of Software Capitalization.” Journal of Accounting Research, vol. 36 (Supplement: Studies on Enhancing the Financial Reporting Model): 161–91 https://doi.org/10.2307/2491312.
- Ahmed, Kamran, and Haim Falk. 2006. “The Value Relevance of Management’s Research and Development Reporting Choice: Evidence from Australia.” Journal of Accounting and Public Policy, vol. 25, no. 3: 231–64 https://doi.org/10.1016/j.jaccpubpol.2006.03.002.
- Amenc, Noel, Felix Goltz, and B. Luyten. 2020. “Intangible Capital and the Value Factor: Has Your Value Definition Just Expired?” Journal of Portfolio Management, vol. 46, no. 7: 83–99 https://doi.org/10.3905/jpm.2020.1.161.
- Angelopoulos, Georgios, Daniel Giamouridis, and Orestes Vlismas. 2012. “Inferring the Value of Intangible Assets.” Working paper (1 March). Available at https://ssrn.com/abstract=1786285. https://doi.org/10.2139/ssrn.1786285.
- Arnott, R. D., C. R. Harvey, V. Kalesnik, and J. T. Linnainmaa. 2021. “Reports of Value’s Death May Be Greatly Exaggerated.” Financial Analysts Journal, vol. 77, no. 1: 44–67.
- Barth, Mary, Michael B. Clement, George Foster, and Ron Kasznik. 1998. “Brand Values and Capital Market Valuation.” Review of Accounting Studies, vol. 3, no. 1-2: 41–68 https://doi.org/10.1023/A:1009620132177.
- Barth, Mary E., Ken Li, and Charles G. McClure. 2018. “Evolution in Value Relevance of Accounting Information.” Working paper, Stanford Graduate School of Business (May).
- Bonacchi, Massimiliano, Kalin Kolev, and Baruch Lev. 2015. “Customer Franchise—A Hidden, Yet Crucial, Asset.” Contemporary Accounting Research, vol. 32, no. 3: 1024–49 https://doi.org/10.1111/1911-3846.12095.
- Brown, S., K. Lo, and T. Lys. 1999. “Use of R2 in Accounting Research: Measuring Changes in Value Relevance over the Last Four Decades.” Journal of Accounting and Economics, vol. 28, no. 2: 83–115 https://doi.org/10.1016/S0165-4101(99)00023-3.
- Bublitz, B., and M. Ettredge. 1989. “The Information in Discretionary Outlays: Advertising, Research and Development.” Accounting Review, vol. 64, no. 1: 108–24.
- Ciftci, Mustafa, Masako Darrough, and Raj Mashruwala. 2014. “Value Relevance of Accounting Information for Intangible-Intensive Industries and the Impact of Scale: The US Evidence.” European Accounting Review, vol. 23, no. 2: 199–226 https://doi.org/10.1080/09638180.2013.815124.
- Collins, Daniel W., Edward L. Maydew, and Ira S. Weiss. 1997. “Changes in the Value-Relevance of Earnings and Book Values over the Past Forty Years.” Journal of Accounting and Economics, vol. 24, no. 1: 39–67 https://doi.org/10.1016/S0165-4101(97)00015-3.
- Core, John E., Wayne R. Guay, and Andrew Van Buskirk. 2003. “Market Valuations in the New Economy: An Investigation of What Has Changed.” Journal of Accounting and Economics, vol. 34, no. 1-3: 43–67 https://doi.org/10.1016/S0165-4101(02)00087-3.
- Corrado, C. A., C. R. Hulten, and D. Sichel. 2005. “Measuring Capital and Technology: An Expanded Framework.” In Measuring Capital in a New Economy edited byHaltiwanger, John C., Carol Corrado, and Daniel E. Sichel: 11–45Chicago: University of Chicago Press https://doi.org/10.7208/chicago/9780226116174.003.0002.
- Crouzet, Nicolas, and Janice C. Eberly. 2019. “Understanding Weak Capital Investment: The Role of Market Concentration and Intangibles.” NBER Working Paper 25869 (May) https://doi.org/10.3386/w25869.
- Dahmash, Firas N., Robert B. Durand, and John Watson. 2009. “The Value Relevance and Reliability of Reported Goodwill and Identifiable Intangible Assets.” British Accounting Review, vol. 41, no. 2: 120–37 https://doi.org/10.1016/j.bar.2009.03.002.
- Darrough, Masako, and Jianming Ye. 2007. “Valuation of Loss Firms in a Knowledge-Based Economy.” Review of Accounting Studies, vol. 12, no. 1: 61–93 https://doi.org/10.1007/s11142-006-9022-z.
- Edmans, Alex. 2011. “Does the Stock Market Fully Value Intangibles? Employee Satisfaction and Equity Prices.” Journal of Financial Economics, vol. 101, no. 3: 621–40 https://doi.org/10.1016/j.jfineco.2011.03.021.
- Eisfeldt, Andrea L., and Dimitris Papanikolaou. 2013. “Organization Capital and the Cross-Section of Expected Returns.” Journal of Finance, vol. 68, no. 4: 1365–406 https://doi.org/10.1111/jofi.12034.
- Fraser, Ian, Heather Tarbert, and Kai Hong Tee. 2009. “Do the Financial Statements of Intangible-Intensive Companies Hold Less Information Content for Investors.” Applied Financial Economics, vol. 19, no. 17: 1433–38 https://doi.org/10.1080/09603100902902212.
- Goodwin, John, and Kamran Ahmed. 2006. “Longitudinal Value Relevance of Earnings and Intangible Assets: Evidence from Australian Firms.” Journal of International Accounting, Auditing and Taxation, vol. 15, no. 1: 72–91 https://doi.org/10.1016/j.intaccaudtax.2006.01.005.
- Govindarajan, Vijay, Shivaram Rajgopal, Anup Srivastava, and Ye Wang. 2019. ““R&D Spending Has Dramatically Surpassed Advertising Spending.” Harvard Business Review20 (May) https://hbr.org/2019/05/rd-spending-has-dramatically-surpassed-advertising-spending .
- Gu, Lifeng. 2016. “Product Market Competition, R&D Investment, and Stock Returns.” Journal of Financial Economics, vol. 119, no. 2: 441–55 https://doi.org/10.1016/j.jfineco.2015.09.008.
- Israel, R., K. Laursen, and Scott A. Richardson. 2020. “Is (Systematic) Value Investing Dead.” Working paper, AQR Capital Management (8 May).
- Jaafar, Hartini. 2011. “Accounting for Intangible Assets, Firm Life Cycle and the Value Relevance of Intangible Assets.” Doctoral dissertation, University of Tasmania.
- Joos, Peter, and George A. Plesko. 2005. “Valuing Loss Firms.” Accounting Review, vol. 80, no. 3: 847–70 https://doi.org/10.2308/accr.2005.80.3.847.
- Lee, Jangwook, and Jiyoon Lee. 2020. “Mispricing or Risk Premium? An Explanation of the R&D-to-Market Anomaly.” Working paper (7 October). Available at https://ssrn.com/abstract=3706541 .
- Lev, Baruch, and Feng Gu. 2016. The End of Accounting and the Path Forward for Investors and Managers. Hoboken, NJ:: John Wiley & Sons https://doi.org/10.1002/9781119270041.
- Lev, Baruch, and S. Radhakrishnan. 2005. “The Valuation of Organization Capital.” In Measuring Capital in a New Economy edited byHaltiwanger, John C., Carol Corrado, and Daniel E. Sichel: 73–99Chicago: University of Chicago Press.
- Lev, Baruch, and Theodore Sougiannis. 1996. “The Capitalization, Amortization, and Value Relevance of R&D Outlays.” Journal of Accounting and Economics, vol. 21, no. 1: 107–38 https://doi.org/10.1016/0165-4101(95)00410-6.
- Lev, Baruch, and Anup Srivastava. 2019. “Explaining the Demise of Value Investing.” Working paper, NYU Stern School of Business (25 October) https://doi.org/10.2139/ssrn.3442539.
- Li, Feifei. 2020. “Intangibles: The Missing Ingredient in Book Value.” Working paper, Research Affiliates (2 November). Available at https://ssrn.com/abstract=3686595. https://doi.org/10.2139/ssrn.3686595.
- Ohlson, J. A.. 1995. “Earnings, Book Values and Dividends in Equity Valuation.” Contemporary Accounting Research, vol. 11, no. 2: 661–87 https://doi.org/10.1111/j.1911-3846.1995.tb00461.x.
- Oliveira, Lídia, Lúcia L. Rodrigues, and Russell Craig. 2010. “Intangible Assets and Value Relevance: Evidence from the Portuguese Stock Exchange.” British Accounting Review, vol. 42, no. 4: 241–52 https://doi.org/10.1016/j.bar.2010.08.001.
- Oswald, Dennis, Ana Simpson, and Paul Zarowin. 2017. “The Information Benefits of R&D Capitalization.” Working paper (13 April). Available at https://ssrn.com/abstract=2952388. https://doi.org/10.2139/ssrn.2952388.
- Pantzalis, C., and J. C. Park. 2009. “Equity Market Valuation of Human Capital and Stock Returns.” Journal of Banking & Finance, vol. 33, no. 9: 1610–23 https://doi.org/10.1016/j.jbankfin.2009.03.008.
- Peters, R., and L. Taylor. 2017. “Intangible Capital and the Investment-q Relation.” Journal of Financial Economics, vol. 123, no. 2: 251–72 https://doi.org/10.1016/j.jfineco.2016.03.011.
- Ritter, A., and A. Wells. 2006. “Identifiable Intangible Asset Disclosures, Stock Prices and Future Earnings.” Accounting and Finance, vol. 46, no. 5: 843–63 https://doi.org/10.1111/j.1467-629X.2006.00190.x.
- Sen, Pranab Kumar. 1968. “Estimates of the Regression Coefficient Based on Kendall’s Tau.” Journal of the American Statistical Association, vol. 63, no. 324: 1379–89 https://doi.org/10.1080/01621459.1968.10480934.
- Shah, Syed Zulfiqar Ali, and Saeed Akbar. 2008. “Value Relevance of Advertising Expenditure: A Review of the Literature.” International Journal of Management Reviews, vol. 10, no. 4: 303–25.
- Shah, Syed Zulfiqar Ali, Andrew Stark, and Saeed Akbar. 2009. “The Value Relevance of Major Media Advertising Expenditures: Some U.K. Evidence.” International Journal of Accounting, vol. 44, no. 2: 187–206 https://doi.org/10.1016/j.intacc.2009.03.004.
- Silva, Rita A.. 2012. “Equity Valuation Using Accounting Numbers in High and Low Intangible-Intensive Industries.” Dissertation, Católica Lisbon School of Business and Economics, Lisbon, Portugal.
- Smith, Dean T., Majella Percy, and Gordon D. Richardson. 2001. “Discretionary Capitalization of R&D: Evidence on the Usefulness in an Australian and Canadian Context.” Advances in International Accounting, vol. 14: 15–46 https://doi.org/10.1016/S0897-3660(01)14004-3.
- Theil, H.. 1950. “A Rank-Invariant Method of Linear and Polynomial Regression Analysis. I, II, III.” Proceedings of the Nederl Akad Wetensch Indag Math, vol. 53: 386–92: 521–25: 1397–412.
- Tronconi, Claudia, and Giuseppe Vittucci Marzetti. 2011. “Organization Capital and Firm Performance. Empirical Evidence for European Firms.” Economics Letters, vol. 112, no. 2: 141–43 https://doi.org/10.1016/j.econlet.2011.04.004.
- World Bank2019. “Data Catalog: 2018 GDP Ranking.” https://datacatalog.worldbank.org/dataset/gdp-ranking Accessed 17 December 2019.
- Zar, J. H.. 1999. Biostatistical AnalysisFourth editionUpper Saddle River, NJ: Prentice-Hall.
- Zhao, Ronald. 2002. “Relative Value Relevance of R&D Reporting: An International Comparison.” Journal of International Financial Management and Accounting, vol. 13, no. 2: 153–74 https://doi.org/10.1111/1467-646X.00082.
Appendix A.
Details of Sample Data
Table A1. Availability of Data Items Required for Computation of Intangible-Intensity Metrics by Country, 1994–2018 (in company-year units)