
 ?Mathematical formulae have been encoded as MathML and are displayed in this HTML version using MathJax in order to improve their display. Uncheck the box to turn MathJax off. This feature requires Javascript. Click on a formula to zoom.
Abstract
Using simulated historical backtests, we study the impact of stock exclusions on the performance of passive and active portfolios. We find that at low to moderate numbers, stock exclusions have very little influence on passive portfolios. Their effects on active portfolios vary by the factor in consideration and the portfolio construction method, but the magnitudes are much smaller than suggested by the percentage of stocks being excluded. We find similar patterns with industry-concentrated exclusions. Overall, our results suggest that investors should feel comfortable excluding a fairly large number of stocks before experiencing any significant deterioration in their investment performance.
PL Credits: 2.0:
Introduction
Technological advancements coupled with lower trading costs have ushered in a new era of equity investing through direct indexing. The term “direct indexing” refers to a portfolio that directly holds the underlying stocks of a published index rather than owning a comingled index fund, such as a mutual fund or an exchange-traded fund (ETF). Initially introduced within larger separately managed accounts (SMAs), the recent enablement of trading fractional shares has allowed even smaller retail accounts to participate in direct indexing through large brokerages such as Schwab and Fidelity.
The benefits of directly owning a basket of stocks are not truly realized until one implements “personalized indexing” or custom portfolios, which is the next generation of direct indexing.Footnote1 Personalization allows individual investors to deviate, potentially materially, from the benchmark indices that direct indexing replicates. In theory, the degrees of customization are no less broad than for any equity portfolio being built from the ground up. In current practice, personalization typically enables investors the following selections: (1) tax loss harvesting (TLH) in taxable accounts, (2) factor enhancements with the intent of improving the portfolio’s return or risk characteristics, (3) socially responsible investing (SRI) restrictions, and (4) single-stock exclusions.
Three out of four of these areas of customization have a commonality. When enabled, they restrict a portfolio from owning individual stocks that it might have otherwise owned if unconstrained. The wash-sale rule restricts owning a stock for 30 days after harvesting a loss, assuming the investor seeks to capture the realized loss. Socially responsible investing restrictions prevent ownership of potentially large sets of stocks that meet certain predefined criteria. Single-stock exclusions allow investors to restrict ownership of individual names for regulatory reasons or due to personal preference.
What impact do such restrictions have on a portfolio’s expected performance? In terms of direction, it is hard to dispute the math and the associated intuition. A binding restriction prevents a portfolio from owning what it would have owned unrestricted. That cannot help in expectation. If the restriction does not bind (you would not have purchased the unrestricted stock anyway), then it will not hurt or have any impact whatsoever. Otherwise, the restriction’s expected impact is negative. Asness (Citation2017) vigorously articulates this case when disputing the claims many ESG portfolio managers make about their values-based restrictions not hurting and potentially even improving portfolio performance.
A binding restriction must hurt expected performance along some dimension (risk, return, or some other objective that a portfolio manager has chosen to optimize). But how bad is the hurt? Is it a papercut or a fatal wound? If one interprets the breadth parameter in Grinold’s (Citation1989) “fundamental law of active management” as the number of assets in the selection universe, then the exclusion percentage is directly proportional to the reduction in information ratio (IR) of the optimal active portfolio. However, Michaud, David, and Michaud (Citation2017) and Ding and Martin (Citation2017) argue that the formula for IR is too optimistic because it ignores many real-world investment issues and constraints. As a result, the theoretical prediction of the impact is probably also overstated. In this paper, we measure the effect of exclusions on long-only equity portfolios, both passive and active, in a simulated historical backtest environment. After randomly removing up to one-third of the individual stocks, or 16 out of 49 industries in total, from the investible universe, we construct passive portfolios and factor-based active portfolios using the remaining stocks. We generate 1,000 simulations and compare the outcomes with the unconstrained portfolios.
The results indicate that passive portfolios with up to 100 stocks restricted from holding are almost identical to the benchmark portfolio in return and risk profiles. Even at a 58-year horizon, the expected shortfall in terminal wealth multiple (TWM) under the bottom decile unlucky event is only 4%. The conclusion holds when excluded stocks are concentrated in the same industries.
Similarly, stock exclusions at low to modest numbers has little impact on long-only factor portfolios. Active investors can still achieve comparable levels of capital asset pricing model (CAPM) alpha and total investment returns with modest exclusions. At more extreme numbers, stock exclusions begin to negatively impact portfolio performance, but the magnitude and dispersion depends on the specific portfolio construction methods.
Overall, our results suggest that passive and active investors should take comfort in knowing that their portfolio’s expected performance properties remain intact so long as they apply a modest touch. We find evidence of material impact once hundreds of names are restricted in active portfolios, which should be evaluated on a case-by-case basis to reduce the potential for undesirable outcomes.
Literature Review
Our paper relates to the literature on portfolio construction with frictions. For example, any research that studies the benefit of TLH must consider the impact of the wash-sale rule, which essentially restricts the portfolio from buying back a security that is sold at a loss. Some studies assume that the rule should not have a significant effect because investors can lower the rebalance frequency or purchase stocks with similar risk and return characteristics (e.g., Berkin and Ye Citation2003; Sialm and Sosner Citation2018). In Khang, Paradise, and Dickson (Citation2021), each security has only one identical replacement, which prevents the algorithm from harvesting losses in the replacement security until 31 days have passed from the initial harvest date. Chaudhuri et al. (Citation2020) assume that the proceeds from TLH are placed in cash instead of investing them in substitute stocks and estimates the cash drag reduces tax-alpha by 23%. Israelov and Lu (Citation2023) also study TLH strategies constrained by the wash-sale rule, while allowing the portfolio to reinvest the proceeds in other securities. In their analysis, the cost of wash-sale restriction is reflected in active risk to the target portfolio.
Similar restrictions can also be applied to actively managed factor portfolios. As Asness (Citation2017) argues, on average, adding constraints can never help the performance. It should hurt the outcomes, except when the constraints do not bind (and are hence irrelevant). However, the magnitude of the actual impact is unclear. Clarke et al. (Citation2002) derive a generalized formula that relates portfolio constraints to the fundamental law of active management. It shows that the IR of an active portfolio is directly proportional to the number of assets in the universe as well as its transfer coefficient to the optimal portfolio. Israel et al. (Citation2019) restrict dividend-paying stocks in actual quantitative multi-style portfolios and find that the improved tax efficiency does not compensate for the reduction in expected pre-tax return and the associated increase in capital gain taxes. The results also depend on the specific styles considered. The value style, which often consists of stocks with higher dividend yields, naturally has a bigger impact by the avoidance. Ross et al. (Citation2017) find that stocks subject to TLH have natural overlap with the losers of momentum signals. Hence, restrictions from the wash-sale rule may have less impact on the performance of momentum portfolios than other types of exclusions.
Our study also complements previous research on the impact of SRI on portfolio performance, which has reached mixed conclusions. Some studies suggest that excluding “sin stocks” may reduce financial performance because these stocks have historically delivered higher returns than their comparable stocks (Fabozzi, Ma, and Oliphant Citation2008; Hong and Kacperczyk Citation2009; Trinks and Scholtens, Citation2017). Humphrey and Tan (Citation2014) find no difference in performance between funds with and without screens based on socially responsible scores. Geczy, Stambaugh, and Levin (Citation2021) construct the optimal portfolio using funds with SRI constraints and compares it to the optimal portfolio from the larger universe. They find that the SRI constraint typically costs investors more than 30 bps per month. Galema, Plantinga, and Scholtens (Citation2008) study the interaction between SRI and Fama-French factors and find that certain SRI screenings lower the book-to-market ratio of the overall portfolio. In other words, SRI increases the factor loading on existing factors instead of generating new alphas (Blitz and Swinkels Citation2021). One potential reason for the inconclusive results is that the universe of “sin stocks” (mostly tobacco, alcohol, and gambling companies) considered in these studies is relatively small compared to the broad market, both in numbers and total market capitalization.
However, in recent years the definition of SRI has been extended to many more fields of business. As-You-Sow, the leading nonprofit shareholder advocacy organization in the US, currently provides values-based restricted list based on six major categories (Fossil Fuels, Deforestation, Guns, Prisons, Weapons, Tobacco) and more than 30 subcategories.Footnote2 Many of these subcategories contain mega stocks that have not been traditionally considered as “sin stocks” such as Microsoft (Prison Industry), Amazon (Deforestation Consumer Brand), and Alphabet (Border Industry). Another characteristic of the screen list is the concentration in industries. For example, the Deforestation Financier screen applies almost exclusively to banks and the Fossil Fuels screen mostly focuses on the energy sector. Moreover, Berg, Kölbel, and Rigobon (Citation2022) show that ESG ratings from six top rating agencies have low pairwise correlations because they use different attributes, indicators, and weights when aggregating various metrics to a single rating for each company. Therefore, instead of examining the impact of excluding specific stocks under predefined SRI screens as in earlier studies, we adopt a more general approach and use simulated historical backtests to measure the distribution of outcomes when randomly selected stocks and industries are removed from passive and active portfolios.
Finally, our results on portfolio performance with a restricted universe relate to research that study the dispersion of individual stock returns and their contributions to the overall performance. Bessembinder (Citation2018) shows that all the net gains for the US stock market can be attributed to 4% of listed companies. It highlights the importance of including all stocks in the portfolio in capturing the stock market premium. On the other hand, the presence of mega stocks in the index has a negative impact on the effective number of stocks for diversification (Shapiro and Zheng Citation2021). Hence, stock exclusion might be beneficial if it avoids disproportionally large idiosyncratic risk in mega stocks. Indeed, Swade et al. (Citation2023) show that portfolios with equal allocations have outperformed their market-cap weighted benchmark over a long period of time. For active investments, Shapiro and Zheng (Citation2021) find that within the same alpha factors, large-cap stocks have outperformed small-cap stocks in recent years, creating a headwind to typical factor portfolios that tilt toward equal weights. The significance of stock return dispersion on the overall portfolio performance can be captured by the variability in outcomes of our portfolios with random stock exclusions.
Data and Methodology
Our annual investable universe spans from 1964 to 2021 and consists of the top 1,500 common shares in CRSP data by market capitalization as of the last trading day of the previous year. We construct the market-cap weighted return index of the defined investable universe to serve as a passive benchmark.
To test the impact of stock exclusions on passive portfolios, we remove randomly selected stocks from the universe each year and recalculate the market-cap weighted portfolio return using the remaining
stocks. We repeat the exercise 1,000 times and compute summary statistics for the 1,000 resulting portfolios, which include average return, volatility, terminal wealth, tracking error to the benchmark, and so on.
We also consider the impact of exclusions on active portfolios. For these portfolios, we examine four types of factors: momentum, value, low risk, and quality, which are all well established among academic researchers and practitioners.Footnote3 Our momentum and value signals follow the traditional definition: sorting stocks based on T-12 to T-1 month returns and book-to-market ratios respectively (Fama and French Citation1993; Carhart Citation1997). To construct the low risk factor, we use stocks’ “slope-winsorized” market betas, estimated using daily returns in the previous year (Frazzini and Pedersen Citation2014; Welch Citation2019). Unlike the other three factors, the quality factor is more qualitative and there is no such direct metric that unambiguously quantifies quality. Following Fama and French (Citation2006), we use operating profitability, one of the most intuitive indicators of company quality, as the quantitative signal.Footnote4 In addition to the individual factors, we also consider a composite factor using an equal-weighted average of ranks derived from the four sets of factor scores.
To measure the performance of long-only factor portfolios, we form monthly equal-weight portfolios using the top 300 stocks ranked by the factor signal.Footnote5 Given that our investible universe is the top 1,500 stocks by market cap, our equal-weight portfolios are not subject to the often-quoted implementability issue with microcaps (Soebhag et al., Citation2023). These portfolios serve as our factor benchmarks because they represent the ideal, albeit simply constructed, portfolios investors can hold if there are no constraints on stock selection.
What happens to the ideal factor portfolios if some stocks are disallowed? If the excluded stocks are never factor winners, it should have zero impact on the factor portfolio since the constraints never bind. On the other hand, there should be negative consequences if the excluded stocks are factor winners and investors are not allowed to hold them in their portfolios. When this occurs, investors have some options, although we consider two. They can either skip the top-ranked stocks and go to the next in line to form a new equal-weighted portfolio of 300 stocks, or they can simply hold the smaller set of non-excluded stocks among the top 300 factor winners. In theory, portfolios under the latter construction method should be less diversified since they hold fewer names, but with less alpha dilution arising from stock substitution. To quantify the impact of stock exclusions on factor portfolios, we again exclude randomly selected stocks from the universe and construct long-only factor portfolios under the two methods and compare their performance.
In addition to excluding randomly selected stocks, we also test the implication of industry-concentrated exclusions. Stocks are classified into 49 industries based on four-digit SIC code using Fama-French 49-Industry definitions. Instead of excluding individual stocks, we perform the same analysis by randomly excluding randomly selected industries.Footnote6 When
there are only 49 available scenarios for simulated backtests that we use to calculate performance metrics. For
we randomly select 1,000 scenarios from all possible combinations (for example, there are 18,424 combinations of 3 excluded industries one can choose out of 49 industries). After removing stocks from the selected industries, we form passive and active portfolios with the remaining stocks and compute their performance.
Exclusions in Passive Portfolios
Our first set of simulations compares the performance of increasingly restricted market-cap weighted portfolios to the passive benchmark. Over the sample period, the passive benchmark realized an average annualized total return of 11.6% with 15.2% volatility. A $1 investment in the passive portfolio grew to $446 at the end of the investment period. This is defined as the Terminal Wealth Multiple (TWM), which we use throughout the paper for comparison across portfolios. O’Neal (Citation1997) argues that difference in terminal wealth is more important to long-term investors than time-series risk measures. Empirically, he finds that investing in multiple funds has little effect on volatility but significantly reduces dispersion in terminal wealth. Chen and Israelov (Citation2022) find similar patterns in stock diversification: Portfolios with 20-30 stocks have little idiosyncratic risk but still subject investors to large shortfalls in TWM under unlucky outcomes.
Stock Exclusions
Panel A reports the average performance and standard errors across the simulated portfolios with up to 500 stocks excluded. The overall impact is minor, without any statistically significant difference in returns or volatilities. Even after excluding 500 stocks, or one-third of the universe, the average annualized return and volatilities are little impacted with tracking error increasing to 1.16%.Footnote7 This is not surprising in light of the large literature on how many stocks are required to achieve a well-diversified portfolio (Evans and Archer Citation1968; Statman Citation1987; Chong and Phillips Citation2013; Chen and Israelov Citation2022).Footnote8
Table 1. Passive Portfolio Performance under Stock and Industry Exclusions
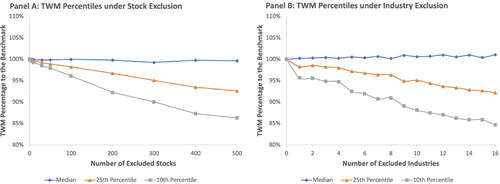
Panel A plots the TWMs of restricted portfolios as a percentage of the passive benchmark TWM at median and bottom 10th and 25th percentile outcomes. Exclusions of up to one-third of the investible universe leads to no difference in the median outcomes. Moreover, for investors who worry about potential shortfalls in their terminal wealth, TWM outcomes in unlucky scenarios, as measured by 10th and 25th percentiles, are also nearly flat for portfolios with up to 100 exclusions. Even in the worst 1-in-10 scenarios, portfolios excluding 100 stocks only suffer 4% losses in TWM relative to the passive benchmark over an investment period over 58 years! Not surprisingly, the variation in TWM increases as the portfolios become smaller in size, subject investors to greater downside risk.<AQ: Please clarify “Not surprisingly, the variation in TWM increases as the portfolios become smaller in size, subject investors to greater downside risk.”> When 500 stocks are excluded, the portfolio’s 10th percentile TWM underperforms the benchmark by 15%, which is not a small number, but only half as the percentage of stocks being excluded.
Figure 1. TWM Percentage Percentile of Passive Portfolios under Exclusion
Industry Exclusions
Investors who are interested in SRI often avoid stocks from certain industries altogether, such as gaming, tobacco, and alcohol. Conditional on the same number of stocks being excluded, portfolios missing entire industries are presumed to be riskier than portfolios missing randomly selected stocks because the former are less diversified across industries. However, the actual magnitude of the increase in industry risk and its impact on the long-term performance are unclear. Campbell et al. (Citation2001, Citation2022) decompose stock risk into market-, industry-, and stock-specific components and find that industry variance comes last in terms of relative importance. We find similar results that industry exclusion, on average, is not materially riskier than excluding purely randomly selected stocks. Panel B in reports the performance metrics for portfolios with up to 16 industries being excluded. The industry-exclusion portfolios on average have twice as much tracking error as stock-exclusion portfolios. Blitz and Swinkels (Citation2021) show that tracking error can be reduced by replacing excluded stocks with similar ones, which are often from the same industry. Hence, it is not surprising that industry exclusion results in larger tracking error because there is no within-industry substitution after exclusion.
Increased tracking error matters for those who are benchmark-conscious and care about relative returns. For those who are more focused on absolute performance, the higher tracking error does not appear to translate into materially higher average volatility. Terminal wealth dispersion is also similar between the two sets of portfolios. Conditional on the same percentage of stocks being excluded. Panel B shows that for portfolios with 16 industries or 500 stocks excluded, the 25th and 10th percentiles are almost identical. The difference in downside risk is much smaller than suggested by their respective tracking errors.
Exclusions in Active Portfolios
For each of the four factors we consider, we use the equal-weight portfolios of stocks in the top quintile (300 out of 1,500 stocks) as the ideal long-only factor portfolio. This is analogous to the long-short portfolios that academic papers often use to study factors, which hold stocks in the top quintile and short those in the bottom quintile. To study the impact of exclusions, we apply two alternative methods of portfolio construction when a factor winner stock is restricted. Under the first construction method, portfolios always consist of the top 300 stocks from the remaining universe. Alternatively, we also construct portfolios by simply removing excluded stocks without finding replacements.
Since stocks are randomly selected for exclusion, on average the same percentage of winners should be affected across all factors. For example, when 500 stocks (one-third of the universe) are excluded from the universe, then in expectation investors must skip 100 stocks out of the top 300 factor winners. For these portfolios without replacements, it means they will have 200 stocks instead of 300 on average.
The two types of portfolios also differ in their alpha strength, measured by the average rank of factor scores. The unbalanced portfolio still has an average factor rank of 150.5, which is the same as the ideal factor portfolio that holds the top 300 factor winners. On the other hand, a balanced portfolio with the same number of stock exclusions has a lower average rank of 225.5 because it holds stocks outside the top quintile as substitutes.Footnote9 Hence, the first method prioritizes preserving diversification, while the second method prioritizes preserving alpha. In the rest of the paper, we will refer to active portfolios under the first construction method as “diversification-preserving portfolios” and those under the second construction method as “alpha-preserving portfolios.”
Factor Exposures
The first natural question to ask is how effective the new active portfolios are at implementing the respective factors after stock exclusion. For the four factors we consider, we use UMD (Winners Minus Losers), HML (High Minus Low), RMW (Robust Minus Weak), and BAB (Betting Against Beta) as the explanatory variable to measure the factor loading of our active portfolios.Footnote10
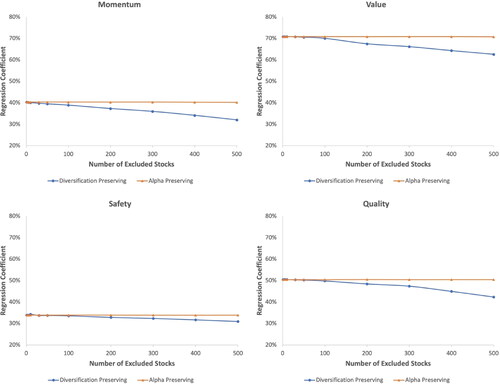
plots the regression coefficients for diversification-preserving portfolios and alpha-preserving portfolios under various numbers of stock exclusion. Despite having fewer stocks, alpha-preserving portfolios on average have the same factor loadings as the ideal factor portfolios. On the other hand, factor loadings of diversification-preserving portfolios strictly decrease as the number of exclusions increases. Interestingly, even though the change in average factor ranking is the same for all four factors, the reduction in factor exposures is different. When the average rank decreases from 150.5 to 225.5 after excluding 500 stocks from the universe, momentum active portfolios have the largest reduction in factor exposure at 20%, followed by quality portfolios at 16%. Value and safety portfolio loadings on their respective long-short factors drop by 11% and 9%, respectively. This indicates that for momentum factor, winner stocks are less substitutable with stocks ranked below the top quintile, whereas value and safety stocks in the top two quintiles are more similar to each other.
Figure 2. Average Regression Coefficients of Simulated Active Portfolios on Underlying Factors
Factor Alphas
How does the reduction in factor exposure translate to reduction in CAPM alpha? It is a challenging question because changing constituents of one active factor portfolio will impact not only its own factor loading but also its exposures to other factors. For example, it is well known that momentum and value factors are negatively correlated (Asness, Moskowitz, and Pedersen Citation2013). Hence, when a less concentrated momentum portfolio is formed after stock exclusion, its negative exposure to value factor also shrinks toward zero. This partially offsets the reduction in CAPM alpha implied by the change in momentum exposure.
Similar correlations also exist among other factors (Asness et al., Citation2019; Frazzini and Pedersen, Citation2014). As Blitz and Vidojevic (Citation2019) point out, all single-factor portfolios are suboptimal because of their unfavorable or unintended loadings on other factors. To control the interaction effect with other factors, we also regress the active portfolios on additional factors and report their multi-factor alphas. We use the Fama-French three-factor model for the momentum, quality, and safety portfolios, but we replace HML with UMD in the case that the value portfolio is the dependent variable.
reports the CAPM and multi-factor alphas of diversification-preserving and alpha-preserving portfolios. The multi-factor alphas of momentum and value portfolios are significantly higher than their respective CAPM alphas. This is consistent with the negative correlation between momentum and value. Including one of them as a control variable will increase the excess return of the other. On the other hand, since safety and quality have positive loadings on value, removing value premium reduces their alphas. Both still have significant multi-factor alphas, as shown in earlier studies (Fama and French Citation2006; Frazzini and Pedersen, Citation2014).
Figure 3. Average Annualized Alphas of Simulated Active Portfolios
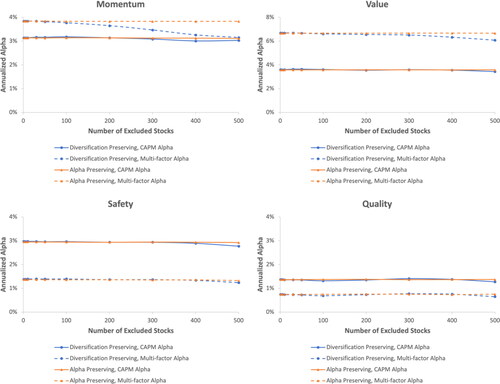
Overall, there is almost no reduction in either CAPM alphas or multi-factor alphas for alpha-preserving portfolios, which is expected since on average these constraint portfolios have the same factor exposures as the ideal portfolios. Similarly, for diversification-preserving portfolios, the percentage drop in their multi-factor alphas are also close to the drop in factor exposures shown in , which are 18%, 9%, 10%, and 13% for momentum, value, safety, and quality, respectively. However, their CAPM alphas decrease at a much slower rate.
For a diversification-preserving momentum portfolio, its market-adjusted alpha falls by merely 3.5%, much less than what is suggested by the difference in average factor ranks or factor exposures. This is because the reduction in momentum alpha is partially canceled out by fewer negative bets on the value factor. For a diversification-preserving momentum portfolio with 500 stocks excluded, its coefficient on HML in an Fama-French three-factor regression is only −15%, compared to a coefficient of −28% for the ideal momentum portfolio.
Terminal Wealth Multiplier
Finally, we also compare the TWM under the different scenarios. One might argue that active portfolios should care more about alphas since any market exposures can be hedged with derivatives. However, such tools are rarely available or easily implementable for retail investors. Moreover, as we have seen, different portfolio construction methods also result in different exposures in other risk factors such as SMB and HML, which are even more challenging to hedge away. TWM also penalizes the time-series risk in realized alphas that is not captured by the average number. All else equal, if two portfolios deliver the same average alphas, the one with less variation from one period to another will have a larger TWM.Footnote11 Hence, for retail investors who are interested in understanding the impact of stock exclusions on their long-term investment returns, TWM is the most direct and intuitive measure.
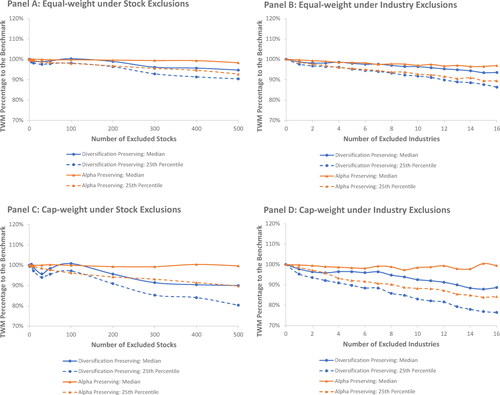
plots the median TWMs, as well as the 25th percentiles (both as percentages of the ideal portfolios’ TWMs) for momentum, value, safety, and quality under the two portfolio construction methods. Under three alpha-preserving construction, the median TWMs for all four factors are almost flat, with no statistically significant fluctuations. However, the portfolios become riskier as they hold fewer names because of restriction. If unlucky (under the 25th percentile outcome), active investors who hold those portfolios after excluding 500 stocks should expect around 15% reduction in TWM at the end of the 58-year investment period, similar to what we have seen for passive portfolios.
Figure 4. TWM Percentage Percentile of Simulated Active Portfolios
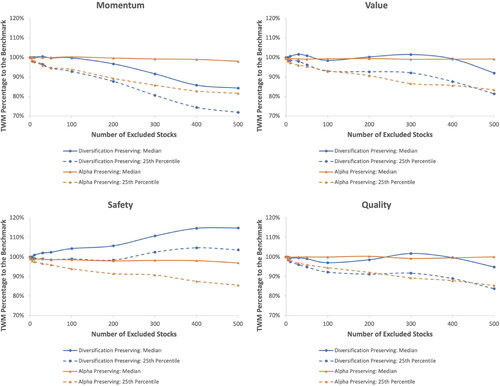
Would diversification-preserving factor portfolios deliver more robust results because they have less idiosyncratic risk? At first glance, diversification-preserving portfolios indeed have smaller dispersion in TWM, especially for momentum and value. Using the difference between the median and 25th percentile outcomes as a proxy, diversification-preserving momentum (value) portfolios have 24% (33%) less dispersion in TWM as their alpha-preserving counterparts. However, this does not imply that one is strictly preferred to the other.
As discussed earlier, even though diversification-preserving portfolios are more diversified by holding more stocks, their average alpha strength is also lower. As shown by Vogel (Citation2021), failure to consider this change in alpha will lead to the false conclusion that more diversified factor portfolios are always preferred. In addition, difference in composites of winners in one factor will also result in difference in factor loadings to other factors. For long-only retail investors who are unable to perfectly hedge away these exposures, these forces play a vital role in determining TWM.
The comparison between alpha-preserving and diversification-preserving portfolios yields mixed results across the four factors. For value and quality, diversification-preserving and alpha-preserving portfolios yield similar results, especially at a low number of stock exclusions. However, after more than 400 stocks are excluded, alpha decay starts to dominate the diversification benefit. Diversification-preserving portfolios have worse average outcomes, lower upsides, and similar downside risk.
For momentum, alpha-preserving portfolios are preferred to diversification-preserving ones for any number of exclusions that we consider. The median TWMs deteriorate so fast that even with the shrinkage in dispersion, diversification-preserving portfolios still have much worse downside risk. With 500 stocks excluded, the median TWM of diversification-preserving portfolios underperform the ideal momentum portfolio by 16% and the gap increases to 28% at the 25th percentile. Alpha-preserving portfolios, on the other hand, only underperform by 2% on average and 18% at the 25th percentile.
Finally, for the safety factor, the opposite conclusion holds. Reducing factor concentration allows the diversification-preserving portfolios to increase their exposures to the market, earning more equity risk premium and hence increasing TWM. Investors are seemingly better off under stock exclusions, which forces them to buy stocks with slightly higher market exposures and lower BAB alphas. We have seen that after 500 stocks are excluded from the investment universe, an active safety portfolio with 300 stocks has an average factor rank of 225.5 instead of 150.5, which reduces the CAPM alpha by 20 bps but increases market beta from 0.65 to 0.72. Alpha-preserving portfolios, on the other hand, have the same market beta as the ideal portfolio. As a result, not only do balanced portfolios deliver better average outcomes, even their 25th percentile outcomes are better than the average outcomes of their unbalanced counterparts.
Performance of Multi-Factor Portfolios
Finally, we construct a composite factor by combining all four factors and study how it performs under stock exclusions. To normalize factor scores across different factors, we first rank stocks by each factor and use the average factor rank as the composite signal. For example, if a stock’s factor ranks are 100, 200, 300, and 400 for momentum, value, safety, and quality, respectively, its composite signal is 250, which is the average of the four ranks. We then rerank stocks based on the new signal and form the ideal factor portfolios by holding the top 300 stocks.Footnote12
The composite portfolio has a CAPM alpha of 4.98% and a market beta of 0.79 over the sample period. Despite its low beta, it has generated a CAGR of 15%, outperforming the broad market (11% CAGR in the same period) by a wide margin. We apply stock exclusions to the universe and form alpha-preserving and diversification-preserving portfolios with the remaining stocks.
In addition to constructing to equal-weight portfolios, we also construct capitalization-weight portfolios using the same set of factor winners. Equal-weight factor portfolios generally provide higher exposure to the underlying factors than their capitalization-weight counterparts. Thus, equal-weight portfolios are better suited for studying the impact of stock exclusions on raw factor alphas. However, they face more implementation difficulties than capitalization-weight portfolios in practice due to their higher turnover and the liquidity issue of small stocks. For a robustness check, we construct the composite factor portfolios using both weighting methods to see whether our conclusions are impacted.
reports the performance metrics of these portfolios. On average, there is almost no decay in performance of alpha-preserving portfolios due to stock exclusions as shown in Panel A and B. Portfolios with up to 500 stock exclusions have about the same average total returns, volatilities, and Sharpe ratios (SRs) as the unconstrained portfolios. Moreover, there is no material deterioration in the IR. Theoretical models predict that on average IR should decrease because the breadth of the universe is smaller (less alpha) and the number of names in the alpha-preserving portfolio is lower (more tracking error). Our results show that the empirical magnitude of the reduction is marginal, both in equal-weight and capitalization-weight portfolios.
Table 2. Performance of the Composite Factor Portfolio under Stock Exclusions
We also report the average Manipulation Proof Performance Measure (MPPM) of these portfolios as defined in Goetzmann et al. (Citation2007).Footnote13 The MPPM resembles the family of additively separable power utility functions, which corrects for the impact of tail risk that stems from negative skewness and kurtosis. Following Goetzmann et al. (Citation2007), we use a relative risk aversion of three in our calculations, which is close to the value that maximizes the historical MPPM of CRSP capitalization-weight market portfolio. The average MPPM of the equal-weight (capitalization-weight) alpha-preserving portfolios are all around 7.4% (6.8%), consistently well above that of the market portfolio at 3.4% under the same parameter. Portfolios with more exclusions have slightly lower MPPM as expected, but the decrease is immaterial even after excluding one-third of the universe.
Panels C and D report the same set of results for diversification-preserving portfolios. Same as the pattern in single-factor diversification-preserving portfolios, there is a slight reduction in CAPM alphas as the number of stock exclusions increases because the restricted portfolios must hold less favorable stocks. With 500 stocks excluded, equal-weight and value-weight portfolios lose 32 and 40 basis points in CAPM alphas, respectively. Interestingly, despite the reduction in alphas, the IRs remain relatively constant. As the exposures to the underlying active factors decrease due to exclusions, the portfolios start to resemble the market, which results in smaller tracking errors. The reduction in tracking errors partially offsets the reduction in alphas. Finally, due to the low-volatility nature of the composite factor, portfolios with lower factor exposures benefit more from the market premium. As a result, the average total returns are flat in equal-weight portfolios and only 18 bps lower in capitalization-weight portfolios, much less than the loss in alphas.
TWMs of Multi-Factor Portfolios under Stock and Industry Exclusions
Even though these portfolios have similar annualized performance metrics, Chen and Israelov (Citation2022) demonstrate that the small differences in average return and volatility can compound into a large disparity in terminal wealth. Moreover, the dispersion in terminal wealth, especially the poor outcomes, can also inform us about the potential shortfalls investors with exclusions in their strategies might face under unlucky events. Hence, we plot in the median and 25th percentile TWMs of the equal-weight and capitalization-weight portfolios with exclusions as percentages of the ideal composite factor portfolio’s TWM. In addition to stock exclusions, we also apply industry-concentrated exclusions to test, conditional on the same percentage of names excluded, whether industry-concentrated exclusions are more detrimental to the performance of active portfolios.
Figure 5. TWM Percentage Percentile of Multi-factor Portfolios under Exclusion
Like what we have seen with individual factors, in Panel A the equal-weight alpha-preserving portfolios have almost no systematic reduction in TWMs. The median TWM with 500 stocks excluded from the universe is only 2% lower than that of the ideal portfolio. Moreover, the downside risk in TWM is also similar to that of passive portfolios. Under the 1-in-4 unlucky event threshold, the portfolio with 500 stock exclusions has a potential shortfall of merely 7%, smaller than any of the individual factor portfolios.
Given that the diversification-preserving portfolios suffer from alpha decay under momentum and benefit from higher market beta under safety, average outcome of diversification-preserving portfolios exhibit more variation as the two forces act against each other. The median TWMs are close to the ideal level at low to moderate numbers of stock exclusion. Once the stock exclusion count exceeds 200, the TWMs start to decrease. Investors in those portfolios should expect 5% reduction in median TWM and a potential shortfall of 10% under the 25th percentile outcome when they exclude 500 stocks.
Panel B shows the performance of the same factor portfolios when applying industry exclusions. We again report up to 16 industries being excluded as they on average consist of around 500 stocks. The portfolios perform slightly worse than those with random stock exclusions, which are reflected in both lower median TWMs and higher TWM dispersion. This relates to Ehsani, Harvey, and Li’s (Citation2023) finding that long-only investors in factor portfolios generally benefit from sector bets as part of the factor alpha. Hence, sector-concentrated removal has more impact on the performance of factor portfolios than randomly selected stocks. Overall, the performance impact remains modest. Even with one-third of the industries excluded, the median (25th percentile) TWM of alpha-preserving portfolios underperforms the ideal equal-weight factor portfolio only by 5% (10%).
Panels C and D plot the same metrics for capitalization-weight portfolios. On average, the impact of exclusions is slightly larger relative to the unconstrained capitalization-weight factor portfolio than that under equal-weight portfolios. Investors in diversification-preserving portfolios should expect on average a 10% shortfall in TMW over the sample period when they exclude 500 stocks or 16 industries from the universe, but the gap rises to 25% under 25th percentile unlucky outcomes. While alpha-preserving portfolios on average do not suffer from any deterioration in TWMs, their 25th percentile outcomes are 10% (15%) lower than the unconstrained portfolio when investors randomly excluded one-third (industry-concentrated) of the stocks from the universe.
Exclusions and Trading Costs
Investors seeking to implement portfolios should consider the impact of turnover and transactions costs on net returns. Stock exclusions, depending on the nature of them, can have a potentially material impact on strategy turnover. For example, a static exclusion list that never adjusts should have a modest impact on turnover, arising from implementing a portfolio within a smaller universe. At the other extreme, exclusions that are randomly adjusted each day or month can materially impact net performance.
Our analysis and insights are focused more on the impact of exclusions on gross performance. Even without incorporating exclusions, there are effective algorithms for implementing factor portfolios with reduced turnover to limit transactions costs and capital gains tax. For examples of such proposed algorithms, please see Novy-Marx and Velikov (Citation2016), Goldberg, Hand, and Cai (Citation2019), and Chen and Israelov (Citation2023).
Still, we present some context for turnover and transactions costs here. All portfolios we analyze seek to contain the best-ranked stocks each month and rebalance accordingly to maximally capture the factor returns and determine the impact of exclusions on doing so. The base case monthly rebalanced capitalization-weight portfolio, which has no exclusions, has an annualized turnover of approximately 650%. Assuming an 8–basis point average market impact (see Frazzini and Moskowitz [Citation2018]), the base case annualized trading cost is 0.52%. We estimate that implementing the alpha-preserving portfolios with 50, 100, and 500 exclusions—re-randomized once each year—increases annualized turnover from 650% to 660%, 670%, and 720%, respectively, thereby increasing annualized trading costs by 1 to 6 basis points.
These numbers provide some directional guidance into the impact of exclusions on trading costs, but we highlight their limitations. They assume full rebalancing, not using a trading cost–aware rebalancing algorithm. And they also assume that the exclusion universe is independently regenerated annually.
Conclusion
Using simulated historical backtests, we test the impact of stock exclusions on the performance of passive and active portfolios. Overall, our results suggest that modest stock exclusions on average has almost no effect on passive portfolios in terms of return and risk profiles. The conclusion holds even when excluded stocks are concentrated in a few industries. However, as the number of exclusions increases, investors start to experience a wider dispersion in terminal wealth.
We also consider two alternative construction methods for active portfolios with stock exclusions: one that always holds the same number of stocks as the original portfolio by replacing restricted factor-favored stocks with less favored names (diversification-preserving) and another that holds whatever stocks remain from the original winner list after the exclusions (alpha-preserving). We find that alpha-preserving portfolios on average have no decay in exposures to the underlying factor and alphas but result in more variation in terminal wealth outcomes as more stocks are excluded.
Diversification-preserving portfolios on the other hand have realized between a 10% and 20% reduction in factor exposures and Fama-French alphas. Surprisingly, there is significantly less observed decay in their CAPM alphas. Finally, except for safety factor, alpha-preserving portfolios yield better terminal wealth multiple distributions than diversification-preserving portfolios do. Alpha-preserving portfolios allow investors with stock exclusions to capture the same level of expected cumulative returns as the original portfolio with moderate shortfalls under unlucky events. On the other hand, safety-factor investors with stock exclusions tend to capture more returns over time by realizing higher equity beta with little loss in alpha when adding substitutes for the excluded stocks to their portfolios.
Finally, we construct a simple multi-factor portfolio using the four individual factors and analyze its performance under stock and industry exclusions. Even when 200 stocks are excluded from the universe, portfolios under both construction methods have almost the same median TWM as the ideal factor portfolio and the 25th percentiles are less than 4% lower. As the number of exclusions increases, diversification-preserving portfolios start to underperform the alpha-preserving portfolios by a small margin. Industry exclusions yield similar median outcomes but slightly more downside risk for the same percentage of stocks being excluded. Despite our heuristic approach at constructing active portfolios with holding constraint, these multi-factor portfolios are very robust to stock exclusions.
Important Disclosure/Disclaimer
NDVR, Inc. ("NDVR") is an investment advisor that may or may not apply similar investment techniques or methods of analysis as those described herein when managing portfolios for its clients. The views expressed herein are those of the authors and not necessarily those of NDVR. The views and information herein are not and may not be relied on in any manner as investment, legal, tax, accounting, or other advice provided by NDVR or as an offer to sell or a solicitation of an offer to buy any security. NDVR does not provide legal or tax advice. Consult an attorney, tax professional, or other advisor regarding your specific legal or tax situation.
Disclosure
Both authors work for an RIA that manages custom equity portfolios that allow for personalized preferences including restrictions. This submitted paper documents research into how impactful the implementation of such restrictions is on investment performance.
Additional information
Notes on contributors
Yin Chen
Yin Chen is a Research Vice President at NDVR, Inc., Boston. MA. Roni Israelov is the President and Chief Investment Officer at NDVR, Inc., Boston. MA.
Roni Israelov
Yin Chen is a Research Vice President at NDVR, Inc., Boston. MA. Roni Israelov is the President and Chief Investment Officer at NDVR, Inc., Boston. MA.
Notes
1 There are generally three classes of “indexing” strategies within this ecosystem. Direct indexing holds the underlying stocks of an already published index. Custom indexing first creates a new index, customizing on dimensions such as equity universe, factor exposures, or ESG considerations, and then holds the underlying stocks of the newly constructed custom index. A typical use case of custom indexing is a registered investment advisor or brokerage creates a handful of custom indices for their clients, and all clients who select the same custom index receive the same portfolio of individual stocks. Personalized indexing allows customization to occur for each individual client or portfolio, enabling each portfolio to reflect the unique preferences and goals of its respective investor.
3 Our value and quality signals come from the cross-sectional stock characteristics produced by Chen and Zimmermann (Citation2022).
4 We also used gross profit margin as the quality signal for robustness and found similar results (Novy-Marx, Citation2013).
5 The quality signal excludes financial firms, identified with SIC codes between 6000 and 6999. Stocks with missing signals are assigned the median rank of 750. Following Ehsani, Harvey, and Li (Citation2023), we do not sector neutralize factor signals in long-only portfolios.
6 Sixteen industries on average cover a similar fraction of the universe as 500 stocks.
7 Low tracking error has little impact on total volatility. In this case, which is an increase in total realized volatility as shown in Table 1, but barely so.
8 Please see Zaimovic, Omanovic, and Arnaut-Berilo (Citation2021) for a comprehensive literature review on this topic.
9 Holding the top 300 names out of the remaining 1,000 stocks has the same average rank as holding the top 450 stocks out of the original 1,500 stocks, which has an average rank of 225.5. More generally, when x% of the universe is excluded, one should expect the average factor score rank to be multiplied by 100/(100-x).
10 In addition to the specific factor, we also include market, HML, and SMB in all regressions since equal-weight portfolios have natural loadings on SMB (Swade et al. Citation2023).
11 Information ratio, defined as the ratio of average active return divided by the tracking error, captures the same idea.
12 Conceptually, our portfolio is similar to the “conservative formula” in Blitz and van Vliet (2021), which holds the top 100 stocks low return volatility, high net payout yield, and strong price momentum. They find that the portfolio outperforms the market by a wide margin with smaller downside risk over a long period of history.
13 We thank an anonymous reviewer for the recommendation.
References
- Asness, Clifford S. 2017. Virtue is Its Own Reward or One Mans Ceiling is Another Mans Floor. AQR Working Paper. https://www.aqr.com/insights/perspectives/virtue-is-its-own-reward-or-one-mans-ceiling-isanother-mans-floor
- Asness, Clifford S., Andrea Frazzini, and Lasse Heje Pedersen. 2019. “Quality minus Junk.” Review of Accounting Studies 24 (1): 34–112. doi:10.1007/s11142-018-9470-2.
- Asness, Clifford S., Tobias J. Moskowitz, and Lasse Heje Pedersen. 2013. “Value and Momentum Everywhere.” The Journal of Finance 68 (3): 929–85. doi:10.1111/jofi.12021.
- Berg, Florian, Julian F. Kölbel, and Roberto Rigobon. 2022. “Aggregate Confusion: The Divergence of ESG Ratings.” Review of Finance 26 (6): 1315–44. doi:10.1093/rof/rfac033.
- Berkin, Andrew L., and Jia Ye. 2003. “Tax Management, Loss Harvesting, and HIFO Accounting.” Financial Analysts Journal 59 (4): 91–102. doi:10.2469/faj.v59.n4.2548.
- Bessembinder, Hendrik. 2018. “Do Stocks Outperform Treasury Bills?” Journal of Financial Economics 129 (3): 440–57. doi:10.1016/j.jfineco.2018.06.004.
- Blitz, David, and Pim van Vliet. 2018. “The Conservative Formula: Quantitative Investing Made Easy.” The Journal of Portfolio Management 44 (7): 24–38. doi:10.3905/jpm.2018.44.7.024.
- Blitz, David, and Milan Vidojevic. 2019. “The characteristics of factor investing.” The Journal of Portfolio Management 45 (3): 69–86. doi:10.3905/jpm.2019.45.3.069.
- Blitz, David, and Laurens Swinkels. 2021. “Does excluding Sin Stocks Cost Performance?” Journal of Sustainable Finance & Investment 13 (4): 1693–1710. doi:10.1080/20430795.2021.1972789.
- Brightman, Chris, Forrest Henslee, Vitali Kalesnik, Feifei Li, and Juhani Linnainmaa. 2021. “Why Are High Exposures to Factor Betas Unlikely to Deliver Anticipated Returns?” The Journal of Portfolio Management 48 (2): 144–63. doi:10.3905/jpm.2021.1.310.
- Campbell, John Y., Martin Lettau, Burton G. Malkiel, and Yexiao Xu. 2001. “Have Individual Stocks Become More Volatile? An Empirical Exploration of Idiosyncratic Risk.” The Journal of Finance 56 (1) :1–43. doi:10.1111/0022-1082.00318.
- Campbell, John Y., Martin Lettau, Burton G. Malkiel, and Yexiao Xu. 2022. “Idiosyncratic Equity Risk Two Decades Later.”
- Carhart, Mark M. 1997. “On Persistence in Mutual Fund Performance.” The Journal of Finance 52 (1): 57–82. doi:10.1111/j.1540-6261.1997.tb03808.x.
- Chaudhuri, Shomesh E., Terence C. Burnham, and Andrew W. Lo. 2020. “An Empirical Evaluation of Tax-Loss-Harvesting Alpha.” Financial Analysts Journal 76 (3): 99–108. doi:10.1080/0015198X.2020.1760064.
- Chen, Andrew Y., and Tom Zimmermann. 2022. “Open Source Cross-Sectional Asset Pricing.” Critical Finance Review 11 (2): 207–64. doi:10.1561/104.00000112.
- Chen, Yin, and Roni Israelov. 2022. How Many Stocks Should You Own? NDVR Working Paper. https://ndvr.com/journal/how-many-stocks-should-you-own
- Chen, Yin, and Roni Israelov. 2023. “Alpha Now, Taxes Later: A Tax-Efficient Approach to Factor Investing.” Available at SSRN 4538712.
- Chong, James, and G. Michael Phillips. 2013. “Portfolio Size Revisited.” The Journal of Wealth Management 15 (4): 49–60. doi:10.3905/jwm.2013.15.4.049.
- Clarke, Roger, Harindra De Silva, and Steven Thorley. 2002. “Portfolio Constraints and the Fundamental Law of Active Management.” Financial Analysts Journal 58 (5): 48–66. doi:10.2469/faj.v58.n5.2468.
- Ding, Zhuanxin, and R. Douglas Martin. 2017. “The Fundamental Law of Active Management: Redux.” Journal of Empirical Finance 43: 91–114. doi:10.1016/j.jempfin.2017.05.005.
- Ehsani, Sina, Campbell R. Harvey, and Feifei Li. 2023. “Is Sector-Neutrality in Factor Investing a Mistake?” Financial Analysts Journal 79 (3): 95–117. doi:10.1080/0015198X.2023.2196931.
- Evans, John L., and Stephen H. Archer. 1968. “Diversification and the Reduction of Dispersion: An Empirical Analysis.” The Journal of Finance 23 (5): 761–7. doi:10.2307/2325905.
- Fabozzi, Frank J., K. C. Ma, and Becky J. Oliphant. 2008. “Sin Stock Returns.” The Journal of Portfolio Management 35 (1): 82–94. doi:10.3905/JPM.2008.35.1.82.
- Fama, Eugene F., and Kenneth R. French. 1993. “Common Risk Factors in the Returns on Stocks and Bonds.” Journal of Financial Economics 33 (1): 3–56. doi:10.1016/0304-405X(93)90023-5.
- Fama, Eugene F., and Kenneth R. French. 2006. “Profitability, Investment and Average Returns.” Journal of Financial Economics 82 (3): 491–518. doi:10.1016/j.jfineco.2005.09.009.
- Frazzini, Andrea, and TobiasJ. Moskowitz. 2018. “Trading Costs.” AQR Working Paper.
- Frazzini, Andrea, and Lasse Heje Pedersen. 2014. “Betting against Beta.” Journal of Financial Economics 111 (1): 1–25. doi:10.1016/j.jfineco.2013.10.005.
- Galema, Rients, Auke Plantinga, and Bert Scholtens. 2008. “The Stocks at Stake: Return and Risk in Socially Responsible Investment.” Journal of Banking & Finance 32 (12): 2646–54. doi:10.1016/j.jbankfin.2008.06.002.
- Geczy, Christopher C., Robert F. Stambaugh, and David Levin. 2021. “Investing in Socially Responsible Mutual Funds.” The Review of Asset Pricing Studies 11 (2): 309–51. doi:10.1093/rapstu/raab004.
- Goetzmann, William, Jonathan Ingersoll, Matthew Spiegel, and Ivo Welch. 2007. “Portfolio Performance Manipulation and Manipulation-Proof Performance Measures.” The Review of Financial Studies 20 (5): 1503–46. doi:10.1093/rfs/hhm025.
- Goldberg, Lisa R., Pete Hand, and Taotao Cai. 2019. “Tax-Managed Factor Strategies.” Financial Analysts Journal 75 (2): 79–90. doi:10.1080/0015198X.2019.1567191.
- Grinold, Richard C. 1989. “The Fundamental Law of Active Management.” Streetwise, the Best of the Journal of Portfolio Management 15 (3): 30–37.
- Hong, Harrison, and Marcin Kacperczyk. 2009. “The Price of Sin: The Effects of Social Norms on Markets.” Journal of Financial Economics 93 (1): 15–36. doi:10.1016/j.jfineco.2008.09.001.
- Humphrey, Jacquelyn E., and David T. Tan. 2014. “Does It Really Hurt to Be Responsible?” Journal of Business Ethics 122 (3): 375–86. doi:10.1007/s10551-013-1741-z.
- Israel, Ronen, Joseph Liberman, Nathan Sosner, and Lixin Wang. 2019. “Should Taxable Investors Shun Dividends?” The Journal of Wealth Management 22 (3): 49–69. doi:10.3905/jwm.2019.1.080.
- Israelov, Roni, and Jason Lu. 2023. “A Tax-Loss Harvesting Horserace: Direct Indexing versus ETFs.” Journal of Beta Investment Strategies 14 (3): 69–89. doi:10.3905/jbis.2023.1.039.
- Khang, Kevin, Thomas Paradise, and Joel Dickson. 2021. “Tax-Loss Harvesting: An Individual Investor’s Perspective.” Financial Analysts Journal 77 (4): 128–50. doi:10.1080/0015198X.2021.1963187.
- Michaud, Richard O., N. Esch David, and Robert O. Michaud. 2017. “Estimation Error and the “Fundamental Law of Active Management.” Journal of Investing 15 (3): 30–37. doi:10.3905/joi.2020.1.133.
- Novy-Marx, Robert. 2013. “The other side of value: The gross profitability premium.” Journal of Financial Economics 108 (1): 1–28. doi:10.1016/j.jfineco.2013.01.003.
- Novy-Marx, Robert, and Mihail Velikov. 2016. “A Taxonomy of Anomalies and Their Trading Costs.” Review of Financial Studies 29 (1): 104–47. doi:10.1093/rfs/hhv063.
- O'neal, Edward S. 1997. “How Many Mutual Funds Constitute a Diversified Mutual Fund Portfolio?” Financial Analysts Journal 53 (2): 37–46. doi:10.2469/faj.v53.n2.2070.
- Ross, Adrienne, Tobias J. Moskowitz, Ronen Israel, and Laura Serban. 2017. “Implementing Momentum: What Have we Learned?” Available at SSRN 3081165.
- Shapiro, Rob, and Fangze Zheng. 2021. “Recent Large-Cap Stock Outperformance and Its Impact on US Equities.” The Journal of Investing 30 (5): 95–106. doi:10.3905/joi.2021.1.184.
- Sialm, Clemens, and Nathan Sosner. 2018. “Taxes, Shorting, and Active Management.” Financial Analysts Journal 74 (1): 88–107. doi:10.2469/faj.v74.n1.1.
- Soebhag, Amar, Bart Van Vliet, and Patrick Verwijmeren. 2023. “Non-Standard Errors in Asset Pricing: Mind Your Sorts.” Available at SSRN 4136672.
- Statman, Meir. 1987. “How Many Stocks Make a Diversified Portfolio?” The Journal of Financial and Quantitative Analysis 22 (3): 353–63. doi:10.2307/2330969.
- Swade, Alexander, Sandra Nolte, Mark Shackleton, and Harald Lohre. 2023. “Why Do Equally Weighted Portfolios Beat Value-Weighted Ones?” The Journal of Portfolio Management 49 (5): 167–87. doi:10.3905/jpm.2023.1.482.
- Trinks, Pieter Jan, and Bert Scholtens. 2017. “The Opportunity Cost of Negative Screening in Socially Responsible Investing.” Journal of Business Ethics 140 (2): 193–208. doi:10.1007/s10551-015-2684-3.
- Vogel, Jack. 2021. “How Portfolio Construction Impacts the Reliability of Outcomes.” Alpha Architect Working Paper.
- Welch, Ivo. 2019. Simpler Better Market Betas. No. w26105. National Bureau of Economic Research. doi:10.3905/joi.2020.1.133.
- Zaimovic, Azra, Adna Omanovic, and Almira Arnaut-Berilo. 2021. “How Many Stocks Are Sufficient for Equity Portfolio Diversification? A Review of the Literature.” Journal of Risk and Financial Management 14 (11): 551. doi:10.3390/jrfm14110551.