
Site details
Lake Öagöl (57° 12′ 34″; 14° 48′ 03″) is situated in the central part of the province of Småland, southern Sweden, a region characterised by mixed woodlands and small-scale agriculture. The investigated lake has a circular to squarish shape and covers 1.8 ha. A minor road runs through the catchment area (which is 22 ha) on the western side of the lake (approximately 100 m from the lake shore). The nearest village is situated about 2 km away. Historical maps from the nineteenth century show that cultivated fields and hay meadows were situated close to the village. The maps also show that the immediate area around the lake was part of the land, which was mainly used for grazing and wood resources, and that the nearest hay meadow was approximately 500 m away. Today, the land-cover around the lake is mixed woodland, dominated by spruce plantations. On the western side of the lake catchment is a local nature reserve (Kråketorpsskogen, 200 ha), which is protected from modern forestry.
Sediment description
The lake was sampled during fieldwork in 2010 using a freeze corer (Renberg & Hansson Citation2010). The sediment consisted of dark brown gyttja, of which the uppermost 86.5 cm were retrieved and kept frozen until further sampling in laboratory. The water depth was 10.8 m at the coring location.
Dating
Eleven macrofossil samples were dated using accelerator mass spectroscopy (AMS) at the Radiocarbon Dating Laboratory at Lund University (). A chronology for the uppermost 18 cm was established at the Environmental Radiometric Facility, University College London, by using lead-210 dating method and the Constant Rate of Supply (CRS) model (Appleby Citation2001). The OxCal program (v.4.2.4) was used for calibration of radiocarbon dates and to construct an age-depth model for the entire sediment sequence based on the IntCal13 calibration curve (Bronk Ramsey Citation2009; Reimer et al. Citation2013). Based on the established chronology (spanning from ad 480 to ad 2010), samples were extracted (0.5 cm intervals), prepared and analysed for pollen composition, with a time interval of 50 years (or as close as possible).
Table I. Information about radiocarbon dates on macroscopic remains from Lake Öagöl. Sample weights are from the laboratory report (after pre-treatment).
Interpretation
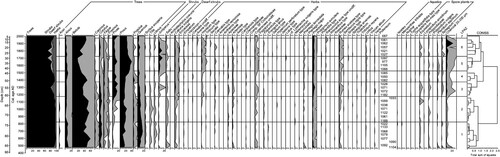
The vegetation and land-use development inferred from this study is comparable to previously published pollen records from the region (e.g. Lagerås et al. Citation2016; Fredh et al. Citation2019). Despite being situated outside a village and at some distance from managed hay meadows (at least during the nineteenth century), the pollen diagram shows clear indications of human activity during periods commonly associated with relatively high agricultural intensity in the region, although woodland cover dominates the lake surroundings throughout the last c. 1500 years. Based on stratigraphically constrained cluster analysis (CONISS), the pollen diagram was divided into seven local pollen assemblage zones (LPAZs 1–7), which are described in detail ().
Figure 1. Pollen percentage diagram from Lake Öagöl. Black graphs show percentages and grey graphs show exaggeration (× 10). Constrained cluster analysis (CONISS) in Tilia (v.2.0.41) was used to identify local pollen assemblage zones (LPAZs). The pollen sum includes all terrestrial pollen taxa.
LPAZ 1 (ad 480–825, 86–73 cm)
The vegetation during this period was dominated by trees (up to 97%), mainly Alnus, Betula, Corylus, Pinus and Quercus. The relatively large number of light-demanding trees indicates some human activity, for example by deliberate removal of shade-tolerant trees. There are no other clear signs of human impact during this period, except a few scattered pollen grains from e.g. Hordeum type and Cannabis type. However, the two oldest samples have a slightly larger proportion of grazing indicators, including Juniperus, Calluna vulgaris (L.) Hull., Cyperaceae, Plantago lanceolata L. and Poaceae. The amount of microscopic charcoal is also slightly larger in these two samples. Possibly, this lower part of the pollen diagram shows the remains of an earlier agricultural expansion in the area.
LPAZ 2 (ad 825–1175, 73–60 cm)
This zone shows a similar pollen composition as LPAZ 1, but with slightly lower percentages of Alnus and Corylus. In the upper part of this zone, a slightly more open landscape and a low amount of agricultural activity seem to have been present, indicated by a larger proportion of dwarf shrubs and herbs, such as Calluna vulgaris, Artemisia, Cyperaceae, Plantago lanceolata and Rumex acetosa type, at the expense of the tree Pinus. In addition, the cultivated plants Hordeum type and Cannabis type, were identified continuously from this time. The upper part of LPAZ 2 probably represents the first phase of a more permanent agricultural settlement nearby.
LPAZ 3 (ad 1175–1375, 60–51 cm)
The transition into this zone marks the most distinct change in the pollen diagram, characterised by the establishment of Picea and an agricultural expansion. When Picea arrived at the lake (shown by increased pollen percentage) it became one of the dominant trees, which is in agreement with the regional trend (Bradshaw & Lindbladh Citation2005). Crop cultivation and grassland continued to expand, suggested by increased pollen composition of Juniperus, Hordeum type, Poaceae and Urtica, and an increased amount of microscopic charcoal (that remained on a higher level from this time onwards). Simultaneously, several trees declined during this period, indicated by a reduced pollen percentage of Betula, Corylus, Quercus and Tilia. Farming based on permanent fields became widespread in the uplands of southern Sweden around the eleventh century (Lagerås Citation2007), which is possibly reflected by the agricultural expansion indicated also in the present study.
LPAZ 4 (ad 1375–1525, 51–43 cm)
This zone is characterised by a temporary reduction in human activity, indicated by reduced percentages of Juniperus, Calluna vulgaris, Hordeum type, Cyperaceae undiff., Poaceae and microscopic charcoal (although these indicators are still present in low numbers). Meanwhile, the pollen composition suggests woodland regrowth, through two phases of succession: first, light-demanding trees (Betula and Populus) which were later replaced by more shade-tolerant trees (Alnus, Pinus and Quercus). The changes recorded in this time interval are probably a consequence of the regression after the Black Death pandemic (c. ad 1350) (Lagerås et al. Citation2016).
LPAZ 5 (ad 1525–1725, 43–28 cm)
During this period, the pollen composition suggests an expansion of agricultural activities. Several taxa indicating cultivation and grazing increased, mainly Juniperus, Calluna vulgaris, Hordeum type, Cyperaceae and Plantago lanceolata, at the expense of mainly Alnus, Betula and Quercus. The amount of microscopic charcoal also increased. This expansion is consistent with the commonly inferred re-establishment of farms in the region during the sixteenth century, when the population increased again after the regression following the Black Death pandemic, shown in LPAZ 4.
LPAZ 6 (ad 1725–1975, 28–8 cm)
The inferred vegetation during this period is similar to LPAZ 5, except for a shift to more short-lived trees, mainly Betula and Corylus, at the expense of the more long-lived tree Pinus. These changes suggest a different use of the land at further distance from the village, possibly increased grazing. In addition, Tilia and Ulmus seem to be re-established locally in low numbers during this period, probably allowed to expand on temporary, newly opened land. This period is contemporary with the agricultural revolution and early phases of modern agriculture, which include agricultural improvements, such as land-divisions and crop rotation, which might be reflected in some of the changes seen during this period.
LPAZ 7 (ad 1975–2010, 8–0 cm)
This uppermost zone shows reduced human activity, suggested by the decreased presence of Juniperus, Hordeum type, Plantago lanceolata, Rumex acetosa type and microscopic charcoal, while the tree cover expanded, indicated by the increased percentage of Picea pollen. These changes probably reflect modern land use, which commonly includes areas for either cultivation or tree plantations, with almost no semi-open vegetation and permanent grassland remaining.
Acknowledgements
Anna Broström, Annette Mellström and Ian Snowball are greatly acknowledged for their help with fieldwork and discussions related to this project. Fieldwork and dating methods were funded by the Crafoord Foundation, the Helge Ax:son Johnson Foundation, The Royal Physiographic Society in Lund and The Royal Swedish Academy of Sciences.
Disclosure statement
No potential conflict of interest was reported by the author.
References
- Appleby PG. 2001. Chronostratigraphic techniques in recent sediments. In: Last WM, Smol JP, eds. Tracking environmental change using lake sediments, 171–203. Dordrecht: Springer.
- Bradshaw RHW, Lindbladh M. 2005. Regional spread and stand-scale establishment of Fagus sylvatica and Picea abies in Scandinavia. Ecology 86: 1679–1686. doi:10.1890/03-0785.
- Bronk Ramsey C. 2009. Bayesian analysis of radiocarbon dates. Radiocarbon 51: 337–360. doi:10.1017/S0033822200033865.
- Fredh DE, Lagerås P, Mazier F, Björkman L, Lindbladh M, Broström A. 2019. Farm establishment, abandonment and agricultural practices during the last 1,300 years: a case study from southern Sweden based on pollen records and the LOVE model. Vegetation History and Archaeobotany 28: 529–544. doi:10.1007/s00334-019-00712-x.
- Lagerås P. 2007. The ecology of expansion and abandonment: medieval and post-medieval land-use and settlement dynamics in a landscape perspective. Stockholm: Swedish National Heritage Board.
- Lagerås P, Broström A, Fredh D, Linderson H, Berg A, Björkman L, Hultberg T, Karlsson S, Lindbladh M, Mazier F, Segerström U, Sköld E. 2016. Abandonment, agricultural change and ecology. In: Lagerås P, ed. Environment, society and the Black Death—an interdisciplinary approach to the late-medieval crisis, 30–68. Oxford: Oxbow Books.
- Reimer PJ, Bard E, Bayliss A, Beck JW, Blackwell PG, Bronk Ramsey C, Buck CE, Cheng H, Edwards RL, Friedrich M, Grootes PM, Guilderson TP, Haflidason H, Hajdas I, Hatté C, Heaton TJ, Hoffmann DL, Hogg AG, Hughen KA, Kaiser KF, Kromer B, Manning SW, Niu M, Reimer RW, Richards DA, Scott EM, Southon JR, Staff RA, Turney CSM, van der Plicht J. 2013. IntCal13 and Marine13 radiocarbon age calibration curves 0‒50,000 years cal BP. Radiocarbon 55: 1869–1887. doi:10.2458/azu_js_rc.55.16947.
- Renberg I, Hansson H. 2010. Freeze corer no. 3 for lake sediments. Journal of Paleolimnology 44: 731–736. doi:10.1007/s10933-009-9378-8.