
 ?Mathematical formulae have been encoded as MathML and are displayed in this HTML version using MathJax in order to improve their display. Uncheck the box to turn MathJax off. This feature requires Javascript. Click on a formula to zoom.
ABSTRACT
The development of the process to produce Metal Matrix Nanocomposite (MMNC) coatings can provide opportunity for the enhancement of mechanical and electrical properties. This research uses speciation-simulating software to screen formulations for producing nanocomposites by pulse-reverse plating (PRP). PRP is used as a controlled delivery mechanism to attract a high concentration of nanoparticles to the coating during the anodic pulse which are subsequently captured in the cathodic pulse. A disadvantage is that the anodic pulse generates passivating hydroxide layers leading to poor adhesion. Speciation plots assess the stabilising effect of chosen complexants (gluconate and glycine) within electrolytes with the aim of diminishing hydroxide formation. To confirm bath formulation effectiveness before nanoparticle incorporation, UV-Vis spectroscopy and electrodeposition were used. Gluconate and glycine both theoretically produce highly stable complexes and also produce uniform copper deposits supporting the stabilisation effect observed in theoretical studies. This work therefore supports the use of these complexants for future stages of this research.
1. Introduction
Pulse-Reverse Plating (PRP) has been developed in recent years as a method to produce Metal Matrix Nanocomposite (MMNC) coatings with enhanced mechanical, electrical and thermal properties; however complete control and understanding of coating production is lacking.
MMNCs are materials consisting of 2 or more components; one of which is a metallic bulk coating and at least one has one dimension on the nanoscale.Citation1 These nanoparticles can be single or multiphase, and ceramic or metallic. Metal coatings and nanoparticles have their own unique characteristics in isolation; however, when particles are put into the matrix of a metal coating, they can confer desirable properties over the matrix alone. For example, as far back as 1928, copper and graphite were being codeposited to produce self-lubricating surfaces in car engines.Citation2 Copper is often used in components due to its high thermal and electrical conductivity at room temperature (401 W m–1 K–1 and 5.84 × 10⁷ S m–1 respectively).Citation3 Nanomaterials are being used more and more in industry and research due to their improvement of properties, such as incorporation of graphene for its strength, and high thermal conductivity (3000–5000 W m–1 K–1 depending on the form of graphene and method of measurement).Citation4–9 From these values, it can be seen that, if graphene was dispersed throughout a copper deposit, the thermal conductivity of that nanocomposite coating would be greatly enhanced. On the other hand, silicon carbide could be incorporated into a copper matrix to produce a coating with enhanced hardness and wear resistance. Copper MMNC coatings, containing nanoparticles such as graphene, carbon nanotubes, synthetic diamond, and black iron oxide (Fe3O4) would be welcomed in industries involved with electronics, aerospace, and renewable energy, as mechanical demand of materials increases.Citation1 Tribological coating property improvements will enhance sustainability by having increased lifetimes and requiring less material. Improving heat flow in electrical circuits allows for smaller circuits, increased computing power and an increase in efficiency.
Typically, copper nanocomposites are produced by both electrochemical and mechanical methods. Mechanical alloying (milling) has been used to produce copper nanocomposites containing ceramics such as ZrO2Citation10 and Al2O3.Citation11 Fathy et al.Citation10 found improved mechanical properties however trial and error had to be used to find operating parameters and the milling took 15 h to produce a sufficient dispersion of copper and ZrO2. The composition was found to be variable and high temperatures and pressures were needed. Salahi and RajabiCitation11 investigated two methods: solid solution which involved milling CuO and a Cu-Al solid solution powder together for 100 h, and direct mixing which milled pure copper and alumina powder together for 100 h. Both of these methods showed enhanced mechanical properties and achieved an alumina content of 20 vol.% but again high temperatures and pressures were required to press the final sample and the milling takes a long time, meaning it isn’t viable for industrialisation.
Bhat and Bourell used a combination of mechanical and electrochemical methods by sintering graphite (Gr) and silicon carbide to produce a porous matrix into which copper was electrodeposited using DC plating.Citation12 Poor adhesion was experienced around the SiC structure but a high wear resistance was observed. The Cu-Gr composite had a very low friction coefficient and had better adhesion. Again, mechanical properties were improved compared to the copper alloy substrate and the distribution of additive is highly controllable, however the process is not well explored, is multistep and yet to be industrialised.
Exclusively used, electrochemical methods involve the copper (among other metals) and particle additive being codeposited by direct current (DC) or pulsed current plating (PCP)Citation13–17 and comprehensive reviews have been conducted of these by Low et al.,Citation18 and Walsh and Ponce de Leon.Citation19 During DC plating, a constant current is held over a set period of time. PCP incorporates short periods of no applied current (called the ‘off-time’) between pulses of applied current to allow charge build-up to dissipate and for the replenishing of species near the electrode surface. Gül et al.Citation20 demonstrated that pulse deposition with carbon nanotubes (CNTs) improves mechanical properties including microhardness, wear resistance and lubricity, however no quantitative data representing the CNT content of the coatings were presented. PRP, however, uses a reversed current pulse instead of the off-time. If combined with a negative charge on the particles this creates a delivery mechanism model for nanoparticles to be brought to the electrode surface.
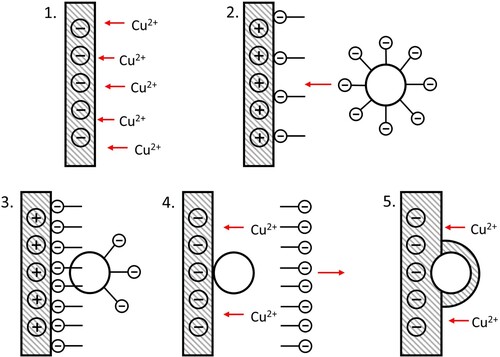
During the cathodic step (step 1), copper cations are attracted to the working electrode where they are reduced to copper metal. Step 2: During the anodic step following this, the pulse polarity is reversed and the nanoparticles surrounded by anionic surfactant molecules are attracted towards the working electrode surface. Step 3: During the anodic pulse, the nanoparticle becomes adsorbed on the surface of the WE aided by the presence of anionic surfactant. Step 4: the cathodic step returns, repelling the anionic surfactant away and continuing the deposition of copper. Finally, in step 5 some adsorbed particles are encapsulated by the growing metallic matrix.
Joseph et al.Citation21 and Pavithra et al.Citation22 both demonstrated the use of pulse reverse plating (PRP) with short (millisecond) pulses in the production of copper MMNCs. Both researchers utilised the anodic pulse only to remove loosely bound copper atoms, impurities and additive from the working electrode to improve the uniformity and internal stress of the coatings. They both found that PRP gives more uniform composites and again enhanced properties were observed. Podlaha published two articles describing the use of PRP to produce copper nanocomposites, noting the use of long pulses (seconds to minutes instead of milliseconds) to increase the number of particles within the coating.Citation23,Citation24 These works also only used the reverse pulse for the dissolution of a small amount of copper coating to enhance the concentration of particles within the coating and this produced high-efficiency, uniform plating, however they found a poorer reproducibility in the amount of alumina incorporated when using PRP compared to DC (a variation of 1–2 wt% vs 0.1–0.3 wt%). No literature was found in which the reverse (anodic) pulse is utilised to assist the inclusion of particles within the copper composite. The model presented in this work uses the mechanism presented in to consistently control the content of nanoparticles within the matrix along with improving the characteristics and mechanical properties of the coating, as demonstrated by previous researchers above. To date, the PRP method has been successfully applied to produce cobalt-MMNC coatings containing silicon carbide (SiC) and alumina (Al2O3) nanoparticles but the general mechanism for producing these coatings has not yet been explored sufficiently to be generally applied to any given system.Citation25,Citation26
Figure 1. Schematic diagram showing the process of Pulse Reverse Plating (PRP) in 5 steps. (1) cathodic phase, Cu2+ reduced to Cu metal, (2) anodic phase, anionic surfactant attracted to working electrode, (3) particles with adsorbed anionic surfactant are attracted to working electrode, (4) cathodic phase, anionic surfactant repelled away from electrode, and (5) copper continues to plate and entraps particle.
Typically, copper plating baths are operated at low pH (1–2). This is used to prevent copper hydroxide precipitate forming in solution and then adhering to the electrode surface, causing passivation layers and poor adhesion. However, a low pH is unsuitable for PRP with nanoparticles as the greater concentration of H+ ions present competes with the nanoparticles for the negatively-charged surfactant molecules, therefore, ‘turning off’ the electrophoretic effect stage of the nanoparticle delivery process. In addition, there may be local pH increases around the working electrode due to the reduction of H+ ions during the cathodic step. If this increases significantly, this could still cause insoluble copper hydroxide to form, despite the bulk solution pH being lower than necessary for formation. Due to this, an optimal bath composition and sufficiently wide operating pH window need to be found in which copper hydroxide is made unstable by producing more stable copper complexes with complexants. A way to tackle this without the extensive use of trial and error and many experiments with the vast number of possible variables is to use speciation simulation software. This software can predict the speciation within a plating bath of varying composition at varying pHs, meaning that a user can screen multiple electrolyte options quickly and effectively.
It has therefore been the aim of this work to model electrolyte compositions for copper plating in speciation simulation software to screen for theoretically effective baths in the operating pH window of 4–5. To be ‘effective’, copper hydroxide must not be stable or the preferred species at any pH. Further to this, UV-Vis spectrophotometry assesses the stabilising effect of each potential complexant (gluconate and glycine) on copper ions and confirms any change of species occurring. Finally, copper coatings will be produced using pulse-reverse plating from these various bath compositions to test the reliability of the simulations and find an optimum bath composition to lead onto MMNC coating production.
2. Experimental
Hyperquad Simulation and Speciation (HySS) software was used to produce speciation plots.Citation27 The reagents and potential species present in the electrolytes were inputted into the software along with their corresponding equilibrium constants and solubility constants of precipitates – these can be found in . Concentrations of complexant were adjusted and speciation plots were produced to predict the speciation across a pH range of 1–10.
Table 1. Table of stability constants (log β) for each species predicted in solution.
The chemicals used in this work were copper sulphate pentahydrate (Alfa Aesar, 99%), boric acid (Prime Chemicals, 99.5%), sodium D-gluconate (Alfa Aesar, 97%), glycine (Aldrich, 98%), and sodium hydroxide (Fisher Scientific, ≥99.5%). Gluconate was chosen due to its multidentate capabilities as a complexant and glycine was chosen as it is zwitterionic, meaning that it can also have bidentate capabilities. A stock baseline plating bath was prepared with no complexants, consisting of 0.25 mol dm–3 CuSO4·5H2O and 0.5 mol dm–3 H3BO3 dissolved in deionised water. This plating bath has a high throwing power (meaning uniform coatings can be produced on an irregularly shaped electrode), is low cost and carries significantly lower safety risk than alternatives.Citation28 This baseline bath was then used to produce solutions containing 0.1, 0.3, 0.5 mol dm–3 of each complexant (gluconate or glycine). These concentrations were chosen to simulate three scenarios in equal step increases: one where the complexant concentration is less than that of the metal ion, one where the two concentrations are almost equal and one where the concentration of the complexant is double that of the metal ion.
UV-Vis spectroscopy was performed using a Mettler Toledo UV5Bio spectrometer, between wavelengths of 400 and 1100 nm, with a 1 cm polystyrene cuvette. The solutions were diluted to 33% by volume in order for the absorbance maxima to be in the range 0.5–1.5 units. Data presented in this study were normalised using the absorbance maximum at ca. 808 nm to aid in determining peak wavelength change.
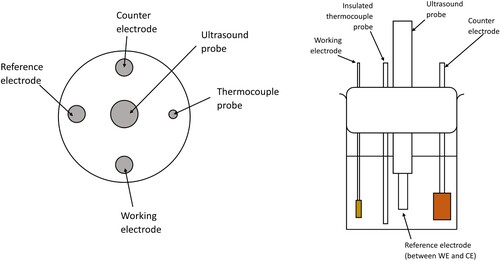
The substrate used for the working electrode was brass Hull cell panels (Schloetter, 99.5%) cut into 5 × 10 mm rectangles, and spot-welded to Nichrome wire (Arcor Electronics, 99.9%). Before deposition, the working electrode was cleaned with soap and water, degreased with isopropanol, rinsed with deionised water and dried in air. For the pulse-reverse plating, a copper (Sigma Aldrich, 99%) anode of dimensions 20 × 10 × 5 mm, and an Ag/AgCl reference electrode containing 3.0 M KCl were employed. The electrodes and hot plate thermocouple were held approximately 25 mm apart in a custom-made jig with an ultrasound probe in the centre (diagram shown in ). The pH of each solution was recorded at the start and end of the experiment using a Thermo Scientific™ Orion 3-Star Benchtop pH Meter to check that the pH range was between 4 and 5 and the solution pH was corrected using either 1M NaOH or H2SO4 solution. Typically, the pH had to be increased to between 4 and 5 using 10–20 cm3 of 1 M NaOH solution, depending on the concentration of complexant. Copper coatings were produced by pulse-reverse plating at 30°C, using an Autolab potentiostat controlled by the Nova 2.1 software by Metrohm, with the following conditions: cathodic current: −0.04 A (−4 A dm–2), cathodic time, tc = 60 s, anodic current: +0.04 A (+4 A dm–2), anodic time, ta = 10 s, and the number of cycles was 60, producing a total cathodic time of 3600 s. To avoid dissolution of the brass electrode, a thin strike layer of copper was galvanostatically plated for 300 s at the beginning of the plating process with DC. Agitation in the form of turbulent electrolyte flow was provided by an octahedral PTFE magnetic stirrer with dimensions 20 × 8 mm at 180 rpm and an ultrasonic (Masonic Sonicators S-4000-010) Ti horn at 20 W of power.
Cross-sectional images were assessed using a Thermo Fisher Scientific™ Quanta™ Field Emission Gun (FEG) 650 Environmental Scanning Electron Microscope (ESEM) in back-scattered electron mode using a magnification of 2000x.
Figure 2. Schematic diagram showing the layout of electrodes, ultrasound probe and thermocouple probe in a jig placed in the top of a 250 mL beaker, from the top view (L) and the side view (R).
3. Results and discussion
3.1. Modelling with HySS
Producing speciation plots with HySS allows prediction of bath chemistry and composition across a wide pH range, without the need to run extensive experiments. The plating bath required for the electrodeposition of copper nanocomposites has an optimal operating pH window of 4–5. It is therefore necessary to screen plating bath compositions quickly to determine which complexes are present in solution and which composition of complexants provides complete hydroxide instability in and around that pH window. The speciation plots show the proportions of speciation in % relative to the concentration of copper ions as the solution pH changed. It is important to note and consider that these simulations are based on thermodynamic data and do not consider kinetics, unusual species that may form, or interactions between complexes.
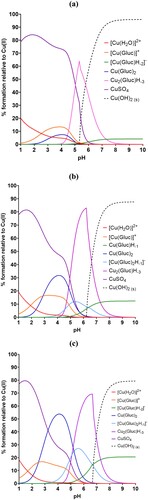
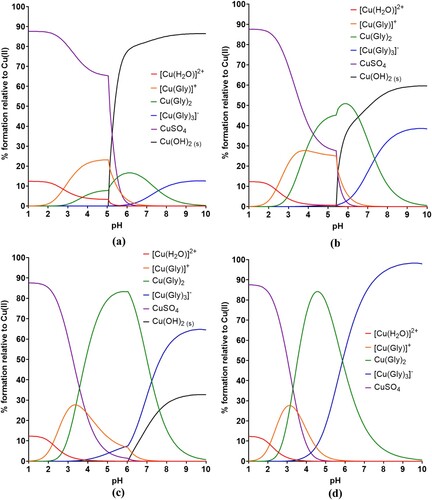
shows the speciation plots of a 0.25 mol dm–3 copper sulphate pentahydrate and 0.5 mol dm–3 boric acid electrolyte across a pH range of 1–10, when the concentration of gluconate is 0.1, 0.3 and 0.5 mol dm–3. When the concentration of sodium D-gluconate is 0.1 M ((a)), copper hydroxide starts to form around pH 5.3. By pH ∼6, the hydroxide species dominates the speciation in the electrolyte, competing only with a triply deprotonated dimerised copper-gluconate complex, [Cu2(Gluc)H-3]. Taking into account that the operating pH of the copper plating bath has to be higher than typical copper plating baths to keep H+ concentration low, this does not leave sufficient leniency around the operating pH window of 4–5. As the concentration of sodium D-gluconate is increased to 0.3 M (close to the concentration of metal ion), from ∼pH 5 the [Cu2(Gluc)H-3] complex takes over speciation in the plating bath completely, and copper hydroxide is destabilised until approximately pH 6.2. Further stabilisation is seen again when the concentration of gluconate is 0.5 M (twice the concentration of metal ions) as the copper hydroxide formulation moves to pH 6.7. This is a promising result, however complete understanding of speciation in a gluconate bath is still lacking as there is evidence elsewhere of additional dimers which were not considered in this work.Citation29 Hydroxide is still theoretically formed fairly close to the operating pH window, however, this isn’t consistent with results seen in Section 3.2.
Figure 3. Speciation plots from the data produced by HySS software for 0.25 mol dm–3 copper sulphate and 0.5 mol dm–3 boric acid plating bath with varying concentrations of gluconate: (a) 0.1, (b) 0.3, and (c) 0.5 mol dm–3.
A reason for gluconate’s complex stabilising effect could be that it is a chelating agent. A chelating agent is a ligand which can form multiple coordination bonds between itself and a metal ion. As shown in , gluconate has multiple sites with lone pairs of electrons which can be donated to the empty energy levels within a copper ion. With each deprotonation of the gluconate species, a new coordination site can form, meaning that in the [Cu(Gluc)H-2]- gluconate is likely a tridentate ligand. In this event, the species can ‘wrap’ itself around the metal species shielding it from external species, such as hydroxide.
Figure 4. Structure of gluconate ion, with dots representing lone pairs of electrons.
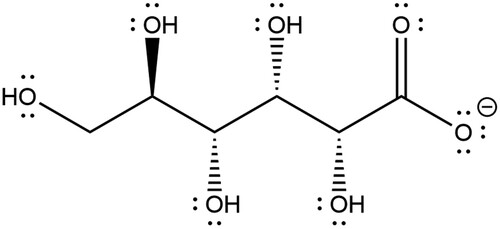
The ‘chelate effect’ describes the preference for metal ions to bond with chelating ligands rather than monodentate ligands, which are species with only one lone pair and therefore only one binding point. Chelating ligands are more stabilising than monodentate ligands due to the resulting reduction in entropy (disorder) when the complexes are formed.
The corresponding speciation plots for glycine can be found in . As shown in (a), when the concentration of glycine in solution is less than that of the copper species (0.1 M), hydroxide begins to form around pH ∼5 and becomes the dominant species very quickly. As the concentration of glycine almost equals the concentration of copper, copper glycinate forms and dominates between pH 4.3 and 6 but copper hydroxide again becomes dominant and competes only with a tris(glycinato) copper species. When copper and glycine are in a 1:2 ratio, the mono-, di- and tri- glycine complexes all form at progressively lower pHs and are more prominent, though copper hydroxide is formed from pH 6 and is the second most dominant species behind the triglycine species past pH ∼7.5. Due to the presence of a tris(glycinato) copper complex, a metal:ligand ratio of 1:3 was investigated also. In this event, copper hydroxide is completely destabilised and never forms, as the mono-glycine complex is stable between 3.5 and 6, at which point the tris(glycinato) complex forms and is the prominent species. This only happens in the gluconate bath when the metal:ligand ratio is at least 1:10. Glycine is therefore a potentially promising complexant in a 1:3 metal:ligand ratio. Glycine is zwitterionic, meaning that it has both a positive and negative charge. A proton can transfer from the carboxyl group to the amino group and back again therefore it cycles between a glycinium cation at low pH to a glycinate anion at high pH, forming a zwitterion at neutral pH. Glycine is likely to be a better complexing agent when it has more lone pairs available at higher pH, however a higher pH bath is also likely to lead to more hydroxide being formed. Further investigation will be carried out in future work to investigate how these species bind and form complexes.
Figure 5. Speciation plots from the data produced by HySS software for 0.25 mol dm–3 copper sulphate and 0.5 mol dm–3 boric acid plating bath with varying concentrations of glycine: (a) 0.1, (b) 0.3, (c) 0.5 and (d) 0.75 mol dm–3.
3.2. UV-vis as confirmation of species
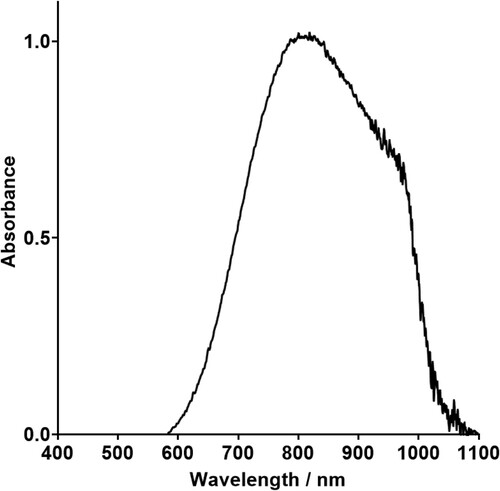
The baseline bath, containing copper sulphate and boric acid with no complexants, has a UV-Vis absorbance peak at ca. 809 nm (). This is right at the edge of the wavelength range for visible light, at the ‘red’ end of the spectrum, producing the solution’s strong blue colour. The copper ions in this bath are expected to have an octahedral structure, with 6 water molecules surrounding the copper ion, [Cu(H2O)6]2+.
Figure 6. UV-Vis absorption of electrolyte containing 0.25 M CuSO4·5H2O and 0.5 M B(OH)3 without any complexants.
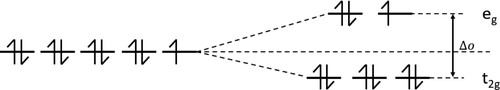
When complexants are added to the baseline electrolyte, the complexant ligand will exchange with these H2O ligands. The resulting complex will be more stable and therefore will have a lower peak wavelength. This can be explained by the Crystal Field Theory. Transition metals, such as copper, undergo d-orbital splitting as ligands approach them to bind. Copper(II) has a dCitation9 electron configuration meaning that it has 9 electrons in its 3d orbitals, which split into 2 energy levels as shown in . The energy gap between these levels is the Crystal Field Stabilisation Energy (CFSE), marked Δo in the diagram. The greater the CFSE, the more stable a complex is, therefore the complexants investigated in this work need to be stronger field ligands, to increase the CFSE sufficiently to stabilise the complex but not excessively as this will require a greater overpotential to reduce the copper ions in the electrodeposition process, resulting in a thinner deposit.
Figure 7. Crystal Field Splitting Energy (CFSE) pattern for a Cu2+ ion in a complex.
[Cu(H2O)6]2+ also undergoes Jahn–Teller distortion. This is the elongation or compression of the bonds along the z axis, and occurs in any complexes where there are degenerate electronic ground states, however it is more evident when the degenerate energy levels are unevenly filled, such as in Cu(II) complexes. This distortion removes the degeneracy by making the z axis orbitals lower in energy, and can be seen in UV-Vis spectra by the presence of split peaks. shows peaks with two ‘humps’, indicating elongation of the z-axis Cu-O bonds. The disappearance of these indicates the change of speciation and stabilising effect of complexants added.
UV-Vis spectrophotometry was used to assess the stabilising effect of each complexant. If the complexant stabilises the copper complex, the peak absorbance wavelength should decrease and shift towards the blue end of the spectrum, as per Equation (1), in which h is Planck’s constant and c is the speed of light.
(1)
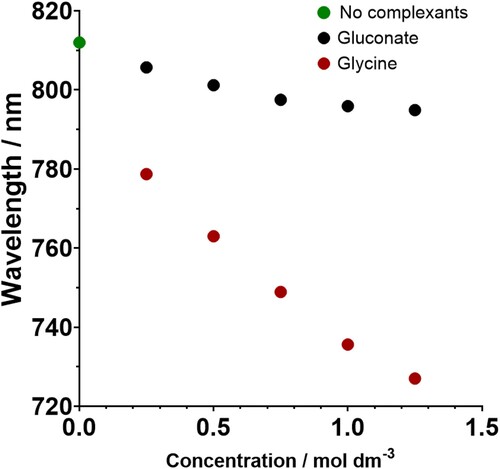
(1) By observing the visual and peak wavelength changes in solutions of increasing molar equivalents of complexant, in 0.25 M steps, this work aimed to investigate whether a 1:1 exchange of H2O for ligand occurs, or, if not, what the denticities are of the ligands. Based on the speciation plots, only a maximum of 3 ligands are ever substituted, therefore a potential of up to 5 ligand exchanges was investigated to ensure that the speciation plots were reliable.
The addition of molar equivalents of sodium D-gluconate to the baseline copper plating bath results in a slight increase in colour intensity, but no change to colour hue (). This change is very weak compared to the other complexants, and the UV-Vis spectra show a slight blue-shift shift of 10–20 nm with increasing gluconate content. This change could be related to a solvatochromic shift, which is caused by a change in the solvation shell around the metal complex,Citation30 rather than a change in the copper coordination environment. It is possible that the copper ions retain the hexaqua coordination, while gluconate counter ions surround the copper complex. However, speciation plots indicate that gluconate is somewhat stabilising and that copper-gluconate complexes do in fact form, as also seen in the literature.Citation31–33 These spectroscopic results may suggest that either the gluconate does not coordinate to the copper ions, or that the copper ions do not bind with the gluconate in a 1:1 molar ratio. The complexes present would have to be investigated further and confirmed in future work using analytical methods including FT-IR, X-ray crystallography and EXAFS, as this is beyond the scope of the present work.
Figure 8. Photographs of (1) baseline copper sulphate and boric acid electrolyte, with increasing concentrations of gluconate (2–6) and glycine (7–11) in steps of 0.25 M, up to 1.25 M. The measured pHs of each solution are labelled below each sample vial.
There is a very clear and strong increase in colour intensity as the concentration of glycine increases and the samples are much more intensely coloured than the gluconate samples. The UV-Vis spectrum shows a shift in peak wavelength from ∼808 nm in the baseline bath to ∼726 nm when there is 1.25 M glycine in the solution, which is a maximum shift of 82 nm, compared to only 10–20 nm in the gluconate bath (). The wavelength continues to shift to the blue end of the spectrum the more glycine is added up until 0.75 M, implying that an additional glycine molecule substitutes into the copper complex with each addition of complexant until 3 are coordinated, likely in a bidentate manner. This corresponds with the HySS-generated plots as they show 3 different copper-glycine complexes formed.
Figure 9. A graph showing the change in wavelength at peak absorbance when the concentration of complexant within an electrolyte is increased in increments of 0.25 M. The measured pHs of the solutions are shown in .
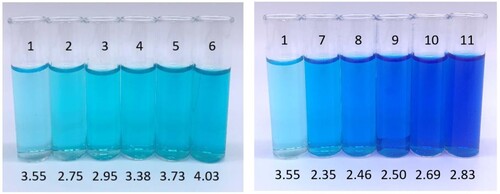
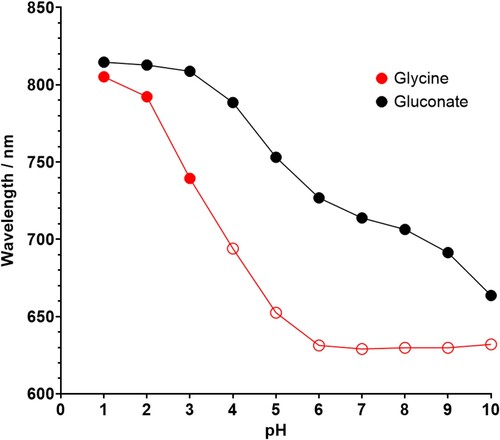
A further investigation looked at a pH series for each complexant to observe whether speciation changes were seen at the pH indicated in the speciation plots. The solution containing 0.5 M gluconate and the solution containing 0.75 M glycine were corrected to pH 1–10, photographed and analysed using UV-Vis spectrophotometry.
As seen in , the hue and intensity of the electrolyte colour increases in both cases. In the 0.5 M gluconate series, there is a distinct visual change between pH 2–3 and pH 5–6. This fits with the speciation plot which shows a change of dominant species at each of these points. This is mirrored in which shows that gluconate doesn’t have as much of a stabilising effect at lower pHs as glycine, however, from pH 3 onwards, there are several large drops in wavelength. This is consistent with the prediction that between pH 3 and 7, there are some copper-gluconate complex changes. Despite this, no observed copper hydroxide precipitate formed. This is likely because there is an additional dimerised species that hasn’t been acknowledged in this study. In the 0.75 M glycine series, there is again a clear visual change between pH 2–3, indicated in the speciation plot by the formation of bis(glycinato) copper which is again mirrored in the pH series in by significant CFSE gap changes. Despite this, the speciation plot shows no hydroxide should be formed, however, there is an obvious precipitate observed in the sample from pH 4 onwards. Solid copper glycinate can be ruled out as the solubility product constant is included in the plot data. Copper hydroxide is more likely, especially as copper hydroxide is amphoteric so will dissolve back into solution at high pHs. In the pH series of glycine, the quantity of precipitate does appear to diminish as higher pHs are reached. This would have to be explored further in future work, along with confirmation of the solid present. From pH 6 to 10, there is negligible wavelength change. As discussed previously, the glycine bath precipitated out from pH 4 so to carry out UV-Vis analysis, the heterogeneous solution was filtered through a 0.2 micron PTFE pipette filter and liquid was analysed. Due to this, it is unclear how reflective the UV-Vis results are of the bath speciation but does confirm that the species changes predicted do occur and are very stabilising.
Figure 10. Photographs of copper sulphate and boric acid electrolyte containing (a) 0.5 M gluconate, and (b) 0.5 M glycine, corrected to each pH between 1 and 10 using 3M NaOH.
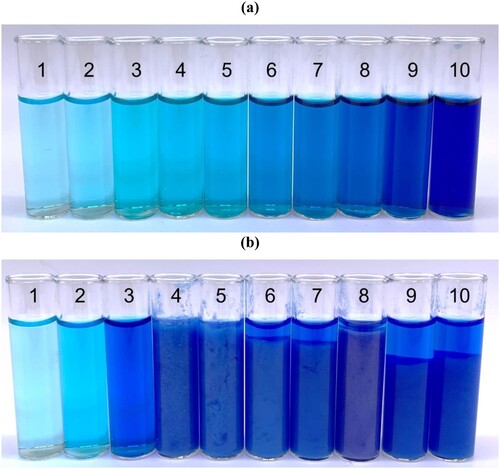
Figure 11. A graph to show the change in wavelength at peak absorbance when the pH of the copper sulphate and boric acid electrolyte containing 0.5 M gluconate (black line) and 0.5 M glycine (red line) is corrected to the pHs between 1 and 10 using 3 M NaOH. Note that the unfilled red points represent the glycine solutions containing precipitate where the filtrate was analysed.
3.3. Pulse plating with optimal baths
Pulse-reverse plating was operated on the baths containing varying concentrations of complexant to support the hypothesis determined from the speciation plots that the hydroxide formation in a bath can be predicted without experimentation to determine the most effective plating bath compositions to investigate, and from the UV-Vis spectroscopy which proved that the speciation expected in solution is as predicted. Plating thickness can also be compared between the baths to establish whether the stability of copper species affects current efficiency.
(a) shows that when the concentration of gluconate is less than that of copper ions, the deposit produced is non-uniform, nodular and contains distinct hydroxide layers. When the concentration of gluconate and copper are almost equal ((b)), there are layers present but they are significantly thinner, and the surface appears to be less nodular, but not flat. It is also important to note the through-thickness cracking in the coating, though this does not come under the scope of the present work. When the concentration of gluconate is increased to double that of the copper ions, ((c)) a coating is produced with no hydroxide layers visible. The surface is still slightly nodular but the coating uniformity clearly improves as more gluconate is added. The coating thickness remains fairly consistent throughout the samples, implying that the stability of the copper species does not change sufficiently to reduce the current efficiency of the bath. This result is supported by the HySS plots and the UV-Vis which shows a mild to moderate amount of stabilisation when gluconate is added to the bath.
Figure 12. Backscattered SEM images of the cross-sections of a copper deposit on a brass substrate after pulse-reverse plating from a plating bath containing varying concentrations of: (a) 0.1, (b) 0.3 and (c) 0.5 mol dm–3 sodium D-gluconate and (d) 0.1, (e) 0.3 and (f) 0.5 mol dm−3 glycine.
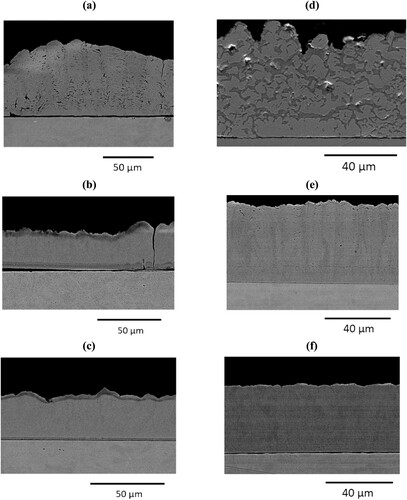
(d–f) shows the destabilisation of hydroxide by forming copper-glycine complexes. In (d), thick hydroxide layers can very clearly be seen, underneath a very nodular surface. Increasing the concentration of glycine to slightly more than the copper ions ((e)), layers are still seen in the deposit, but they are significantly diminished. This is supported by the speciation plot which shows a reduction in the production of hydroxide, but it is still dominant above pH 6.5 which is close to the operating pH window used. The surface of the deposit is also becoming more uniform. As the concentration is increased to double that of the copper ions, a uniform, almost flat deposit is produced with no layering. The predicted speciation shows a triglycinate copper complex. This means that when the glycine concentration is increased to 0.75 mol dm–3 (three times the copper ion concentration), all copper ions within the plating bath can form complexes with 3 glycine molecules each, producing species with much tighter metal–ligand interactions than metal-hydroxide. This would in theory produce a consistent deposit with no layering. Despite this, a precipitate forms past pH 4 in this bath, therefore, when the electrolyte is used at the required pH of 4–5, the bath will be unusable. This means that, going forwards, a copper sulphate and boric acid electrolyte containing either 0.5 M gluconate or 0.5 M glycine would be suitable.
4. Conclusion
Within this work, suitable formulations of copper plating electrolyte were determined and applied to electrodeposition experiments. It has been confirmed that modelling of electroplating bath chemistry can be used as a suggestive baseline to screen for effective compositions of complexants without the need for multiple trial and error experiments as the presence or absence of copper hydroxide predicted in the plots were consistent with the presence or absence of layering in the SEM cross-sections. Despite this, it is necessary to investigate potential unpredicted species, local pH changes and mass transport activity at the working electrode further to determine the validity of any assumptions made. From the speciation plots produced in HySS and the UV-Vis concentration series, glycine is the better complexing agent. This is because the hydroxide is completely destabilised by the more stable metal–ligand complex being the preferred species across the required pH range. Despite this, the complexes formed in the best bath are insoluble past pH 4. Gluconate also proved to be an effective complexant, displaying less of a stabilising effect (151.0 nm of shift vs 173.2 nm for glycine) but a better solubility across the entire pH range. When practical plating experiments using PRP were carried out using baths of varying complexant concentration, glycine produced promising deposits with no layering at 0.5 mol dm−3. Further work will look to introduce nanoparticles and surfactant to the electrolytes, combine complexants to gain benefits from each and explore the speciation within the copper electrolytes using a range of spectroscopic techniques, including X-ray crystallography, UV-Vis, electrochemical techniques and thermal analysis.
Acknowledgements
Paper based in part on a presentation given at the EDNANO14 Conference and 10th European Pulse Plating Seminar hosted by EAST Forum, 9–10 June, 2022, Kraków, Poland. The authors would like to thank the University of Leicester for funding.
Disclosure statement
No potential conflict of interest was reported by the author(s).
References
- P. H. C. Camargo, K. G. Satyanarayana and F. Wypych: Mater. Res., 2009, 12(1), 1–39.
- C. G. Fink and J. D. Prince: Trans. Am. Electrochem. Soc., 1928, 54, 315–321.
- W. M. Haynes. ‘CRC handbook of chemistry and physics: a ready-reference book of chemical and physical data’; 2017, FL, CRC Press.
- A. A. Balandin, S. Ghosh, W. Bao, I. Calizo, D. Teweldebrhan, F. Miao and C. N. Lau: Nano Lett., 2008, 8(3), 902–907.
- M. Sang, J. Shin, K. Kim and K. J. Yu: Nanomaterials (Basel), 2019, 9(3), 374.
- A. A. Balandin: Nat. Mater., 2011, 10(8), 569–581.
- S. Chen, Q. Wu, C. Mishra, J. Kang, H. Zhang, K. Cho, W. Cai, A. A. Balandin and R. S. Ruoff: Nat. Mater., 2012, 11(3), 203–207.
- S. Chen, A. L. Moore, W. Cai, J. W. Suk, J. An, C. Mishra, C. Amos, C. W. Magnuson, J. Kang, L. Shi, et al.: ACS Nano, 2011, 5(1), 321–328.
- F. Schwierz: Proc. IEEE, 2013, 101(7), 1567–1584.
- A. Fathy, A. Wagih and A. Abu-Oqail: Ceram. Int., 2019, 45(2), 2319–2329.
- E. Salahi and A. Rajabi: Mater. Sci. Technol., 2016, 32(12), 1212–1217.
- A. Bhat and D. Bourell: Mater. Sci. Technol., 2014, 31(8), 969–974.
- S. Ramalingam, V. S. Muralidharan and A. Subramania: Surf. Eng., 2013, 29(7), 511–515.
- Y.-g. Zhang, W.-c. Sun, M. Ma, S.-s. Tian, Y.-w. Liu and Y. Xiao: Surf. Eng., 2021, 37(6), 702–711.
- A. Moein and S. Rastegari: Surf. Eng., 2020, 36(9), 982–989.
- J.-s. Chen, B. Qiao and J.-M. Yang: Adv. Compos. Mater., 2012, 21(3), 233–240.
- Y. W. Yao, S. W. Yao and L. Zhang: Mater. Sci. Technol., 2008, 24(2), 237–240.
- C. T. J. Low, R. G. A. Wills and F. C. Walsh: Surf. Coat. Technol., 2006, 201, 371–383.
- F. C. Walsh and C. Ponce de Leon: Trans. IMF, 2014, 92(2), 83–98.
- H. Gül, M. Uysal, H. Akbulut and A. Alp: Acta Phys. Pol., A, 2014, 125(2), 254–256.
- A. Joseph, B. Kirubasankar, A. M. Mathew, M. Narayanasamy, C. Yan and S. Angaiah: Appl. Surf. Sci. Adv., 2021, 5, 100116.
- C. L. Pavithra, B. V. Sarada, K. V. Rajulapati, T. N. Rao and G. Sundararajan: Sci. Rep., 2014, 4, 4049.
- E. J. Podlaha: Nano Lett., 2001, 1(8), 413–416.
- E. J. Podlaha and D. Landolt: J. Electrochem. Soc., 1997, 144(7), L200–L202.
- D. Albusalih, S. Gill, D. Weston and F. Altmann: Trans. IMF, 2019, 97(4), 203–216.
- D. Weston, D. Albusalih, D. Statharas, S. Gill, N. J. Weston and H. Hilton-Tapp. Nanocomposite Co-nSiC coatings electrodeposited from cobalt-gluconate bath Via pulse reverse plating technique with anionic surfactant, U. o. Leicester, Editor. 2023: SSRN.
- L. Alderighi, P. Gans, A. Ienco, D. Peters, A. Sabatini and A. Vacca: Coord. Chem. Rev., 1999, 184, 311–318.
- J. W. Dini and D. D. Snyder: ‘Electrodeposition of Copper’, in ‘Modern Electroplating’, (ed. M. Schlesinger, et al.), 5th edn, 2010, NJ, John Wiley & Sons, Inc.
- D. T. Sawyer: Chem. Rev., 1964, 64(6), 633–643.
- S. Mai, B. Ashwood, P. Marquetand, C. E. Crespo-Hernandez and L. Gonzalez: J. Phys. Chem. B, 2017, 121(20), 5187–5196.
- S. S. Abd El Rehim, S. M. Sayyah and M. M. El Deeb: Appl. Surf. Sci., 2000, 165, 249–254.
- M. Vicedomini: J. Coord. Chem., 1983, 12(4), 307–312.
- A. D. Toy and T. D. Smith: J. Chem. Soc. (A), 1971, 2925–2929.
- R. M. Smith and A. E. Martell: ‘Critical stability constants second supplement’; 1989, New York, Springer Science+ Business Media.
- Y. Z. Hamada: J. Nanomedicine Res., 2017, 5(4), 00123.