
 ?Mathematical formulae have been encoded as MathML and are displayed in this HTML version using MathJax in order to improve their display. Uncheck the box to turn MathJax off. This feature requires Javascript. Click on a formula to zoom.
Abstract
We propose a new, data-driven approach for efficient pricing of – fixed- and floating-strike – discrete arithmetic Asian and Lookback options when the underlying process is driven by the Heston model dynamics. The method proposed in this article constitutes an extension of Perotti and Grzelak [Fast sampling from time-integrated bridges using deep learning, J. Comput. Math. Data Sci. 5 (2022)], where the problem of sampling from time-integrated stochastic bridges was addressed. The model relies on the Seven-League scheme [S. Liu et al. The seven-league scheme: Deep learning for large time step Monte Carlo simulations of stochastic differential equations, Risks 10 (2022), p. 47], where artificial neural networks are employed to ‘learn’ the distribution of the random variable of interest utilizing stochastic collocation points [L.A. Grzelak et al. The stochastic collocation Monte Carlo sampler: Highly efficient sampling from expensive distributions, Quant. Finance 19 (2019), pp. 339–356]. The method results in a robust procedure for Monte Carlo pricing. Furthermore, semi-analytic formulae for option pricing are provided in a simplified, yet general, framework. The model guarantees high accuracy and a reduction of the computational time up to thousands of times compared to classical Monte Carlo pricing schemes.
1. Introduction
A non-trivial problem in the financial field is the pricing of path-dependent derivatives, as for instance Asian and Lookback options. The payoffs of such derivatives are expressed as functions of the underlying process monitored over the life of the option. The monitoring can either be continuous or discrete. Depending on different specifications of the underlying dynamics, only a few case-specific theoretical formulae exist. For example, under the Black-Scholes and Merton log-normal dynamics, closed-form formulae were derived for continuously-monitored geometric Asian options (see, for instance, Devreese et al. [Citation8]). In the same model framework, Goldman et al. [Citation10], Conze [Citation6] derived an analytic formula for the continuously-monitored Lookback option, using probabilistic arguments such as the reflection principle. However, options whose payoffs are discretely-monitored are less tractable analytically, and so approximations are developed, as for the discrete Lookback option under the lognormal dynamics [Citation15]. Furthermore, stochastic volatility frameworks are even more challenging for the pricing task, where no applicable closed-form theoretical solutions are known.
Whenever an exact theoretical pricing formula is not available, a rich literature on numerical methods and approximations exists. The three main classes of approaches are Monte Carlo (MC) methods (e.g. [Citation16]), partial differential equations (PDEs) techniques (see the extensive work in [Citation27,Citation28]), and Fourier-inversion based techniques (among many relevant works, we report [Citation3,Citation31]).
Monte Carlo methods are by far the most flexible approaches, since they neither require any particular assumption on the underlying dynamics, nor on the targeted payoff. Furthermore, they benefit from a straightforward implementation based on the discretization of the time horizon as, for instance, the well-known Euler-Maruyama scheme. The cost to be paid, however, is typically a significant computational time to get accurate results. PDE approaches are more problem-specific since they require the derivation of the partial differential equation which describes the evolution of the option value over time. Then, the PDE is usually solved using finite difference methods. Fourier-inversion-based techniques exploit the relationship between the probability density function (PDF) and the characteristic function (ChF) to recover the underlying transition density by means of Fast Fourier Transform (FFT). Thanks to the swift algorithm for FFT, such methods produce high-speed numerical evaluation, but they are often problem-specific, depending on the underlying dynamics. A relevant example is [Citation7], where a numerical method is proposed for the pricing of discrete arithmetic Asian options under stochastic volatility model dynamics. In the same group of techniques, we also refer to [Citation19] where a unified framework for the pricing of discrete Asian options is described, allowing for regime-switching jump diffusion underlying dynamics. A further example is [Citation21], where a close approximation of the classic Heston model is proposed – via the CTMC model – which allows for a general SWIFT-based (see [Citation20]) pricing approach with application to exotic derivatives, as discrete Asian options.
In this article, we propose a data-drivenFootnote1 extension to MC schemes that allows for efficient pricing of discretely-monitored Asian and Lookback options, without losing the flexibility typical of MC methods. We develop the methodology in the complex framework of the stochastic volatility model of Heston [Citation14], with an extensive application to the case of Feller condition not satisfied. Under this dynamics, we show how to price fixed- or floating-strike discrete Asian and Lookback options. Moreover, the pricing model is applied also for the challenging task of pricing options with both a fixed- and a floating-strike component. We underline that the strengths of the method are its speed and accuracy, coupled with significant flexibility. The procedure is, indeed, independent of the underlying dynamics (it could be applied, for instance, for any stochastic volatility model), and it is not sensitive to the targeted payoff.
Inspired by the works in [Citation22,Citation25], the method relies on the technique of Stochastic Collocation (SC) [Citation12], which is employed to accurately approximate the targeted distribution by means of piecewise polynomials. Artificial neural networks (ANNs) are used for fast recovery of the coefficients which uniquely determine the piecewise approximation. Given these coefficients, the pricing can be performed in a ‘MC fashion’ sampling from the target (approximated) distribution and computing the numerical average of the discounted payoffs. Furthermore, in a simplified setting, we provide a semi-analytic formula that allows to directly price options without the need of sampling from the desired distribution. In both situations (MC and semi-analytic pricing) we report a significant computational speed-up, without affecting the accuracy of the result which remains comparable with the one of highly expensive MC methods.
The remainder of the paper is as follows. In Section 2, we formally define discrete arithmetic Asian and Lookback options, as well as the model framework for the underlying process. Then, in Section 3, the pricing model is described. Two different cases are considered, in increasing order of complexity, to handle efficiently both unconditional sampling Section 3.2 and conditional sampling Section 3.3 for pricing of discrete arithmetic Asian and Lookback options. Section 4 provides theoretical support to the given numerical scheme. The quality of the methodology is also inspected empirically with several numerical experiments, reported in Section 5. Section 6 concludes.
2. Discrete arithmetic Asian and Lookback options
In a generic setting, given the present time , the payoff at time
of a discrete arithmetic Asian or Lookback option, with underlying process
, can be written as:
(1)
(1) where
is a deterministic function of the underlying process S, the constants
control the floating- and fixed-strikes of the option, and
. Particularly, discrete arithmetic Asian and Lookback options are obtained by setting the quantity
respectively as follows:
(2)
(2) with
a set of indexes,
, a discrete set of future monitoring dates, and ω as in (Equation1
(1)
(1) ).
Note that in both the cases of discrete arithmetic Asian and Lookback options, is expressed as a deterministic transformation of the underlying process' path, which is the only requirement to apply the proposed method. Therefore, in the paper, we refer always to the class of discrete arithmetic Asian options, often just called Asian options, for simplicity. However, the theory holds for both classes of products. Actually, the pricing model applies to any product with a path-dependent European-type payoff , requiring only a different definition of
.
2.1. Pricing of arithmetic Asian options and Heston framework
This section focuses on the risk-neutral pricing of arithmetic – fixed- and floating-strike – Asian options, whose payoff is given in (Equation1(1)
(1) ) with
in (Equation2
(2)
(2) ). By setting
or
, we get two special cases: the fixed- or the floating-strike arithmetic Asian option. From Equation (Equation1
(1)
(1) ), for
, the simplified payoff of a fixed-strike arithmetic Asian option reads:
(3)
(3) therefore, with the risk-neutral present value:
(4)
(4) where we assume the money-savings account
to be defined through the deterministic dynamics
with constant interest rate
. For
, however, the payoff in Equation (Equation1
(1)
(1) ), becomes the one of a floating-strike arithmetic Asian option:
(5)
(5) The payoff in (Equation5
(5)
(5) ) is less tractable when compared to the one in (Equation3
(3)
(3) ), because of the presence of two dependent stochastic unknowns, namely
and
. However, a similar representation to the one in Equation (Equation4
(4)
(4) ) can be achieved, allowing for a unique pricing approach in both cases. By a change of measure from the risk-neutral measure
to the measure
associated with the numéraire
, i.e. the stock measure, we prove the following proposition.
Proposition 2.1
Pricing of floating-strike arithmetic Asian option under the stock measure
Under the stock measure , the value at time
of an arithmetic floating-strike Asian option, with maturity
and future monitoring dates
,
, reads:
(6)
(6) with
, defined as:
where
is defined in (Equation2
(2)
(2) ).
Proof.
For a proof, see Appendix A.1.
Both the representations in Equations (Equation4(4)
(4) ) and (Equation6
(6)
(6) ) can be treated in the same way. This means that the present value of both a fixed- and a floating-strike Asian option can be computed similarly, as stated in the following proposition (see, e.g. [Citation13]).
Proposition 2.2
Symmetry of fixed- and floating-strike Asian option present value
Let us consider the process and the money-savings account
, for
. Then, the same representation holds for the value at time
of both fixed- or floating-strike Asian options, with maturity
, underlying process
, and future monitoring dates
,
. The present value is given by:
(7)
(7)
Proof.
The proof follows by direct comparison between Equations (Equation4(4)
(4) ) and (Equation6
(6)
(6) ).
When and
, Equation (Equation1
(1)
(1) ) is the payoff of a fixed- and floating-strikes arithmetic Asian option. Its present value does not allow any simplified representation, and we write it as the expectation of the discounted payoff under the risk-neutral measure
:
(8)
(8) By comparing Equations (Equation7
(7)
(7) ) and (Equation8
(8)
(8) ) a difference in the two settings is unveiled. Equation (Equation7
(7)
(7) ) is characterized by a unique unknown stochastic quantity
, whereas in (Equation8
(8)
(8) ) an additional term appears, namely the stock price at final time,
. Furthermore, the two stochastic quantities in (Equation8
(8)
(8) ) are not independent. This might suggest that different procedures should be employed for the different payoffs. In particular, in a MC setting, to value (Equation7
(7)
(7) ) we only have to sample from the unconditional distribution of
; while in (Equation8
(8)
(8) ) the MC scheme requires dealing with both the sampling of
and the conditional sampling of
.
Let us define the stochastic volatility dynamics of Heston for the underlying stochastic process , with initial value
, through the following system of stochastic differential equations (SDEs):
(9)
(9)
(10)
(10) with
,
the constant rate, the speed of mean reversion, the long-term mean of the variance process, the initial variance, and the volatility-of-volatility, respectively.
and
are Brownian Motions (BMs) under the risk-neutral measure
with correlation coefficient
, i.e.
.Footnote2 The dynamics in (Equation9
(9)
(9) ) and (Equation10
(10)
(10) ) are defined in the risk-neutral framework. However, Proposition 2.1 entails a different measure framework, whose dynamics still fall in the class of stochastic volatility model of Heston, with adjusted parameters (see Proposition Appendix A.1).
3. Swift numerical pricing using deep learning
This section focuses on the efficient pricing of discrete arithmetic Asian options in a MC setting. The method uses a Stochastic Collocation [Citation12] (SC) based approach to approximate the target distribution. Then, artificial neural networks (ANNs) ‘learn’ the proxy of the desired distribution, allowing for fast recovery [Citation22,Citation25].
3.1. ‘Compressing’ distribution with stochastic collocation
In the framework of MC methods, the idea of SC – based on the probability integral transformFootnote3 – is to approximate the relationship between a ‘computationally expensive’ random variable, say A, and a ‘computationally cheap’ one, say ξ. The approximation is then used for sampling. A random variable is ‘expensive’ if its inverse CDF is not known in analytic form, and needs to be computed numerically. With SC, the sampling of A is performed at the cost of sampling ξ (see [Citation12]). Formally, the following mapping is used to generate samples from A:
(11)
(11) with
and
being respectively the CDFs of A and ξ, and the function
a suitable, easily evaluable approximation of g. The reason why we prefer
to g, is that, by definition, every evaluation of g requires the numerical inversion of
, the CDF of A.
Many possible choices of exist. In [Citation12,Citation25],
is an
-degree polynomial expressed in Lagrange basis, defined on collocation points (CPs)
computed as Gauss-Hermite quadrature nodes, i.e.:
(12)
(12) where the coefficients
of the polynomial in the Lagrange basis representation, called collocation values (CVs), are derived by imposing the system of equations:
(13)
(13) which requires only M evaluations of g.
In this work, we define as a piecewise polynomial. Particularly, we divide the domain
of the random variable ξ (which for us is standard normally distributedFootnote4) in three regions. In each region, we define
as a polynomial. In other words, given the partition of the real line:
(14)
(14) for a certain
,
is specified as:
(15)
(15) where
is the indicator function, and
are suitable polynomials. To ensure high accuracy in the approximation,
is defined as a Lagrange polynomial of high-degree M−1. The CPs
, which identify the Lagrange basis in (Equation12
(12)
(12) ), are chosen as Chebyshev nodes in the bounded interval
[Citation9]. Instead, the CVs
are defined as in (Equation13
(13)
(13) ). The choice of Chebyshev nodes allows for increasing the degree of the interpolation (i.e. the number of CPs and CVs), avoiding the Runge's phenomenon within the interval
[Citation26]. However, the behaviour of
outside
is out of control. We expect the high-degree polynomial
to be a poor approximation of g in
and
. Therefore, we define
and
as linear (or at most quadratic) polynomials, with degree
and
, built on the extreme CPs of
.
Summarizing, ,
and
are all defined as Lagrange polynomials:
(16)
(16) where the sets of indexes for
,
and
are
,
and
, respectively (if a quadratic extrapolation is preferred, we get
, and
).
Remark 3.1
‘Compressed’ distributions
The SC technique is a tool to ‘compress’ the information regarding A in (Equation11(11)
(11) ), into a small number of coefficients, the CVs
. Indeed, the relationship between A and
is bijective, provided the distribution of the random variable ξ, and the corresponding CPs
(or, equivalently, the Lagrange basis in (Equation12
(12)
(12) )), are specified a priori.
3.2. Semi-analytical pricing of fixed- or floating-strike Asian options
Let us first consider the pricing of the fixed- or the floating-strike Asian options. Both the products allow for the same representation in which the only unknown stochastic quantity is ,
, as given in Proposition 2.2. For the sake of simplicity, in the absence of ambiguity, we call
just A.
For pricing purposes, we can benefit of the SC technique presented in the previous section, provided we know the map (or, equivalently, the CVs
), i.e.:
(17)
(17) where ξ is a standard normally distributed random variable, and C is a constant coherent with Proposition 2.2. We note, that
is the expectation of (the positive part of) polynomials of a standard normal distribution. Hence, a semi-analytic formula exists, in a similar fashion as the one given in [Citation11].
Proposition 3.2
Semi-analytic pricing formula
Let (and C) be defined as in Equation (Equation17
(17)
(17) ), with
defined in (Equation15
(15)
(15) ). Assume further that
,
and
are the coefficients in the canonical basis of monomials for the three polynomials
,
and
respectively of degree
, M−1 and
. Then, using the notation
, the following semi-analytic pricing approximation holds:
where
is the CDF of a standard normal random variable, ξ,
Footnote5,
satisfies
, and
according to the call/put case.
Proof.
For proof of the previous proposition, see Appendix A.2.
We note also that Proposition 3.2 uses as input in the pricing formula the coefficients in the canonical basis, not the ones in the Lagrange basis, , in (Equation13
(13)
(13) ).
Remark 3.3
Change of basis
Given a Lagrange basis identified by M collocation points , any
-degree polynomial
is uniquely determined by the corresponding M coefficients
. A linear transformation exists that connects the M coefficients in the Lagrange basis with the M coefficients
in the canonical basis of monomials. In particular, it holds:
with
a
Vandermonde matrix with element
in position
. The matrix
admits an inverse; thus, the coefficients
in the canonical basis are the result of matrix-vector multiplication, provided the coefficients
in the Lagrange basis are known. Moreover, since the matrix
only depends on
, its inverse can be computed a priori once the CPs
are fixed.
Proposition 3.2 provides a semi-analytic formula for the pricing of fixed- or floating-strike Asian options. Indeed, it requires the inversion of the map which typically is not available in analytic form. On the other hand, since both the CPs
and the CVs
are known, a proxy of
is easily achievable by interpolation on the pairs of values
,
.
The last problem is to recover the CVs (which identify
) in an accurate and fast way. We recall that, for
, each CV
is defined in terms of the exact map g and the CP
by the relationship:
The presence of
makes it impossible to directly compute
efficiently. On the other hand, by definition, the CVs
are quantiles of the random variable
, which depends on the parameters
of the underlying process S. As a consequence, there must exist some unknown mapping H which links
to the corresponding
. We approximate such a mapping from synthetic data setting a regression problem, which is solved with an ANN
(in the same fashion as in [Citation22,Citation25]). We have the following mapping:
with
and
being the spaces of the underlying model parameters and of the CVs, respectively, while the ANN
is the result of an optimization process on a synthetic training setFootnote6:
(18)
(18) The pricing procedure is summarized in the following algorithm.
Algorithm: Semi-analytic pricing
Fix the M collocation points
.
Given the parameters
Given
Given K and
Given the coefficients
3.3. Swift Monte Carlo pricing of fixed- and floating-strikes Asian options
Let us consider the case of an option whose payoff has both a fixed- and a floating-strike. The present value of such a derivative is given by:
hence the price of the option is a function of the two dependent quantities
and
. This means that, even in a MC setting, the dependency between
and
has to be fulfilled. Therefore, a different methodology with respect to the one proposed in the previous section needs to be developed.
Due to the availability of efficient and accurate sampling techniques for the underlying process S at a given future time T (we use the COS method [Citation24] enhanced with SC [Citation12], and we call it COS-SC), the main issue is the sampling of the conditional random variable . This task is addressed in the same fashion as it is done in [Citation25], where ANNs and stochastic collocation are applied for the efficient sampling from time-integral of stochastic bridgesFootnote7, namely
given the value of
. The underlying idea here is the same since the random variable
is conditional to
. Especially, in the previous sections we pointed out that the distribution of
has an unknown parametric form which depends on the set of Heston parameters
. Similarly, we expect the distribution of
to be parametric into the ‘augmented’ set of parameters
. Hence, there exists a mapping H which links
with the CVs,
, corresponding to the conditional distribution
. We approximate H by means of a suitable ANN
, getting the following mapping scheme:
where
and
are respectively the spaces of the underlying model parameters (augmented with
) and of the CVs (corresponding to the conditional distribution
), and
is the result of a regression problem on a suitable training set
(see Equation (Equation18
(18)
(18) )). We propose a first brute force sampling scheme.
Algorithm: Brute force conditional sampling and pricing
Fix the M collocation points
Given the parameters
generate the sample
given
given
Given the pairs
Nonetheless, the brute force sampling proposed above requires evaluations of
(see 2(b) in the previous algorithm). This is a massive computational cost, even if a single evaluation of an ANN is high-speed. We can, however, benefit from a further approximation. We compute the CVs using
only at specific reference values for
. Then, the intermediate cases are derived utilizing (linear) interpolation. We choose a set of Q equally-spaced values
for
, defined as:
(19)
(19) where the boundaries are quantiles corresponding to the probabilities
, i.e.
and
.
Calling , and
,
, we compute the grid
of reference CPs, with only Q ANN evaluations, namely:
(20)
(20) where
,
and
,
, are row vectors. The interpolation on
is much faster than the evaluation of
. Therefore, the grid-based conditional sampling results more efficient than the brute force one, particularly when sampling a huge number of MC samples.
The algorithm for the grid-based sampling procedure, to be used instead of point 2. in the previous algorithm, is reported here.
Algorithm: Grid-based conditional sampling
| 2.1. | Fix the boundary probabilities | ||||
| 2.2. | Compute the reference values | ||||
| 2.3. | Given the ‘augmented’ parameters | ||||
| 2.4. | Given the parameters
| ||||
4. Error analysis
This section is dedicated to the assessment and discussion of the error introduced by the main approximations used in the proposed pricing method. Two primary sources of error are identifiable. The first error is due to the SC technique: in Section 3.1 the exact map g is approximated by means of the piecewise polynomial . The second one is a regression error, which is present in both Sections 3.2 and 3.3. ANNs
are used instead of the exact mappings H. For the error introduced by the SC technique, we bound the ‘
-distance’,
, between the exact distribution and its SC proxy showing that
in
is an analytic function.
is used to provide a direct bound on the option price error,
. On the other hand, regarding the approximation of H via
we provide a general convergence result for ReLU-architecture ANN, i.e. ANN with Rectified Linear Units as activation functions.
4.1. Stochastic collocation error using Chebyshev polynomials
Let us consider the error introduced in the methodology using the SC technique Section 3.1, and investigate how this affects the option price. We restrict the analysis to the case of fixed- or floating-strike discrete arithmetic Asian and Lookback options Section 3.2. We define the error as the ‘
-distance’ between the real price
and its approximation
, i.e.:
(21)
(21) Given the standard normal kernel
, we define the SC error as the (squared)
-norm of
, i.e.:
(22)
(22) We decompose
accordingly to the piecewise definition of
, namely:
with the domains
defined in Equation (Equation14
(14)
(14) ), i.e. for
:
To deal with the ‘extrapolation’ errors
and
, we formulate the following assumption.
Assumption 4.1
The functions and
are
. Equivalently,
and
are
(since
and
are polynomials).
Given Assumption 4.1 and the fact that Footnote8, then the ‘extrapolation’ errors
and
vanish, with exponential rate, as
tends to infinity, i.e.
,
, and:
(23)
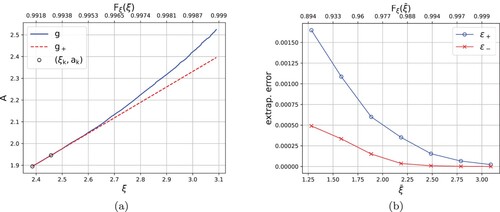
(23) An illustration of the speed of convergence is reported in Figure . Figure a shows that the growth of
is (much) less than exponential (consistently with Assumption 4.1), whereas Figure (b) illustrates the exponential decay of
and
when
increases.
Figure 1. Left: (slow) growth of compared to the linear extrapolation
. Right: exponential decays of
and
in (Equation23
(23)
(23) ) when the
increases. The upper x-axis represents the probability
.
Therefore, if is taken sufficiently big, the error
in (Equation22
(22)
(22) ) is mainly driven by the ‘interpolation’ error
, whose estimate is connected to error bounds for Chebyshev polynomial interpolation, and it is the focus of the next part.
Theorem 4.1
Error bound for analytic function [Citation9,Citation29]
Let f be a real function on and
be its
-degree polynomial interpolation built on Chebyshev nodes
,
. If f has an analytic extension in a Bernstein ellipse
with foci
and major and minor semiaxis lengths summing up to
such that
for some constant
, then, for each
, the following bound holds:
Since is approximated by means of the
-degree polynomials
, built on Chebyshev nodes, to apply Theorem 4.1, we verify the required assumptions, namely the boundedness of
in
and its analyticity.
We recall that:
(24)
(24) with
and
the CDFs of
and ξ, respectively. Hence, the boundedness on the compact domain
is satisfied because the map g is monotone increasing (as a composition of monotone increasing functions), and defined everywhere in
.
Furthermore, since the CDF of a standard normal, , is analytic, from (Equation24
(24)
(24) ) it follows that g is analytic if
is analytic. The analyticity of
is fulfilled if
is analytic and
does not vanish in the domain
. Observe that, by restricting the domain to
, the latter condition is trivially satisfied because we are ‘far’ from the tails of
(corresponding to the extrapolation domains
and
), and
do not vanish in other regions than the tails.
On the contrary, proving that is analytic is not trivial because of the lack of an explicit formula for
. However, it is beneficial to represent
through the characteristc function (ChF) of
,
. For that purpose, we use a well-known inversion result.
Theorem 4.2
ChF inversion theorem
Let us denote by F and ϕ the CDF and the ChF of a given real-valued random variable defined on . Then, it is possible to retrieve F from ϕ according to the inversion formula:
with the integral being understood as a principal value.
Proof.
For detailed proof, we refer to [Citation17].
Thanks to Theorem 4.2, we have that if is analytic, so it is
(as long as the integral in (eqn: L2error) is well-defined). Thus, the problem becomes to determine if
is analytic. We rely on a characterization of entireFootnote9 ChFs, which can be used in this framework to show that in the cases of – fixed- or floating-strike – discrete arithmetic Asian and Lookback options, the (complex extension of the) function
is analytic in a certain domain.
Theorem 4.3
Characterization of entire ChFs [Citation4]
Let Y be a real random variable. Then, the complex function ,
, is entire if and only if the absolute moments of Y exist for any order, i.e.
for any
, and the following limit holds:
(25)
(25)
Proof.
A reference for proof is given in [Citation4].
When dealing with the Heston model, there is no closed-form expression for the moments of the underlying process , as well as for the moments of its transform
. Nonetheless, a conditional case can be studied and employed to provide a starting point for a convergence result.
Proposition 4.4
Conditional ChF is entire
Let us define the N-dimensional random vector , with values in
, as:
Let the complex conditional characteristic function
,
, be the extended ChF of the conditional random variable
, with
as given in Equation (Equation2
(2)
(2) ).
Then, is entire.
Proof.
See Appendix A.4.
From now on, using the notation of Proposition 4.4, we consider the following assumption on the tail behaviour of the random vector satisfied. Informally, we require that the density of the joint distribution of
has uniform (w.r.t.
) exponential decay for A going to
.
Assumption 4.2
There exists a point ,
, with
and
, such that:
with
the joint distribution of the random vector
and the random variable A.
Thanks to Assumption 4.2, the ChF is well defined for any
, with the strip
. Moreover, applying Fubini's Theorem, for any
, we have:
(26)
(26) Thus, we can show that the ChF
is analytic in the strip
(the details are given in Appendix A.2).
Proposition 4.5
ChF is analytic
Let ,
, with
. Then,
is analytic in
.
Proof.
A proof is given in Appendix A.2.
Thanks to Proposition 4.5, and consistently with the previous discussion, we conclude that the map g in (Equation24(24)
(24) ), is analytic on the domain
. Therefore, we can apply Theorem 4.1, which yields the following error estimate:
for certain
and
. As a consequence, the following bound for the
-error
holds:
(27)
(27) Furthermore, the exponential convergence is also confirmed numerically, as reported in Figure . In Figure (a) we can appreciate the improvement in the approximation of
by means of
, when M is increased, whereas Figure (b) reports the exponential decay of
.
Figure 2. Left: exact map (blue) compared to the interpolation
in the domain
, for M = 4, 5. Right:
-error
in (Equation27
(27)
(27) ) exponential decay in the order of the polynomial
.
![Figure 2. Left: exact map g1ΩM (blue) compared to the interpolation gM in the domain ΩM, for M = 4, 5. Right: L2-error ϵM in (Equation27(27) ϵM=E[(g1ΩM−gM)2(ξ)]≤C¯2ϱ2−2M.(27) ) exponential decay in the order of the polynomial gM.](/cms/asset/22c904a0-3465-4102-8241-315db2fc3a25/gcom_a_2363467_f0002_oc.jpg)
Using (Equation27(27)
(27) ), the
-norm of
,
in (Equation22
(22)
(22) ), is bounded by:
which goes to zero when
and
tend to
. Therefore, for any
there exist
and
such that:
(28)
(28) and because of the exponential decay, we expect
and
do not need to be taken too big.
Eventually, we can benefit from the bound in (Equation28(28)
(28) ) to control the pricing error,
in (Equation21
(21)
(21) ). By employing the well-known inequality
and the Cauchy-Schwarz inequality, we can write:
and using the same argument twice (exchanging the roles of g and
), we end up with the following bound for the option price error:
with
and
as in (Equation28
(28)
(28) ).
4.2. Artificial neural network regression error
As the final part of the error analysis, we investigate when ANNs are suitable approximating maps. In particular, we focus on ANNs with ReLU-architectures, namely ANNs whose activation units are all Rectified Linear Units defined as .
Consider the Sobolev space , with
, namely the space of functions
whose derivatives up to the
th order are all Lipschitz continuous, equipped with the norm
defined as:
(29)
(29) with
,
, and
the weak derivative operator. Furthermore, we define the unit ball
. Then, the following approximation result holds:
Theorem 4.6
Convergence for ReLU ANN
For any choice of and
, there exists an architecture
based on ReLU (Rectified Linear Unit) activation functions ϕ, i.e.
, such that:
| (1) |
| ||||
| (2) | H has at most | ||||
Proof.
A proof is available in [Citation30].
Essentially, Theorem 4.6 states that there always exists a ReLU-architecture (with bounded number of layers and activation units) suitable to approximate at any desired precision functions with a certain level of regularity (determined by ).
Remark 4.7
Input scaling
We emphasize that although Theorem 4.6 applies to (a subclass of sufficiently regular) functions with domain the d-dimensional hypercube , this is not restrictive. Indeed, as long as the regularity conditions are fulfilled, Theorem 4.6 holds for any function defined on a d-dimensional hyperrectangle since it is always possible to linearly map its domain into the d-dimensional hypercube.
Furthermore, we observe that all the results of convergence for ANN rely on the assumption that the training is performed successfully, and so the final error in the optimization process is negligible. Under this assumption, Theorem 4.6 provides a robust theoretical justification for using ReLU-based ANNs as regressors. The goodness of the result can also be investigated empirically, as shown in the next section (see, for instance, Figure ).
Figure 3. Illustration of a dense ANN with (from the left) one input layer, three hidden layers, and one output layer. Each white node represents an activation unit.
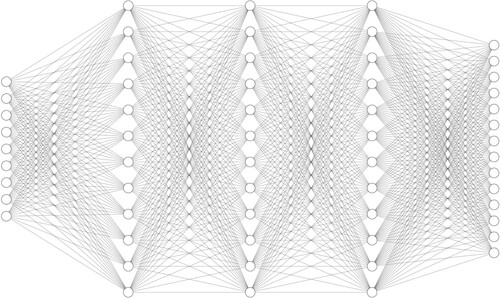
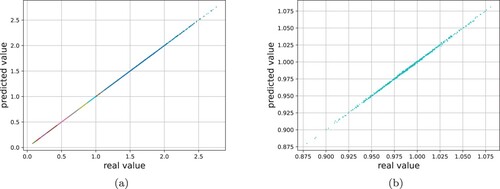
Figure 4. First experiment: FxA. Left: scatter plot of the real CVs (,
, with different colours) against the predicted ones. Right: zoom on the ‘worst’ case, namely
.
5. Numerical experiments
In this part of the paper, we detail some numerical experiments. We focus on applying the methodology given in Section 3.2 for the numerical pricing of fixed-strike discrete arithmetic Asian and Lookback options. We address the general case of discrete arithmetic Asian options described in Section 3.3. For each pricing experiment errors and timing results are given. The ground truth benchmarks are computed via MC using the almost exact simulation of the Heston models, detailed in Result Appendix A.3.
All the computations are implemented and run on a MacBook Air (M1, 2020) machine, with chip Apple M1 and 16 GB of RAM. The code is written in Python, and torch is the library used for the design and training of the ANN, as in [Citation25].
5.1. A benchmark from the literature
To assess the quality of the proposed methodology, we compare the method against the benchmarks available in Table 5 from [Citation19]. In the experiment, we consider prices of 5 discrete Asian call options with n = 201 equally spaced monitoring dates from time to T = 0.25. The underlying initial value is
, while the other Heston parameters (Set BM) as well as the target strikes are given in Table . To produce those results, a toy model has been trained based on the ranges provided in Table . The ANN employed consists of 2 hidden layers each one with 20 hidden units. The results are computed with
Monte Carlo paths (consistent with the benchmark [Citation19]) and are presented in Table . For both the benchmark and the SC technique are reported the absolute value (V) and the
confidence interval (95CI) of the option price. For the SA technique, instead, only the absolute value is reported since no sampling is involved and so there is no information on the variance of the estimate. All the results are within the BM
confidence interval, and hence confirm the high accuracy of the proposed method.
5.2. Experiments' specifications
Among the three examples of applications presented, two of them rely on the technique given in Section 3.2, while the third is based on the theory in Section 3.3. The first experiment is the pricing of fixed-strike discrete arithmetic Asian options (FxA) with an underlying stock price process following the Heston dynamics. The second example, instead, is connected to the ‘interest rate world’, and is employed for the pricing of fixed-strike discrete Lookback swaptions (FxL). We assume the underlying swap rate is driven by a displaced Heston model with drift-less dynamics, typically used for interest rates. The last one is an application to the pricing of fixed- and floating-strikes discrete arithmetic Asian options (FxFlA) on a stock price driven by the Heston dynamics. In the first (FxA) and last experiment (FxFlA), in (Equation2
(2)
(2) ) is specified as:
(30)
(30) with
as monitoring time lag, and
as option maturity. Differently, in the second experiment (FxL)
is given by:
(31)
(31) with
as monitoring time lag, and
as option maturity. Observe that, assuming the unit is 1 year, with 12 identical months and 360 days, the choices of
and
correspond respectively to 1 month and 3 days of time lag in the monitoring dates.
Table 1. Training set for benchmark replication.
Table 2. Results benchmark (BM) replication (see, Table 5 from [Citation19]).
5.3. Artificial neural network development
In this section, we provide the details about the generation of the training set, for each experiment, and the consequent training of the ANN used in the pricing model.
5.3.1. Training set generation
The training sets are generated through MC simulations, using the almost exact sampling in Result Appendix A.3. In the first two applications (FxA and FxL) the two training sets are defined as in (Equation18(18)
(18) ), and particularly they read:
The Heston parameters, i.e.
Footnote10, are sampled using Latin Hypercube Sampling (LHS), to ensure the best filling of the parameter space [Citation22,Citation25]. For each set
,
paths are generated, with a time step of
and a time horizon up to
. The underlying process S is monitored at each time T for which there are enough past observations to compute
, i.e.:
Consequently, the product between the number of Heston parameters' set and the number of available maturities determines the magnitude of the two training sets (i.e.
and
).
For each , the CVs
corresponding to
are computed as:
where
is the empirical quantile function of
, used as a numerical proxy of
, and
are the CPs computed as Chebyshev nodes:
with
. We note that the definition of
avoids any CV
to be ‘deeply’ in the tails of
, which are more sensitive to numerical instability in a MC simulation.
The information about the generation of the two training sets is reported in Table . Observe that is richer in elements than
because of computational constraints. Indeed, the higher number of monitoring dates of
in FxL makes the generation time of
more than twice the one of
(given the same number of pairs).
Table 3. Training sets and
generation details.
Since in the general procedure (see Section 3.3) ANNs are used to learn the conditional distribution (not just
!), the third experiment requires a training set which contains also information about the conditioning value,
. We define
as:
where
is the probability corresponding to the quantile
, given as in (Equation19
(19)
(19) ), i.e.:
with the
and
. Heuristic arguments drove the choice of adding in the input set
the probability
, i.e. the probability implied by the final value
. Indeed, the ANN training process results more accurate when both
and
are included in
. Similarly as before, the sets of Heston parameters are sampled using LHS. For each set,
paths are generated, with a time step of
and a time horizon up to
. The underlying process S is monitored at each time T for which there are enough past observations to compute
, i.e.:
For any maturity T and any realization
, the inverse CDF of the conditional random variable
is approximated with the empirical quantile function,
. The quantile function
is built on the
‘closest’ paths to
, i.e. those
paths whose final values
are the closest to
.
Eventually, for any input set , the CVs
corresponding to
are computed as:
with
the Chebyshev nodes:
and
.
The information about the generation of the training set are reported in Table .
Table 4. Training set generation details.
5.3.2. Artificial neural network training
Each training set store a finite amount of pairs
, in which each
and each corresponding
are connected by the mapping H. The artificial neural network
is used to approximate and generalize H for inputs
not in
. The architecture of
was initially chosen accordingly to [Citation22,Citation25], then suitably adjusted by heuristic arguments.
is a fully connected (or dense) ANN with five layers – one input, one output, and three hidden (HidL), as the one illustrated in Figure . Input and output layers have a number of units (neurons) – input size (InS) and output size (OutS) – coherent with the targeted problem (FxA, FxL, or FxFlA). Each hidden layer has the same hidden size (HidS) of 200 neurons, selected as the optimal one among different settings. ReLU (Rectified Linear Unit) is the non-linear activation unit (ActUn) for each neuron, and it is defined as
[Citation23]. The loss function (LossFunc) is the Mean Squared Error (MSE) between the actual outputs,
(available in
), and the ones predicted by the ANN,
. The optimization process is composed of 3,000 epochs (E). During each epoch, the major fraction (70%) of the
(the actual training set) is ‘back-propagated’ through the ANN in batches of size 1024 (B). The stochastic gradient-based optimizer (Opt) Adam [Citation18] is employed in the optimization. Particularly, the optimizer updates the ANN weights based on the gradient computed on each random batch (during each epoch). The initial learning rate (InitLR) is
, with a decaying rate (DecR) of 0.1 and a decaying step (DecS) of 1,000 epochs. The details are reported in Table .
Furthermore, during the optimization routine, the 20% of is used to validate the result (namely, to avoid the overfitting of the training set). Eventually, the remaining 10% of
is used for testing the quality of the ANN. Figure provides a visual insight into the high accuracy the ANN reaches at the end of the training process. Figure (a) shows the scatter plot of the real CVs
,
, against the ones predicted using the ANN, for the experiment FxA; in Figure (b) a zoom is applied to the ‘worst’ case, namely the CV
, for which anyway is reached the extremely high
score of 0.9994.
Table 5. Artificial neural network and optimization details.
5.4. Sampling and pricing
Given the trained model from the previous section, we can now focus on the actual sampling and/or pricing of options. In particular, for the first two experiments, we consider the following payoffs: (32)
(32)
(33)
(33) whereas for the third, FxFlA, we have:
(34)
(34) with
defined as in (Equation30
(30)
(30) ) for FxA and FxFlA, and as in (Equation31
(31)
(31) ) for FxL.
All the results in the following sections are compared to a MC benchmark obtained using the almost exact simulation described in Appendix A.3.
5.4.1. Numerical results for FxA
The procedure described in Section 3.2 is employed to solve the problem of pricing fixed-strike discrete Asian options with payoffs as in (Equation32(32)
(32) ), with underlying stock price initial value
. In this experiment, the ANN is trained on Heston model parameters' ranges, which include the examples proposed in [Citation1] representing some real applications. Furthermore, we note the following aspect.
Remark 5.1
Scaled underlying process and (positive) homogeneity of A
The unit initial value is not restrictive. Indeed, the underlying stock price dynamics in Equations (Equation9(9)
(9) ) and (Equation10
(10)
(10) ) are independent of
, with the initial value only accounting as a multiplicative constant (this can be easily proved by means of Itô's lemma). Moreover, since
is (positive) homogeneous in S also
can be easily ‘scaled’ according to the desired initial value. Particularly, given the constant c>0,
.
The timing results are reported (in milliseconds) in Table , for different choices of . Both SC and SA times only refer to the online pricing computational time, namely the time required for the pricing procedure, excluding the training sets generation and the ANNs training, which are performed – only once – offline. The semi-analytic formula requires a constant evaluation time, as well as the SC technique (if
is fixed), whereas the MC simulation is dependent on the parameter T (since we decided to keep the same MC step in every simulation). Therefore, the methodology becomes more convenient the longer the maturity of the option T. The option pricing computational time is reduced by tens of times when using SC to generate the population from A, while it is reduced by hundreds of times if the semi-analytic (SA) formula is employed.
Table 6. Tested Heston parameter sets.
Figure 5. Left: comparison between maps g from MC and from SC (with linear extrapolation). Center: comparison between MC histogram of
and the numerical PDF from SC. Right: comparison between MC numerical CDF of
and the numerical CDF from SC.
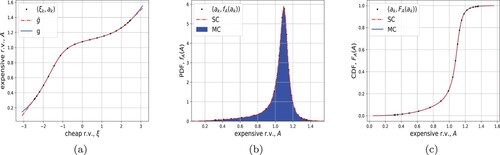
Figure 6. Left: fixed-strike discrete Asian option prices for 50 different strikes under the Heston model dynamics. Right: MC and SC standard errors (left y-axis) and pricing errors in units of the corresponding MC standard errors SE, obtained with for both MC and SC (right y-axis). Up: call with Set I. Down: put with Set II.
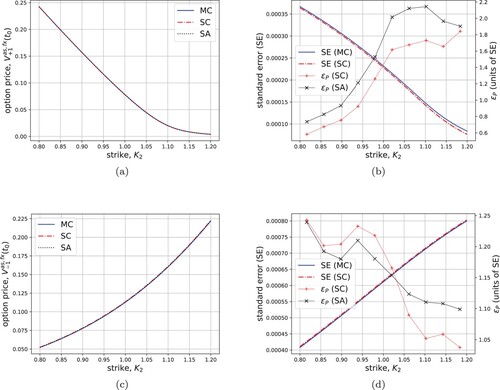
Table 7. Timing results for option pricing.
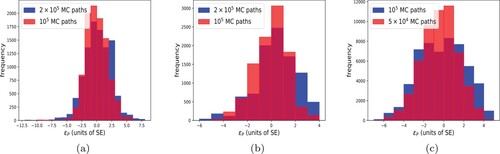
Eventually, the error distribution of 10,000 different option prices (one call and one put with 100 values for each for 50 randomly chosen Heston parameters' sets and maturities) is given in Figure (a). The SA prices (assuming a linear extrapolation) are compared with MC benchmarks. The outcome is satisfactory and shows the robustness of the methodology proposed. The error is smaller than three times the MC standard error in more than 90% of the cases when
(red histogram), and in more than 80% of the cases when
(blue histogram).
5.4.2. Numerical results for FxL
In this section, we use the procedure to efficiently value the pipeline risk typically embedded in mortgages. The pipeline risk (in mortgages) is one of the risks a financial institution is exposed to any time a client buys a mortgage. Indeed, when a client decides to buy a mortgage there is a grace period (from one to three months in The Netherlands), during which (s)he is allowed to pick the most convenient rate, namely the minimum.
Figure 7. Pricing error distribution. The error is expressed in units of the corresponding Monte Carlo benchmark standard error (SE), and reported for two different numbers of MC paths. Left: FxA (10,000 values). Center: FxL (10,000 values). Right: FxFlA (54,000 values).
Observe now that a suitable Lookback option on a payer swap, namely a Lookback payer swaption, perfectly replicates the optionality offered to the client. In other words, the ‘cost’ of the pipeline risk is assessed by evaluating a proper Lookback swaption. In particular, we price fixed-strike discrete Lookback swaptions with a monitoring period of 3 months and 3-day frequency (see Equation31(31)
(31) ).
We assume the underlying swap rate ,
, is driven by the dynamics given in Equations (Equation9
(9)
(9) ) and (Equation10
(10)
(10) ) with
and parallel shifted of
. By introducing a shift, we handle also the possible situation of negative rates, which otherwise would require a different model specification.
Remark 5.2
Parallel shift of and
A parallel shift θ does not affect the training set generation. Indeed, since , it holds
. Then, it is enough to sample from
(built from the paths of
without shift) and perform the shift afterward, to get the desired distribution.
The timing results from the application of the procedure are comparable to the ones in Section 5.4.1 (see Table ). Furthermore, in Figure (b), we report the pricing error distribution obtained by pricing call and put options for 50 randomly chosen Heston parameters' sets and 100 values for . In this experiment, we observe that over 95% of the errors are within three MC SE when
, and the percentage is about 90% when
.
5.4.3. Numerical results for FxFlA
The third and last experiment consists in the conditional sampling of . The samples are then used, together with
, for pricing of fixed- and floating-strikes discrete Asian options.
The procedure is tested on 30 randomly chosen Heston parameters' sets. Both the MC benchmark and the SC procedure are based on populations with paths. In the SC pricing, the process
is sampled using the COS method [Citation24] combined with SC (COS-SC) to avoid a huge number of CDF numerical inversions [Citation12], and so increase efficiency. Then, we apply the grid-based algorithm of Section 3.3. We evaluate the ANN at a reduced number of reference quantiles, and we compute the CVs corresponding to each sample of
by means of linear interpolation. The CVs identify the map
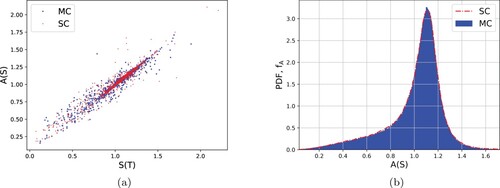
, which is employed for the conditional sampling. Figure (a) shows the cloud of points (for parameters' Set III in Table ) of the bivariate distribution
generated using the procedure against the MC benchmark, while Figure (b) only focuses on the marginal distribution of
. We can appreciate a good matching between the two distributions.
Figure 8. Left: joint distribution of , for the Heston set of parameters in Set III (see Table ). Right: marginal distribution of
, for the same set of Heston parameters.
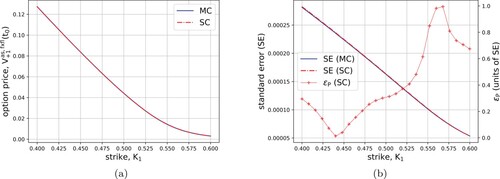
For each set, we price call and put options with equally-spaced strikes
and
in the ranges of (Equation34
(34)
(34) ). The results for the particular case of call options with Set III in Table and
are illustrated in Figure . The SC option prices and the corresponding MC benchmarks are plotted on the left. On the right, the standard errors for MC and SC are reported (left y-axis), and the absolute pricing error
is shown in units of the corresponding MC standard error (right y-axis). The timing results are reported in Table for
and
and they keep into account the computational time for the pricing of all the 900 different call options (according to each combination of
and
). Figure (c) displays the pricing error
distribution for the 30 randomly chosen Heston parameter sets (for each set 900 call and 900 put options are priced for every combination of
and
, so the overall number of data is 54,000). About 92% of the errors are within three MC SE when
. The percentage is around 80% when
are used.
Figure 9. Left: fixed-float-strike discrete Asian call option prices for 30 different ,
, and Heston parameter Set III. Right: MC and SC standard errors (left y-axis) and pricing errors in units of the corresponding MC standard errors SE, obtained with
for both MC and SC (right y-axis).
It might look surprising that the performance of the general procedure is better than the special one, but actually, it is not. Indeed, an important aspect needs to be accounted for. The high correlation between and
makes the task of the ANN easier, in the sense that the distribution of
typically has a low variance around
. In other words, the ANN has to ‘learn’ only a small correction to get
from
(
is an input for the ANN!), whereas the ANN in the special procedure learns the unconditional distribution of
with no information on the final value
, and so only on the Heston parameters. The result is that a small lack in accuracy due to a not-perfect training process, or most likely to a not-perfect training set, is less significant in the conditional case rather than in the unconditional.
6. Conclusion
In this work, we presented a robust, data-driven procedure for the pricing of fixed- and floating-strike discrete Asian and Lookback options, under the stochastic volatility model of Heston. The usage of Stochastic Collocation techniques combined with deep artificial neural networks allows the methodology to reach a high level of accuracy while reducing the computational time by tens of times when compared to Monte Carlo benchmarks. Furthermore, we provide a semi-analytic pricing formula for European-type options with a payoff given by piecewise polynomial mapping of a standard normal random variable. Such a result allows to even increase the speed-up up to hundreds of times, without deterioration on the accuracy. An analysis of the error provides theoretical justification for the proposed scheme, and the problem of sampling from both unconditional and conditional distributions is further investigated from a numerical perspective. Finally, the numerical results provide clear evidence of the quality of the method.
Acknowledgments
We would like to thank the two anonymous reviewers whose insightful comments and constructive feedback greatly contributed to the enhancement of the quality of this article. Additionally, we extend our appreciation to Rabobank (the Netherlands) for funding this project.
Disclosure statement
No potential conflict of interest was reported by the author(s).
Notes
1 The meaning of ‘data-driven’ here is the one given in [Citation22]. The (empirical) distribution of interest is computed for a set of structural parameters and stored. Such synthetic ‘data’ are used to ‘drive’ the training of a suitable model.
2 We remark that in most real applications (with a few exceptions such as some commodities and FX rates) the correlation is negative. Furthermore, the phenomenon of ‘moment explosion’ for certain choices of Heston parameters involving positive correlation is discussed in [Citation2].
3 Given the two random variables X, Y, with CDFs , it holds:
.
4 The two main reasons for ξ being standard normal are the availability of such a distribution in most of the computing tools, and the ‘similarity’ between a standard normally r.v. and (the logarithm of) (see [Citation12] for more details).
5 A recursive formula for the computation of is given in Appendix A.2.
6 The synthetic data are generated via MC simulation, as explained in Section 5.
7 By stochastic bridge, we mean any stochastic process conditional to both its initial and final values.
8 Th PDF works as a dumping factor in
and
.
9 Entire functions are complex analytic functions in the whole complex plane .
10 and
for FxA and FxL, respectively.
11 Under the risk-neutral measure, . However, the same scheme applies under the underlying process measure
, with only a minor difference, i.e.
.
References
- L.B. Andersen, Efficient simulation of the Heston stochastic volatility model, J. Comput. Finance 11 (2007), pp. 1–42.
- L.B. Andersen and V.V. Piterbarg, Moment explosions in stochastic volatility models, Finance Stoch.11(1) (2007), pp. 29–50.
- E. Benhamou, Fast Fourier transform for discrete Asian options, J. Comput. Finance 6(1) (2002), pp. 49–68.
- S.V. Berezin, On analytic characteristic functions and processes governed by SDEs, St. Petersburg Polytech. University J.: Phys. Math. 2(2) (2016), pp. 144–149.
- M. Broadie and Ö. Kaya, Exact simulation of stochastic volatility and other affine jump diffusion processes, Oper. Res. 54(2) (2006), pp. 217–231.
- A. Conze, Path dependent options: The case of Lookback options, J. Finance 46(5) (1991), pp. 1893–1907.
- S. Corsaro, I. Kyriakou, D. Marazzina, and Z. Marino, A general framework for pricing asian options under stochastic volatility on parallel architectures, Eur. J. Oper. Res. 272(3) (2019), pp. 1082–1095.
- J. Devreese, D. Lemmens, and J. Tempere, Path integral approach to Asian options in the Black-Scholes model, Physica A Stat. Mech. Appl. 389(4) (2010), pp. 780–788.
- M. Gaß, K. Glau, M. Mahlstedt, and M. Mair, Chebyshev interpolation for parametric option pricing, Finance Stoch. 22 (2018), pp. 701–731.
- M.B. Goldman, H.B. Sosin, and M.A. Gatto, Path dependent options: ‘Buy at the low, sell at the high’, J. Finance 34(5) (1979), pp. 1111–1127.
- L.A. Grzelak and C.W. Oosterlee, From arbitrage to arbitrage-free implied volatilities, J. Comput. Finance 20(3) (2016), pp. 1–19.
- L.A. Grzelak, J.A.S. Witteveen, M. Suárez-Taboada, and C.W. Oosterlee, The stochastic collocation Monte Carlo sampler: Highly efficient sampling from expensive distributions, Quant. Finance 19(2) (2019), pp. 339–356.
- V. Henderson and R. Wojakowski, On the equivalence of floating-and fixed-strike asian options, J. Appl. Probab. 39(2) (2002), pp. 391–394.
- S.L. Heston, A closed-form solution for options with stochastic volatility with applications to bond and currency options, Rev. Financ. Stud. 6(2) (1993), pp. 327–343.
- R.C. Heynen and H.M. Kat, Lookback options with discrete and partial monitoring of the underlying price, Appl. Math. Finance 2(4) (1995), pp. 273–284.
- A. Kemna and A. Vorst, A pricing method for options based on average asset values, J. Bank. Financ.14(1) (1990), pp. 113–129.
- M.G. Kendall, The Advanced Theory of Statistics, Wiley, London (UK), 1945.
- D.P. Kingma and J.L. Ba, Adam: A method for stochastic optimization, in Published as a Conference Paper at the 3rd International Conference for Learning Representations, San Diego, 2015.
- J.L. Kirkby and D. Nguyen, Efficient Asian option pricing under regime switching jump diffusions and stochastic volatility models, Annal. Finance 16(3) (2020), pp. 307–351.
- A. Leitao, L. Ortiz-Gracia, and E.I. Wagner, Swift valuation of discretely monitored arithmetic asian options, J. Comput. Sci. 28 (2018), pp. 120–139.
- A. Leitao Rodriguez, J. Lars Kirkby, and L. Ortiz-Gracia, The CTMC–heston model: Calibration and exotic option pricing with SWIFT, J. Comput. Finance 24(4) (2021), pp. 71–114.
- S. Liu, L.A. Grzelak, and C.W. Oosterlee, The seven-league scheme: Deep learning for large time step Monte Carlo simulations of stochastic differential equations, Risks 10(3) (2022), p. 47.
- C. Nwankpa, W. Ijomah, A. Gachagan, and S. Marshall, Activation functions: Comparison of trends in practice and research for deep learning. arXiv e-prints, 2018.
- C.W. Oosterlee and L.A. Grzelak, Mathematical Modeling and Computation in Finance, World Scientific Publishing Europe Ltd., 57 Shelton Street, Covent Garden, London WC2H 9HE, 2019.
- L. Perotti and L.A. Grzelak, Fast sampling from time-integrated bridges using deep learning, J. Comput. Math. Data Sci. 5 (2022) p. 100060.
- L.N. Trefethen, Approximation theory and approximation practice, extended edition, Society for Industrial and Applied Mathematics, Philadelphia (US), 2019.
- J. Vecer, Unified pricing of Asian options, Risk 15(6) (2002), pp. 113–116.
- P. Wilmott, J. Dewynne, and S. Howison, Option Pricing: Mathematical Models and Computation, Oxford Financial Press, Oxford, 1993.
- S. Xiang, X. Chen, and H. Wang, Error bounds for approximation in Chebyshev points, Numer. Math.116 (2010), pp. 463–491.
- D. Yarotsky, Error bounds for approximations with Deep ReLU networks, Neural Netw. 94 (2017), pp. 103–114.
- B. Zhang and C.W. Oosterlee, Efficient pricing of European-style Asian options under exponential Lévy processes based on Fourier Cosine expansions, SIAM J. Financ. Math. 4 (2013), pp. 399–426.
Appendix
Proofs and lemmas
A.1. Underlying process measure for floating-strike options
Proof of Proposition 2.1
Under the risk-neutral measure the value at time
of a floating-strike Asian Option, with maturity
, underlying process
, and future monitoring dates
,
, is given by:
We define a Radon-Nikodym derivative to change the measure from the risk-neutral measure
to the stock measure
, namely the measure associated with the numéraire S:
which yields the following present value, expressed as an expectation under the measure
:
Proposition Appendix A.1
The Heston model under the underlying process measure
Using the same notation as in (Equation9(9)
(9) ) and (Equation10
(10)
(10) ), under the stock
measure,
, the Heston framework yields the following dynamics for the process
:
with
,
, and
and
are BMs under the underlying process measure
such that
.
Proof.
Under the stock measure , implied by the stock
as numéraire, all the assets discounted with S must be martingales. Particularly, this entails that
must be a martingale, where
is the money-savings account defined as
.
From (Equation9(9)
(9) ) and (Equation10
(10)
(10) ), using Cholesky decomposition, the Heston model can be expressed in terms of independent Brownian motions,
and
, through the following system of SDEs:
After application of Itô's Lemma we find:
which implies the following measure transformation:
Thus, under the stock measure
, the dynamics of
reads:
while for the dynamics of
we find:
Setting
,
,
, and
the proof is complete.
A.2. Semi-analytic pricing formula
Result Appendix A.1
Moments of truncated standard normal distribution
Let and
, a<b. Then, the recursive expression for:
the ith moment of the truncated standard normal distribution
, reads:
where
,
, and
and
are the PDF and the CDF of ξ, respectively.
Result Appendix A.2
Expectation of polynomial of truncated normal distribution
Let be a
-degree polynomial and let
, with
,
its PDF and CDF, respectively. Then, for any
with a<b, the following holds:
(A1)
(A1) with
as defined in Result Appendix A.1.
Proof.
The proof immediately follows thanks to the following equalities:
(A2)
(A2)
Proof of Proposition 3.2
The approximation is strictly increasing in the domain of interest. Then, setting
, we have:
(A3)
(A3) where the first equality holds by definition of expectation, the second one relies on a suitable change of variable (y = −x) and the last one holds thanks to the even symmetry of
. We define the integral
as:
and using the definition of
as a piecewise polynomial, we get:
(A4)
(A4) The thesis follows by applying Result Appendix A.2 at each term in (EquationA4
(A4)
(A4) ) and exploiting the definition of
.
A.3. Almost exact simulation from the Heston model
In a MC framework, the most common scheme employed in the industry is the Euler-Maruyama discretization of the system of SDEs which describes the underlying process dynamics. For the stochastic volatility model of Heston, such a scheme can be improved, allowing for an exact simulation of the variance process (see (Equation10
(10)
(10) )), as shown in [Citation5]. This results in increased accuracy, and avoids numerical issues due to the theoretical non-negativity of the process
, leading to the so-called almost exact simulation of the Heston model [Citation24].
Result Appendix A.3
Almost exact simulation from the Heston model
Given , its dynamicsFootnote11 between the consequent times
and
is discretized with the following scheme:
(A5)
(A5) with the quantities:
the noncentral chi-squared random variable
with δ degrees of freedom and non-centrality parameter η, and
. The remaining constants are defined as:
Derivation.
Given , by applying Itô's Lemma and Cholesky decomposition on the dynamics in (Equation9
(9)
(9) ) and (Equation10
(10)
(10) ), we get:
(A6)
(A6)
(A7)
(A7) where
and
are independent BMs.
By integrating (EquationA6(A6)
(A6) ) and (EquationA7
(A7)
(A7) ) in a the time interval
, the following discretization scheme is obtained:
(A8)
(A8)
(A9)
(A9) where
,
,
,
.
Given , the variance
is distributed as a suitable scaled noncentral chi-squared distribution [Citation24]. Therefore, we substitute
in (EquationA8
(A8)
(A8) ) using (EquationA9
(A9)
(A9) ), ending up with:
We approximate the integrals in the expression above employing the left integration boundary values of the integrand, as in the Euler-Maruyama discretization scheme. The scheme (EquationA5
(A5)
(A5) ) follows collecting the terms and employing the property
, with
and
.
A.4. SC error analysis for Chebyshev interpolation
The two following lemmas are useful to show that the conditional complex ChF is an analytic function of
. The first one provides the law of the conditional stock-price distribution, whereas the second one is meant to give algebraic bounds for the target function
.
Lemma Appendix A.2
Conditional distribution under Heston
Let be the solution at time t of Equation (Equation9
(9)
(9) ) and
, with v driven by the dynamics in Equation (Equation10
(10)
(10) ). Then, the following equality in distribution holds:
with
, μ and σ defined as
and
. Furthermore, for any
, the following holds:
(A10)
(A10) In other words, the stock price given the time-integral of the variance process
is log-normally distributed, with parameters dependent on the time-integral
, and its moments up to any order are given as in Equation (EquationA10
(A10)
(A10) ).
Proof.
Writing (Equation9(9)
(9) ) in integral form we get:
By considering the conditional distribution
(instead of
) the only source of randomness is given by the Itô's integral (and it is due to the presence of the Brownian motion
). The thesis follows since the Itô's integral of a deterministic argument is normally distributed with zero mean and variance given by the time integral of the argument squared (in the same interval). Therefore,
is log-normally distributed, with moments given as in (EquationA10
(A10)
(A10) ).
Lemma Appendix A.3
Algebraic bounds
Let us consider , with
for each
. Then, for any
, we have:
| (1) |
| ||||
| (2) |
| ||||
Proof.
The second thesis is obvious. We prove here the first one. We recall that in general, given a, b>0 and any , the following inequality holds:
(A11)
(A11) Then, applying (EquationA11
(A11)
(A11) ) N−1 times we get:
which can be further bounded by:
We have all the ingredients to prove Proposition 4.4.
Proof of Proposition 4.4
To exploit the characterization for entire ChFs in Theorem 4.3 we need to show the finiteness of each absolute moment as well as that Equation (Equation25(25)
(25) ) is satisfied. Both the conditions can be proved using Lemmas Appendix A.2 and A.3. For
, we consider the two cases:
If
If
The finiteness of the absolute moments up to any order follows directly from Equations (EquationA13(A13)
(A13) ) and (EquationA15
(A15)
(A15) ) respectively, since
are finite (indeed, they are time-integrals on compact intervals of continuous paths).
Eventually, thanks to Jensen's inequality we have . This, together with the at-most exponential growth (in k) of the absolute moments of
, ensures that the limit in Equation (Equation25
(25)
(25) ) holds. Then, by Theorem 4.3,
is an entire function of the complex variable
.
Proof of Proposition 4.5
The goal here is to apply Morera's theorem. Hence, let be any piecewise
closed curve in the strip
. Then:
where in the first equality we exploited the representation of the unconditional ChF
in terms of conditional ChFs
, in the second equality we use Fubini's theorem to exchange the order of integration, and eventually in the last equation we employ the Cauchy's integral theorem on
.