
Abstract
Purpose
Sevoflurane is a widely used anesthetics, however, it has been reported that sevoflurane has neurotoxic effects. Studies have shown that miR-221-3p can ameliorate neuron damage. This study was to investigate whether miR-221-3p could reduce the neurotoxic effect of sevoflurane on nerve cells.
Materials and methods
The rat hippocampal neuron cells were treated with sevoflurane or cultured normally. And we constructed neuron cells that overexpressed or low expression of miR-221-3p in the presence or absence of sevoflurane. The cells were transfected with CDKN1B or siCDKN1B, and co-transfected with miR-221-3p mimic and CDKN1B or miR-221-3p inhibitor and siCDKN1B. Cell viability and apoptosis were detected by CCK-8 and flow cytometer. Target gene of miR-221-3p were predicted by TargetScan and luciferase reporter assay. The expressions of related genes were detected by western blotting and quantitative real-time polymerase chain reaction.
Results
Sevoflurane decreased miR-221-3p level and increased CDKN1B level, inhibited cell viability and promoted apoptosis. Overexpress of miR-221-3p decreased CDKN1B level, up-regulated cell viability and inhibited apoptosis, and reversed the effects of sevoflurane on cell viability and apoptosis, while the effects low expression of miR-221-3p was contrary. CDKN1B was the target gene of miR-221-3p, which inhibited cell viability and promoted apoptosis, and reversed the effects of miR-221-3p mimic, whereas siCDKN1B did the opposite effects.
Conclusions
Sevoflurane can cause nerve cell injury, and miR-221-3p may promote cell activity and inhibit apoptosis by inhibiting CDKN1B expression, thereby ameliorating cell injury induced by sevoflurane.
Introduction
In recent years, the continuous improvement of anesthesia technology has enabled more and more surgical operations and invasive examinations to be carried out smoothly [Citation1, Citation2]. Anesthesia is divided into local anesthesia and general anesthesia, and the general anesthesia includes inhalation anesthesia or intravenous anesthesia [Citation3, Citation4]. Sevoflurane is the most widely used inhalation anesthetics in clinical practice, which has the advantages of rapid effect, good controllability and low airway irritation [Citation4, Citation5]. However, recent studies have proved that sevoflurane exposure has toxic effects on the central nervous system, which can lead to abnormal apoptosis of neurons and neurodegeneration [Citation6, Citation7]. It is mainly manifested in the decline of cognitive functions such as learning and memory [Citation8–10]. Therefore, it is important to study the therapeutic methods to reduce the neurocognitive impairment induced by sevoflurane.
MicroRNAs (miRNAs) are highly conserved, noncoding RNA molecule [Citation11]. In recent years, studies have found a close correlation between miRNAs and anaesthesia-related cognitive dysfunction [Citation12, Citation13]. Gentaro Goto et al. [Citation14] showed that after sevoflurane inhalation and intravenous injection of propofol, the expression levels of different miRNA in the hippocampus of rats showed different changes. It has been reported that miR-221-3p can promote peripheral nerve regeneration [Citation15]. This study was intended to observe whether miR-221-3p can reduce the neurotoxic effect of sevoflurane on rat hippocampal nerve cells, and to explore the neuroprotective mechanism of miR-221-3p, so as to provide theoretical basis for clinical research.
Materials and methods
Neuronal cell acquisition and culture
All experimental procedures were approved by the Animal Ethics Committee of Zhenhai District People’s Hospital of Ningbo. A total of 20 Wistar rats (SPF, 18-day-old, weighing 40 to 50 g, half male and half female) were obtained from the Vital River Laboratories (Beijing, China, https://www.vitalriver.com). The animals were housed in a room at 23-27 °C, 12-hour day-night cycle, and allowed to drink and eat freely. The rats were treated with intraperitoneal injection of sodium pentobarbital (50 mg/kg), and routinely sterilized after anesthesia, and then sacrificed by cervical dislocation. Ophthalmic scissors were used to cut the skin and skull to expose the cerebral hemispheres on both sides. The hippocampal tissues of the rats were removed, and the blood vessels and meninges on the surface were removed. The hippocampal tissues were cut into small pieces and digested in 0.15% trypsin. After 30 min of incubation at 37 °C, the digestive juices were filtered and centrifuged, and obtained single cell suspension. The cells were cultured in DMEM medium (Invitrogen, USA) with 10% fetal bovine serum (FBS, Invitrogen, USA) at 37 °C, 5% CO2 incubator.
Immunofluorescence staining
Cells were fixed with 4% paraformaldehyde for 30 min, then, incubated with 0.5% Tritonx-100 for 30 min, and blocked with 10% goat serum (Invitrogen, USA). After 1 h, cells were incubated with anti-NSE antibody (1:1000, ab79757, Abcam) at 4 °C overnight. Cells were incubated with goat anti-rabbit IgG H&L (1:2000, ab205718, Abcam) for 2 h. The cells were stained with DAPI (Vector Laboratories, USA) for 30 min and imaged under an inverted fluorescence microscopy (IX70, Olympus, Japan). The NSE positive cells were green, and the nuclei of all cells were blue (DAPI labeled).
Sevoflurane model establishment
Four groups were designed in this study: control group (cell cultured in 5% O2 and 95% CO2); Sev1 group (cell cultured in 5% O2, 94% CO2 and 1% sevoflurane); Sev2 group (cell cultured in 5% O2, 93% CO2 and 2% sevoflurane); Sev3 group (cell cultured in 5% O2, 92% CO2 and 3% sevoflurane). The cells were placed in an airtight modular incubator chamber with inflow and outflow connectors (Billups-Rothenberg, Del Mar, CA). The sevoflurane (Sigma, USA) was mixed with O2 and CO2 at a speed of 10 L/min by using the calibrated sevoflurane vaporizer (Datex-Ohmeda, USA), and then delivered into cells through inlet port. The Datex-Ohmeda 5250 RGM gas analyzer was used to measure the concentrations of gas. Cells were treated with sevoflurane for 12 h.
Transfection
The cells were pretreated with 3% sevoflurane or not, and the Lipofectamine 2000 Transfection Reagent (Invitrogen, USA) was used for transfection. In the presence or absence of sevoflurane, miR-221-3p mimic control, miR-221-3p mimic, miR-221-3p inhibitor control, miR-221-3p inhibitor, CDKN1B plasmid, siRNA targeting CDKN1B, and scramble negative controls were used for cell transfection. The cells were divided into mimic control group, mimic control + Sev3 group, mimic group, mimic + Sev3 group, inhibitor control group, inhibitor control + Sev3 group, inhibitor group, inhibitor + Sev3 group, CDKN1B group, siCDKN1B group and NC group. At the same time, cells were co-transfected with miR-221-3p mimic and CDKN1B plasmid (mimic + CDKN1B group), as well as miR-221-3p inhibitor and siCDKN1B (inhibitor + siCDKN1B group). All transfection molecules were purchased from RiboBio (Guangzhou, China) and GenePharma (Shanghai, China). The miRNA mimic, miRNA inhibitor, plasmids or controls were mixed with OPTIM-MEM, and then the Lipofectamine 2000 and Opti-MEM medium were added and static for 20 min. The mixture solution was added to the cells and incubated at 37 °C, 5% CO2 for 48 h. The control group was set up. The primer sequences for transfection were listed in . 24 h and 48 h after transfection, cell viability and apoptosis were measured, respectively.
Table 1. Primer sequences for transfection.
Cell viability
The cells were placed in 96-well plate with a density of 5 × 10³ cells/well, Cell Counting Kit-8 (CCK-8, Beyotime, China) was used to detect the cell viability according to the manufacturer's instructions. CCK-8 solution was added into plate, and incubated at 37 °C, 5% CO2 for 8 h, 16 h and 24 h. The optical density (OD) was recorded by microplate reader (Model 680, Bio-Rad, USA) at the 450 nm.
Apoptosis
Apoptosis was analyzed by Annexin V-FITC/PI apoptosis detection kit (Biosea, Beijing, China) according to the manufacturer's instructions. The cells were re-suspended in binding buffer containing Annexin V-FITC and propidium iodide (PI, Sigma, USA), with a concentration of 1 × 10⁶ cell/ml and stay in the dark 30 min. The apoptotic cells were analyzed under a flow cytometer (BD FACSCalibur, BD Biosciences, USA).
Target gene prediction and luciferase reporter assay
TargetScan (http://www.targetscan.org/) was used to find the potential target gene of miR-221-3p, and the binding sites of miR-221-3p and target genes were validated. The wild-type and mutant 3′-UTRs sequences of CDKN1B containing the presumed miR-221-3p binding sequence were synthesized from GenePharma (Shanghai, China), and then cloned into firefly luciferase reporter vector pGL3 (Promega, USA). The cells were transfected with a mixture of miR-221-3p mimic and plasmids CDKN1B-wt or CDKN1B-mut by using Lipofectamine 2000 transfection system (Invitrogen, USA). Ultimately, 48 h after transfection, the dual-luciferase reporter assay system (Promega, UAS) was used to measure luciferase activities of firefly and Renilla.
Quantitative real-time polymerase chain reaction (qRT-PCR)
The TRIzol reagent (Invitrogen, USA) was used to extract the total RNA, and the purity and concentration of RNA was quantified by using Nano Drop 2000 spectrophotometer (Thermo Fisher Scientific, USA). The total RNA (2 µg) was converted to cDNA with PrimeScript RT Master Mix kit (Takara, China). qRT-PCR was performed with ABI PRISM 7500 real-time PCR Detection System (Life technology, USA) and SYBR Premix Ex Taq (Takara, China). PCR reaction conditions: pretreatment at 94 °C for 5 min; (94 °C for 30 s, 58 °C for 30 s, 72 °C for 2 min) × 35 cycles, finally extended at 72 °C for 5 min. U6 and GAPDH were used as the endogenous control. The level of relative expression was performed by using 2-ΔΔCT [Citation16]. The sequences for qRT-PCR were listed in .
Table 2. The sequences for qRT-PCR.
Western blotting (WB)
Protein extracts from neuronal cells were prepared by using RIPA lysis buffer (Beyotime, China). The BCA Protein Assay Kit (Pierce, USA) was used to quantify the protein concentrations. Equal amounts of protein (20 μg) was subjected to 10% SDS-PAGE, and transferred into PVDF (Bio-Rad, USA) membranes. The membranes were blocked in 5% non-fat milk for 1 h, then incubated overnight at 4 °C with anti-Bcl-2 antibody (rabbit, 1:1000, ab59348, Acbam), anti-Bax antibody (rabbit, 1:1000, ab32503, Acbam), anti-Cleaved Caspase-3 antibody (rabbit, 1:1000, ab2302, Acbam), anti-p27 KIP 1 (CDKN1B) antibody (mouse, 1:2000, ab193379, Abcam) or anti-GAPDH antibody (mouse, 1:2000, ab8245, Abcam). The membranes were subsequently incubated with goat anti-rabbit IgG H&L (HRP) (goat, 1:2000, ab205718, Abcam) and goat anti-mouse IgG H&L (HRP) (mouse, 1:2000, ab205719, Abcam) for 1 h. The bands of each gene were visualized using Pierce Western Blotting ECL substrate kit (Thermo Fisher Scientific, USA) and quantified using Image Lab Software (Bio-Rad, USA). The GAPDH was used as internal standard.
Statistical analysis
All experiments were repeated three times. Statistical analyses were performed by SPSS 21.0 system (SPSS Inc., USA) and the results were expressed as the Mean ± standard deviation. Differences among groups were calculated using the student’s tests or one-way analysis (ANOVA). p < 0.05 was considered significant difference.
Results
Identification of neuronal cells
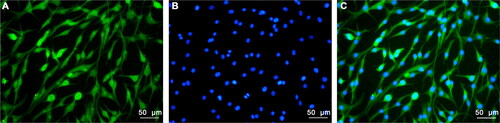
To start with, hippocampal neurons of Wistar rats were cultured in vitro, and immunofluorescence staining was used to identify whether the acquired cells were neuronal cells. After fluorescence staining with NSE, fluorescence microscopy demonstrated that most of the cells were NSE positive (Green, ). Moreover, the DAPI staining of hippocampal neuron nucleus was clear (Blue, ). The acquired neuron cells can meet the requirements of further experiments.
Figure 1. Immunofluorescence staining of hippocampal neurons. A: Green staining indicated NSE positive cells. B: Photomicrographs of DAPI staining of hippocampal neuron nucleus (Blue). C: Green staining indicated NSE positive cells and blue staining indicated nuclei. The hippocampal neuronal cells was obtained from the Wistar rats (SPF, 18-day-old, weighing 40 to 50 g, half male and half female, n = 20), all rats were sacrificed by cervical dislocation after anesthesia.
The effects of sevoflurane on cell viability and apoptosis
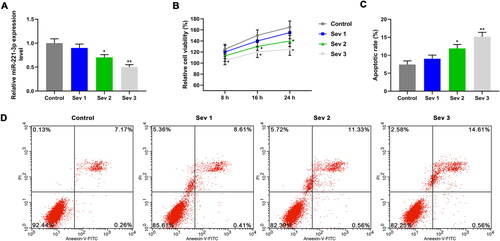
To understand the effect of sevoflurane on neuronal cells, sevoflurane models were constructed by treating cells with 1%, 2% and 3% sevoflurane, respectively. The miR-221-3p expression in cells was detected by qRT-PCR. As presented in , the miR-221-3p level was decreased in Sev2 and Sev3 groups, which was more significantly in Sev3 group (p < 0.05), suggesting that the decreased expression of miR-221-3p may be of great significance in sevoflurane-induced nerve injury. The CCK-8 and flow cytometer were performed to determine the cell viability and apoptosis. Compared with control group, we observed the down-regulation of cell viability () in Sev2 and Sev3 groups, while the up-regulation of apoptosis rate () in Sev2 and Sev3 groups (p < 0.05). Minimum cell viability and maximum apoptosis rate were observed in Sev3 group, suggesting that sevoflurane inhibited cell viability and promoted apoptosis in a concentration-dependent manner. In view of the above results, 3% sevoflurane was used for follow-up experiments.
Figure 2. The effects of sevoflurane on cell viability and apoptosis. A: The miR-221-3p level in different groups was detected by quantitative real-time polymerase chain reaction (qRT-PCR). B: Cell viability in different groups was detected by Cell Counting Kit-8 (CCK-8). C: The apoptosis was promoted by sevoflurane. D: The apoptosis rate in different groups was detected by flow cytometer. Four groups were designed in this study: control group (cell cultured in 5% O2 and 95% CO2); Sev1 group (cell cultured in 5% O2, 94% CO2 and 1% sevoflurane); Sev2 group (cell cultured in 5% O2, 93% CO2 and 2% sevoflurane); Sev3 group (cell cultured in 5% O2, 92% CO2 and 3% sevoflurane). *p < 0.05 vs. control, **p < 0.01 vs. control.
The effects of miR-221-3p mimic and miR-221-3p inhibitor on cell viability and apoptosis
To verify the protective effect of miR-221-3p on sevoflurane induced nerve injury, the cells were pretreated with 3% sevoflurane or not, and miR-221-3p mimic, miR-221-3p mimic control, miR-221-3p inhibitor, or miR-221-3p inhibitor control were used for transfection. Compared with control, mimic control and inhibitor control groups, the miR-221-3p was highly expressed in mimic group () and lowly expressed in inhibitor group (, p < 0.05). Compared with mimic control and inhibitor control groups, the miR-221-3p was lowly expressed in mimic control + Sev3 group () and inhibitor control + Sev3 group (, p < 0.05). The miR-221-3p level in mimic + Sev3 group was lower than that in mimic group and higher than that in mimic control + Sev3 group (, p < 0.05), whereas miR-221-3p level in inhibitor + Sev3 group was lower than that in inhibitor and inhibitor control + Sev3 groups (, p < 0.05). Overexpression of miR-221-3p increased the miR-221-3p level, and reversed the inhibitory effect of Sev3 on miR-221-3p expression, while the role of low-expression miR-221-3p was the opposite.
Figure 3. The effects of mimic, inhibitor alone and combined with 3% sevoflurane on cell viability and apoptosis. A: MiR-221-3p level was detected by qRT-PCR, after exposure to sevoflurane or transfection with mimic. B: MiR-221-3p level was detected by qRT-PCR, after exposure to sevoflurane or transfection with inhibitor. C: Cell viability was detected by CCK-8, after exposure to sevoflurane or transfection with mimic. D: Cell viability was detected by CCK-8, after exposure to sevoflurane or transfection with inhibitor. E: The apoptosis rate in different groups was detected by flow cytometer. F: Mimic inhibited apoptosis, and reversed the effect of 3% sevoflurane on apoptosis. G: Inhibitor promoted apoptosis, and enhanced the effect of 3% sevoflurane on apoptosis. The cells were pretreated with 3% sevoflurane or not, and miR-221-3p mimic control, miR-221-3p mimic, miR-221-3p inhibitor control, miR-221-3p inhibitor were used for cell transfection. *p < 0.05 vs. control, **p < 0.01 vs. control; #p < 0.05 vs. mimic control or inhibitor control, ##p < 0.01 vs. minmic control or inhibitor control; ^p < 0.05 vs. mimic or inhibitor, ^^p < 0.01 vs. mimic or inhibitor; △p < 0.05 vs. Mimic control + Sev3 or Inhibitor control + Sev3, △△p < 0.01 vs. Mimic control + Sev3 or Inhibitor control + Sev3.
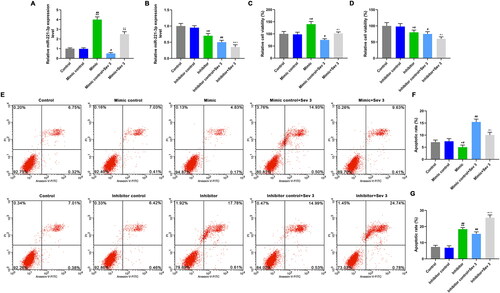
In addition, the CCK8 and flow cytometer were performed to determine the cell viability and apoptosis. Compared with control, mimic control and inhibitor control groups, miR-221-3p mimic up-regulated cell viability () and inhibited apoptosis (), while miR-221-3p inhibitor down-regulated cell viability () and promoted apoptosis (), the difference was significant (p < 0.05). In mimic control + Sev3 and inhibitor control + Sev3 groups, the cell viability () were lower than those in mimic control and inhibitor control groups, and the apoptosis rate () were higher than those in mimic control and inhibitor control groups (p < 0.05). In mimic + Sev3 group, the cell viability () was lower than that in mimic group, and higher than that in mimic control + Sev3 group (p < 0.05), while the apoptosis rate () was higher than that in mimic group and lower than that in mimic control + Sev3 group (p < 0.05). In inhibitor + Sev3 group, the cell viability () was lower than that in inhibitor and inhibitor control + Sev3 groups, while the apoptosis rate () was higher than that in inhibitor and inhibitor control + Sev3 groups (p < 0.05). The overexpression of miR-221-3p improved cell viability, inhibited apoptosis, and significantly alleviate the effect of inhibitory cell viability and pro-apoptosis caused by sevoflurane, while low-expression miR-221-3p did the opposite effect.
CDKN1B was target gene for miR-221-3p
TargetScan and luciferase reporter assay were used to predict and verify the target gene of miR-221-3p. We found that the 3′-UTR of CDKN1B had sites complementary to miR-221-3p sequence (). Then, the CDKN1B-wt or CDKN1B-mut was co-transfected with miR-221-3p mimic into cells. The luciferase activity in mimic-CDKN1B-wt group was down-regulated compared with blank-CDKN1B-wt group (, p < 0.05). And no significant difference was observed in luciferase activity between the blank-CDKN1B-mut and mimic-CDKN1B-mut groups, miR-221-3p mimic could not bind to the CDKN1B-mut (, p > 0.05).
Figure 4. The effects of mimic, inhibitor alone and combined with 3% sevoflurane on CDKN1B expression. A: TargetScan was used to verify the binding sites of miR-221-3p to target genes. B: The cells were transfected with a mixture of mimic and plasmids of CDKN1B-wt or CDKN1B-mut, and luciferase activities were measured by luciferase reporter assay. C: CDKN1B protein expression was detected by western blotting (WB), after exposure to sevoflurane or transfection with mimic. D: Mimic decreased CDKN1B protein level, reversed the promotion effect of 3% sevoflurane on CDKN1B protein expression. E: Mimic decreased CDKN1B mRNA level, reversed the promotion effect of 3% sevoflurane on CDKN1B mRNA expression. F: CDKN1B protein expression was detected by WB, after exposure to sevoflurane or transfection with inhibitor. G: Inhibitor increased CDKN1B protein expression, enhanced the promotion effect of 3% sevoflurane on CDKN1B protein expression. H: Inhibitor increased CDKN1B mRNA expression, and enhanced the promotion effect of 3% sevoflurane on CDKN1B mRNA expression. *p < 0.05 vs. control or blank, **p < 0.01 vs. control or blank; #p < 0.05 vs. minmic control or inhibitor control, ##p < 0.01 vs. minmic control or inhibitor control; ^p < 0.05 vs. mimic or inhibitor, ^^p < 0.01 vs. mimic or inhibitor; △p < 0.05 vs. Mimic control + Sev3 or Inhibitor control + Sev3, △△p < 0.01 vs. Mimic control + Sev3 or Inhibitor control + Sev3.
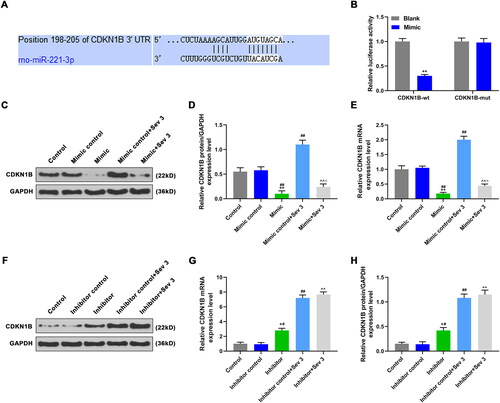
The WB and qRT-PCR were used to detect CDKN1B expression. In mimic group, the CDKN1B protein () and mRNA () levels were down-regulated as compared with control and mimic control group (p < 0.05). The CDKN1B expression in mimic control + Sev3 group was higher than that in mimic control group (, p < 0.05). In mimic + Sev3 group, the CDKN1B expression was lower than that in mimic control + Sev3 group, and higher than that in mimic group (, p < 0.05). In additional, the CDKN1B was highly expressed in inhibitor group compared with control and inhibitor control groups, the CDKN1B expression in inhibitor control + Sev 3 group was higher than that in inhibitor control group, and the CDKN1B expression in inhibitor + Sev 3 group was higher than that in inhibitor group (, p < 0.05). The results revealed that miR-221-3p mimic inhibited CDKN1B expression, and partially reversed the promotion effect of Sev3 on CDKN1B expression, whereas miR-221-3p inhibitor increased CDKN1B expression. The above experimental results indicated that CDKN1B was a direct target of miR-221-3p.
The effects of CDKN1B and siCDKN1B on cell viability and miR-221-3p
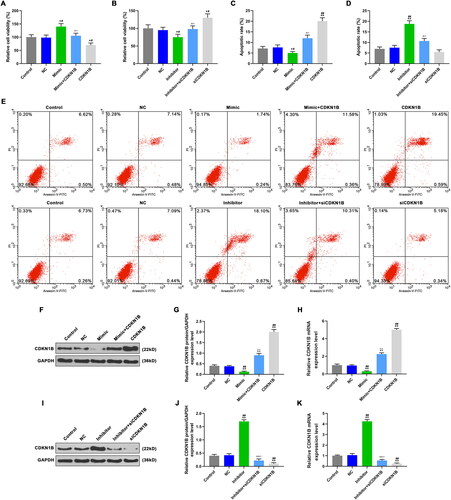
To further confirm that miR-221-3p promote neuronal cell viability and inhibit apoptosis by targeting CDKN1B, the cells were transfected with miR-221-3p mimic, miR-221-3p inhibitor, CDKN1B or siCDKN1B, and co-transfected with miR-221-3p mimic and CDKN1B, as well as miR-221-3p inhibitor and siCDKN1B. The cell viability was measured by CCK-8, and compared with control and NC groups, we observed the up-regulation of cell viability in mimic group and siCDKN1B group, whereas the down-regulation in inhibitor group and CDKN1B group was observed (, p < 0.05). In mimic + CDKN1B group, the cell viability was lower than that in mimic group and higher than that in CDKN1B group (, p < 0.05), indicated that CDKN1B overexpression partially reversed the promoting effect of miR-221-3p on neuronal cell viability. In inhibitor + siCDKN1B group, the cell viability was lower than that in siCDKN1B group and higher than that in inhibitor group (, p < 0.05), indicated that siCDKN1B partially reversed the inhibitory effect of miR-221-3p inhibitor on cell viability.
Figure 5. The effects of CDKN1B, siCDKN1B alone and combined with miR-342-5p on cell viability and apoptosis. A: Cell viability were detected by CCK-8, after transfection with mimic or/and CDKN1B. B: Cell viability were detected by CCK-8, after transfection with inhibitor or/and siCDKN1B. C: CDKN1B promoted apoptosis, reversed the effect of mimic on apoptosis. D: SiCDKN1B inhibited apoptosis, reversed the effect of inhibitor on apoptosis. E: The apoptosis rate in different groups was detected by flow cytometer. F: CDKN1B protein expression were detected by WB, after transfection with mimic or/and CDKN1B. G: CDKN1B increased CDKN1B protein expression, reversed the effect of mimic on CDKN1B protein expression. H: CDKN1B increased CDKN1B mRNA expression, reversed the effect of mimic on CDKN1B mRNA expression. I: CDKN1B protein expression were detected by WB, after transfection with inhibitor or/and siCDKN1B. J: SiCDKN1B decreased CDKN1B protein expression, reversed the effect of inhibitor on CDKN1B protein expression. K: SiCDKN1B decreased CDKN1B mRNA expression, reversed the effect of inhibitor on CDKN1B mRNA expression. CDKN1B, siCDKN1B, scramble negative controls, miR-342-5p inhibitor and miR-342-5p mimic were used for transfection, and divided into CDKN1B group, siCDKN1B group, NC group, inhibitor group, mimic group. And cells were co-transfected with miR-221-3p mimic and CDKN1B plasmid (mimic + CDKN1B group), as well as miR-221-3p inhibitor and siCDKN1B (inhibitor + siCDKN1B group). *p < 0.05 vs. control, **p < 0.01 vs. control; #p < 0.05 vs. NC, ##p < 0.01 vs. NC; ^p < 0.05 vs. mimic or inhibitor, ^^p < 0.01 vs. mimic or inhibitor; △p < 0.05 vs. CDKN1B or siCDKN1B, △△p < 0.01 vs. CDKN1B or siCDKN1B.
The effects of CDKN1B and siCDKN1B on apoptosis and miR-221-3p
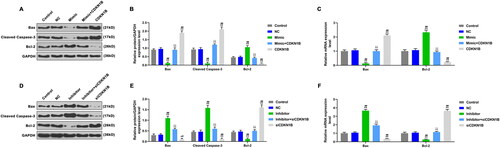
Apoptosis was detected by flow cytometry, and apoptosis-related genes expressions were detected by WB and qRT-PCR. Compared with control and NC groups, the apoptosis rate () and the levels of Bax and cleaved caspase-3 () in mimic and siCDKN1B groups were down-regulated, while the Bcl-2 level () was up-regulated (p < 0.05). However, the apoptosis rate () and the levels of Bax and cleaved caspase-3 () in inhibitor group and CDKN1B group were up-regulated, while the Bcl-2 level () was down-regulated (p < 0.05). In mimic + CDKN1B group, the apoptosis rate () and the levels of Bax and cleaved caspase-3 () were higher than those in mimic group and lower than those in CDKN1B group (p < 0.05), while the Bcl-2 level () was lower than that in mimic group and higher than that in CDKN1B group (, p < 0.05). In inhibitor + siCDKN1B group, the apoptosis rate () and the levels of Bax and cleaved caspase-3 () were lower than those in inhibitor group and higher than those in siCDKN1B group, while the Bcl-2 level () was lower than that in siCDKN1B group and higher than that in inhibitor group (p < 0.05). CDKN1B promoted apoptosis, and partially reversed the effects of miR-221-3p mimic inhibiting apoptosis. The siCDKN1B inhibited apoptosis and partially reversed the effect of miR-221-3p inhibitor promoting apoptosis.
Figure 6. The effects of CDKN1B, siCDKN1B alone and combined with miR-342-5p on the expressions of apoptotic genes. A: The expressions of apoptotic genes were detected by WB, after transfection with mimic or/and CDKN1B. B: CDKN1B partially reversed the effect of mimic on apoptotic genes expressions. C: CDKN1B partially reversed the effect of mimic on the mRNA expressions of apoptotic genes. D: The expressions of apoptotic genes were detected by WB, after transfection with inhibitor or/and siCDKN1B. E: SiCDKN1B partially reversed the effect of inhibitor on apoptotic genes. F: SiCDKN1B partially reversed the effect of inhibitor on the mRNA expressions of apoptotic genes. *p < 0.05 vs. control, **p < 0.01 vs. control; #p < 0.05 vs. NC, ##p < 0.01 vs. NC; ^p < 0.05 vs. mimic or inhibitor, ^^p < 0.01 vs. mimic or inhibitor; △p < 0.05 vs. CDKN1B or siCDKN1B, △△p < 0.01 vs. CDKN1B or siCDKN1B.
CDKN1B reversed inhibitory effects of miR-221-3p mimic on CDKN1B expression, and siCDKN1B reversed peomote effects of miR-221-3p inhibitor
WB and qRT-PCR were used to detect CDKN1B expression. Compared with control and NC groups, the CDKN1B level in mimic group and siCDKN1B group was expressed lowly, which was highly expressed in inhibitor group and CDKN1B group (, p < 0.05). In mimic + CDKN1B group, the CDKN1B expression was higher than that in mimic group and lower than that in CDKN1B group (, p < 0.05). In inhibitor + siCDKN1B group, the CDKN1B expression was lower than that in inhibitor group and higher than that in siCDKN1B group (, p < 0.05). The inhibitory effects of miR-221-3p mimic on CDKN1B expression were partially reversed by CDKN1B, and the promote effects of miR-221-3p inhibitor on CDKN1B expression were partially reversed by siCDKN1B.
Discussion
There are evidences that general anesthesia is related with the increased risk of neurodevelopmental defects [Citation17, Citation18]. Recent studies have shown that sevoflurane anesthesia can cause neurological disorders, leading to neurodegeneration of the developing brain, affecting memory and cognitive functions [Citation19, Citation20]. Therefore, we tested the hypothesis that miR-221-3p could protect nerve cells in the brain from neurocognitive impairment caused by sevoflurane. To start with, the hippocampal neurons of rats were cultured. The hippocampus is an important nerve center for learning and memory in mammalian, and is sensitive to neurotoxic drugs [Citation21, Citation22]. NSE is mainly exists in neurons and is abundant in the brain, which is also a specific marker of nerve injury [Citation23]. In this study, hippocampal neurons showed NSE positive by immunofluorescence staining, and the obtained cells were neurons, which could be used for follow-up experiments.
To observe the effects of sevoflurane on hippocampal neurons viability and apoptosis, the sevoflurane model was constructed, and cells were treated with the concentration of 1%, 2% and 3% sevoflurane, respectively. Neural development is a complex and dynamic process, and the viability of neural stem cells directly affects neural development. Drug-induced neuronal apoptosis is also a potential factor affecting neural development [Citation24, Citation25]. Anesthetic drugs can trigger abnormal apoptotic patterns, and cause neurodegenerative changes in the brain [Citation26]. It has shown that the exposure of sevoflurane may lead to the loss of hippocampal neurons and cognitive dysfunction by inducing the apoptosis of hippocampal cells mediated by endoplasmic reticulum stress [Citation27]. This study revealed the toxic effects of sevoflurane on hippocampal neurons in rats, sevoflurane inhibited the cell viability and promoted apoptosis. These results were consistent with previous studies by Xu Yang et al [Citation28]. Importantly, we observed that miR-221-3p level was decreased by sevoflurane, suggesting that the down-regulation of miR-221-3p was involved in the neuron injury induced by sevoflurane.
In view of the above research results, we constructed neurons that overexpressed or low expression of miR-221-3p in the presence or absence of 3% sevoflurane. Mir-221-3p has been reported to be associated with nerve injury, which can protect neurons by targeting LASS2 [Citation29]. In this study, we discovered that miR-221-3p mimic increased the cell viability and inhibited apoptosis, whereas miR-221-3p inhibitor showed an opposite role. In additional, miR-221-3p mimic could reverse the inhibitory effect of 3% sevoflurane on cell viability, and the promotion effect of 3% sevoflurane on apoptosis, while the role of miR-221-3p inhibitor was similar to that of 3% sevoflurane. The results showed that miR-221-3p could attenuate the nerve injury that induced by 3% sevoflurane and protect hippocampal neurons.
To explore the mechanism by which miR-221-3p protects hippocampal neurons from sevoflurane induced nerve injury, we predicted and discovered that CDKN1B was the target gene of miR-221-3p. MiRNA participates in biological processes in human organism mainly by regulating the expression of its target genes [Citation30, Citation31]. Dong-Mei Wu et al. shown that miR-142-3p can partially promote the neuronal cell cycle and inhibit cell apoptosis by inhibiting CDKN1B and TIMP3 expressions [Citation32]. In this study, the miR-221-3p mimic down-regulated CDKN1B level, while miR-221-3p inhibitor up-regulated CDKN1B level. Moreover, 3% sevoflurane up-regulated CDKN1B level, and miR-221-3p mimic partially reversed the effect of 3% sevoflurane on CDKN1B expression. CDKN1B was involved in sevoflurane induced nerve injury and was a functional target of miR-221-3p.
This study continued to explore the effects of miR-221-3p and CDKN1B on rat neuron cells, and discovered that CDKN1B inhibited cell viability and promoted apoptosis, and the siCDKN1B did the opposite effect. The Bax and Cleaved Caspase-3 levels were decreased by miR-221-3p mimic and siCDKN1B, and increased by miR-221-3p inhibitor and CDKN1B. The Bcl-2 level was increased by miR-221-3p mimic and siCDKN1B, and decreased by miR-221-3p mimic and siCDKN1B. In additional, CDKN1B partially reversed the effects of miR-221-3p mimic, and siCDKN1B partially reversed the role of miR-221-3p inhibitor on cells. The pro-apoptotic molecular protein Bax can form Bax/Bcl-2 heterodimers with the anti-apoptotic protein Bcl-2, indirectly inhibiting Bcl-2 expression and activating caspase-3, and eventually promoting apoptosis [Citation33]. Studies have shown that sevoflurane can down-regulate the Bcl-2 level, while up-regulate the levels of Bax and cleaved caspase-3, and increase apoptotic cells [Citation12, Citation34]. Therefore, it can be inferred that miR-221-3p may regulate the Bcl-2, Bax and Caspase-3 expressions by inhibiting CDKN1B expression, thereby promoting cell viability, inhibiting cell apoptosis and exerting its protective effect on the nervous system.
In conclusion, our study further confirmed the neurotoxic effects of sevoflurane. In addition, we found that miR-221-3p had a neuroprotective effect on sevoflurane induced nerve injury, which may regulate the expression of apoptosis-related genes by inhibiting the CDKN1B expression, thus promoting the activity of hippocampal neurons and reducing apoptosis. These results may provide some basic information for the future application of miR-221-3p for neurological diseases.
Disclosure statement
No potential conflict of interest was reported by the author(s).
Data availability statement
The datasets used and/or analyzed during the current study are available from the corresponding author on reasonable request.
References
- He ZY, Jiao QL, Miao Y, et al. Clinical application of combined anesthesia in cesarean section. Pakistan journal of pharmaceutical sciences. Pak J Pharm Sci. 2015;28(6 Suppl):2327–2330.
- Mahmoud M, Mason KP. Recent advances in intravenous anesthesia and anesthetics. F1000Res. 2018;7:470.
- Quick-Weller J, Konczalla J, Duetzmann S, et al. General anesthesia versus local anesthesia in stereotactic biopsies of brain lesions: a prospective randomized study. World Neurosurg. 2017;97:16–20.
- Egan TD. Total intravenous anesthesia versus inhalation anesthesia: a drug delivery perspective. J Cardiothorac Vasc Anesth. 2015;29(Suppl 1):S3–S6.
- Yi W, Zhang Y, Guo Y, et al. Elevation of Sestrin-2 expression attenuates Sevoflurane induced neurotoxicity. Metab Brain Dis. 2015;30(5):1161–1166.
- Makaryus R, Lee H, Feng T, et al. Brain maturation in neonatal rodents is impeded by sevoflurane anesthesia. Anesthesiology. 2015;123(3):557–568.
- Pellegrini L, Bennis Y, Velly L, et al. Erythropoietin protects newborn rat against sevoflurane-induced neurotoxicity. Paediatr Anaesth. 2014;24(7):749–759.
- Takaenoki Y, Satoh Y, Araki Y, et al. Neonatal exposure to sevoflurane in mice causes deficits in maternal behavior later in adulthood. Anesthesiology. 2014;120(2):403–415.
- Amrock LG, Starner ML, Murphy KL, et al. Long-term effects of single or multiple neonatal sevoflurane exposures on rat hippocampal ultrastructure. Anesthesiology. 2015;122(1):87–95.
- Zhang MQ, Ji MH, Zhao QS, et al. Neurobehavioural abnormalities induced by repeated exposure of neonatal rats to sevoflurane can be aggravated by social isolation and enrichment deprivation initiated after exposure to the anaesthetic. Br J Anaesth. 2015;115(5):752–760.
- Ganju A, Khan S, Hafeez BB, et al. miRNA nanotherapeutics for cancer. Drug Discov Today. 2017;22(2):424–432.
- Lu X, Lv S, Mi Y, et al. Neuroprotective effect of miR-665 against sevoflurane anesthesia-induced cognitive dysfunction in rats through PI3K/Akt signaling pathway by targeting insulin-like growth factor 2. Am J Transl Res. 2017;9(3):1344–1356.
- Sun WC, Pei L. rno-miR-665 targets BCL2L1 (Bcl-xl) and increases vulnerability to propofol in developing astrocytes. J Neurochem. 2016;138(2):233–242.
- Goto G, Hori Y, Ishikawa M, et al. Changes in the gene expression levels of microRNAs in the rat hippocampus by sevoflurane and propofol anesthesia. Mol Med Rep. 2014;9(5):1715–1722.
- Zhao L, Yuan Y, Li P, et al. miR-221-3p Inhibits Schwann Cell Myelination. Neuroscience. 2018;379:239–245.
- Rao X, Huang X, Zhou Z, et al. An improvement of the 2^(-delta delta CT) method for quantitative real-time polymerase chain reaction data analysis. Biostat Bioinforma Biomath. 2013;3(3):71–85.
- Shi Y, Hu D, Rodgers EL, et al. Epidemiology of general anesthesia prior to age 3 in a population-based birth cohort. Pediatr Anaesth. 2018;28(6):513–519.
- Warner OD, Zaccariello MJ, Katusic SK, et al. Neuropsychological and behavioral outcomes after exposure of young children to procedures requiring general anesthesia: the Mayo Anesthesia Safety in Kids (MASK) study. Anesthesiology. 2018;129(1):89–105.
- Zhang X, Zhou Y, Xu M, et al. Autophagy is involved in the sevoflurane anesthesia-induced cognitive dysfunction of aged rats. PloS One. 2016;11(4):e0153505.
- O'Farrell RA, Foley AG, Buggy DJ, et al. Neurotoxicity of inhalation anesthetics in the neonatal rat brain: effects on behavior and neurodegeneration in the piriform cortex. Anesthesiol Res Pract. 2018;2018:6376090–6376090.
- Ji MH, Wang XM, Sun XR, et al. Environmental enrichment ameliorates neonatal sevoflurane exposure-induced cognitive and synaptic plasticity impairments. J Mol Neurosci. 2015;57(3):358–365.
- Qiu J, Shi P, Mao W, et al. Effect of apoptosis in neural stem cells treated with sevoflurane. BMC Anesthesiol. 2015;15:25.
- Hajdukova L, Sobek O, Prchalova D, et al. Biomarkers of brain damage: S100B and NSE concentrations in cerebrospinal fluid-A normative study. Biomed Res Int. 2015;2015:379071.
- Urban N, Guillemot F. Neurogenesis in the embryonic and adult brain: same regulators, different roles. Front Cell Neurosci. 2014;8:396.
- Olney JW. Focus on apoptosis to decipher how alcohol and many other drugs disrupt brain development. Front Pediatr. 2014;2:81–81.
- Creeley CE. From drug-induced developmental neuroapoptosis to pediatric anesthetic neurotoxicity-where are we now? Brain Sci. 2016;6(3):32.
- Chen G, Gong M, Yan M, et al. Sevoflurane induces endoplasmic reticulum stress mediated apoptosis in hippocampal neurons of aging rats. PloS One. 2013;8(2):e57870–e57870.
- Yang X, Yang S, Hong C, et al. Panax Notoginseng Saponins attenuates sevoflurane‐induced nerve cell injury by modulating AKT signaling pathway. Mol Med Rep. 2017;16(5):7829–7834.
- Yu B, Zhou S, Wang Y, et al. miR-221 and miR-222 promote Schwann cell proliferation and migration by targeting LASS2 after sciatic nerve injury. J Cell Sci. 2012;125(Pt 11):2675–2683.
- Duan S, Wang Y, Wang H, et al. A novel PCR-based approach to discover miRNA target genes. Int J Med Sci. 2014;11(12):1270–1274.
- Hsieh WJ, Lin F-M, Huang H-D, et al. Investigating microRNA-target interaction-supported tissues in human cancer tissues based on miRNA and target gene expression profiling. PloS One. 2014;9(4):e95697.
- Wu DM, Wen X, Han XR, et al. MiR-142-3p enhances cell viability and inhibits apoptosis by targeting CDKN1B and TIMP3 following sciatic nerve injury. Cell Physiol Biochem. 2018;46(6):2347–2357.
- Liu G, Wang T, Wang T, et al. Effects of apoptosis-related proteins caspase-3, Bax and Bcl-2 on cerebral ischemia rats. Biomedical Reports. 2013;1(6):861–867.
- Peng S, Yan HZ, Liu PR, et al. Phosphodiesterase 4 inhibitor roflumilast protects rat hippocampal neurons from sevoflurane induced injury via modulation of MEK/ERK signaling pathway. Cell Physiol Biochem. 2018;45(6):2329–2337.