
Abstract
In this paper we derive correction factors for Shewhart control charts that monitor individual observations as well as subgroup averages. In practice, the distribution parameters of the process characteristic of interest are unknown and, therefore, have to be estimated. A well-known performance measure within Statistical Process Monitoring is the expectation of the average run length (ARL), defined as the unconditional ARL. A practitioner may want to design a control chart such that, in the in-control situation, it has a certain expected ARL. However, accurate correction factors that lead to such an unconditional ARL are not yet available. We derive correction factors that guarantee a certain unconditional in-control ARL. We use approximations to derive the factors and show their accuracy and the performance of the control charts – based on the new factors – in out-of-control situations. We also evaluate the variation between the ARLs of the individually estimated control charts.
1. Introduction
Shewhart X and control charts are common tools to monitor process means. In practice, the true process parameters are often unknown, and need to be estimated using a Phase I reference sample. However, since different practitioners have different Phase I data, the estimates of the process parameters will vary across practitioners. Because of this the estimated control limits, and consequently the control chart performance, are actually random variables. This variation in control chart performance has been addressed by several researchers, and is of great interest in current SPC literature. An overview of this literature is given by Jensen et al. (Citation2006) and Psarakis, Vyniou, and Castagliola (Citation2014).
The performance of a control chart is generally measured in terms of the false alarm rate (FAR) or the average run length (ARL). However, for example as shown by Quesenberry (Citation1993) and Chen (Citation1997), the amount of Phase I data required for the control chart to perform properly is substantially larger than initially thought. Although increasing the amount of Phase I data generally improves the accuracy of the parameter estimates, the required amounts are not always feasible in practice. Therefore, another solution is to apply corrections to the control chart limits to take parameter estimation into account. For example, Hillier (Citation1969), Does and Schriever (Citation1992) and Schoonhoven, Riaz, and Does (Citation2009) provide corrections leading to a desired value of the FAR in expectation. Next to that, more recent works (e.g. Albers and Kallenberg Citation2004, Citation2005; Chakraborti Citation2006; Faraz, Woodall, and Heuchenne Citation2015; Saleh et al. Citation2015) also consider other performance measures such as the ARL.
Performance of control charts based on estimated parameters can be evaluated for a given set of parameter values (known as conditional performance), or in expectation (known as unconditional performance). In this paper we derive new corrections for the Shewhart X and control charts to achieve a desired unconditional ARL. Although Albers and Kallenberg (Citation2005) derived correction factors for the same objective function, they have only considered the individuals chart. Therefore, we extend their approach for the Shewhart
control chart. In addition, we derive new correction factors and compare their performance. It will be shown that our newly proposed correction factors outperform those of Albers and Kallenberg (Citation2005).
The next section discusses the considered model and notation. In Section 3, the performance of the correction factors of Albers and Kallenberg (Citation2005) is assessed. Next, in Section 4 we describe the derivation of the newly proposed correction factors, and compare their performance. In Section 5, we discuss the implications of using the proposed corrections in in-control and out-of-control situations. In Section 6, the implementation of the control chart is illustrated with a real-life example. Finally, in Section 7 we provide concluding remarks.
2. Model and approach
The Shewhart control chart for monitoring the mean with known parameters has control limits(1)
where and
are the mean and standard deviation of the process characteristic of interest, respectively, and where K is the constant used to achieve the desired probability of a false signal (
). Let
denote the jth observation in sample i (
and
) and let
be i.i.d.
random variables, where
corresponds to the in-control situation, and where the process is considered out-of-control for
. Then,
with
the inverse of the standard normal cumulative distribution function. The run length (RL), i.e. the number of samples before the control chart gives a signal, has a geometric distribution with parameter
. As a consequence, the in-control ARL is given by
.
In practice, and
are not known and therefore have to be estimated. To this end, m samples of n measurements on the process characteristic are collected when the process is considered to be in control. Let
(the jth observation in the ith subgroup) be i.i.d.
random variables (
and
). Note that the
’s correspond to Phase I, and the
’s correspond to Phase II.
For the subgroup control chart, is usually estimated by the grand sample mean
(2)
and is usually estimated by the pooled standard deviation
(3)
where is the ith sample standard deviation defined by
An unbiased estimator of is
(see e.g. Schoonhoven and Does (Citation2012) or Saleh et al. (Citation2015)), where
is defined by
For the individuals chart (),
is usually estimated by the sample average
(4)
where is the ith observation (
). When
,
is usually estimated by the average moving range
(5)
An unbiased estimator of is
, where
. Hence we use the most common estimators of
in both situations. However, it is possible to use any other desired estimator in our approach.
The performance of a control chart design based on estimated parameters can be evaluated for a given set of parameter values, known as conditional performance, or in expectation, known as unconditional performance. The conditional ARL (henceforth denoted as CARL) of a control chart design can be determined as follows. We define (
) as the event that
falls outside the control limits. Then
(6)
where and
are the control limits as defined in (Equation1
(1) ) but with
and
replaced by their unbiased estimates
and
, respectively. Given a pair of control limits, the events
are independent so that the conditional RL is geometrically distributed with parameter
. The CARL is then given by
and the unconditional ARL (henceforth denoted as EARL) by
. The unconditional probability of a signal can be determined by
.
For the Shewhart X and control charts with estimated parameters, we propose control limits of the form
(7)
with and
the respective upper and lower control chart limits based on the unbiased estimators
and
of
and
, respectively, and
the factor used to achieve a desired in-control EARL, which is denoted by
.
3. Albers and Kallenberg’s correction factors
In this section, we assess the performance of the correction factors derived by Albers and Kallenberg (Citation2005). First, we extend their work to subgroup control charts and then, based on simulations, we assess the accuracy of the proposed correction factors. The final subsection gives an overview of the accuracy of the correction factors.
3.1. Derivation of the correction factors
Albers and Kallenberg (Citation2005) derived correction factors for the individuals X chart in a multiplicative form of rather than the additive form
that we use. However, their corrections can easily be transformed into a comparable form since
. Hence, we can simply multiply their proposed corrections c by K to make a comparison. For the individuals X chart with
, their proposed correction
is equal to
(8)
where . Although Albers and Kallenberg (Citation2005) considered estimators of
based on grouped observations (such as the pooled standard deviation), they did not derive corrections for the Shewhart
chart when
. However, following their derivations (see Appendix A.1) we arrive at the following corrections
(9)
where . Note that this more general correction is equal to their proposed correction for
. The resulting correction factors are given in Table .
Table 1. Correction factors for various values of
, n and m.
3.2. Simulation procedure
The accuracy of the correction factor is assessed for several combinations of parameter values, namely
,
and
.
For each combination of parameter values, we calculate the EARL as follows. Without loss of generality, we generate numerous Phase I data-sets (at least 1,000,000 data-sets consisting of m samples of size n) from a N(0, 1) distribution in order to obtain the CARL values. For each Phase I data-set, we determine the control limits and
according to (Equation7
(7) ). Let
be the average of the ith subgroup in Phase II (
) and let
denote the event that
falls above
or below
. We define
as the probability that subgroup i generates a signal conditional on
and
, i.e.
Conditional on and
, the distribution of the RL is geometric with parameter
. Hence, the CARL is given by
(10)
When we take the expectation over all Phase I samples, we obtain the EARL
This expectation is obtained by simulation: for each Phase I data-set, is computed. The number of Phase I data-sets was at least 1,000,000 for each parameter combination. For a few combinations, additional data-sets are generated so that the maximum relative standard error of the EARL is below 5% for
, and below 1% for
for all cases.
3.3. Accuracy of correction factors
For a wide range of parameter values, the realised values of the EARL are given in Table . It can be observed that these values are still quite different from the desired values , especially for small sample sizes. This difference appears to be larger for larger values of
. For larger sample sizes, the uncorrected control limits even perform better than the corrected control limits, as the EARL of the uncorrected chart are then closer to the desired value. It is clear that the proposed correction factors by Albers and Kallenberg (Citation2005) are not sufficient: the EARL still deviates heavily from its desired value. For this reason, we derive new correction factors in the next section.
Table 2. EARL of corrected (based on ) and, between brackets, uncorrected control charts.
4. New correction factors
In this section, we derive new correction factors which give a numerical example and present the accuracy of the proposed correction factors.
4.1. Derivation of new correction factor
The idea behind the derivation of the factor is as follows. We want to derive a correction factor c such that the EARL, given by , equals a desired value, namely
. In order to do this, we derive
and solve c from the equation
.
Note that the conditional probability of signaling ( is given by
(11)
with ,
and
and
This notation is similar to that of Albers and Kallenberg (Citation2004), who derived corrections for the one-sided individuals control chart. From (Equation6(6) ), we can write for any function g of
where we use h(x, y) as general notation, which is required for the next steps in the derivation. Thus, for a specific value of we can write
where
and
. Next, we approximate the probability
by using a two-step Taylor expansion of
around
,
).
(12)
where denotes the first-order partial derivative with respect to x,
denotes the second-order partial derivative with respect to x (and likewise for y) and
denotes the cross-partial derivative with respect to x and y.
When parameters are estimated, . Note that in (Equation12
(12) ) we have
and
. To ensure that
, we want to find a correction factor c such that for
the following holds (cf. (Equation12
(12) )):
(13)
In Appendix A.2 we show that, for unbiased estimators and
, we can rewrite this formula as
(14)
The functions h(x, y), ,
and
depend on the function
that is being considered. For the ARL,
. The derivatives for this function at point (K, K) are given in Table . Note that the approach can easily be adapted for any other function
by adapting the corresponding derivatives. Commonly considered functions, apart from the ARL, are the FAR (
) and the probability that the RL is at most a specified value j (
, see e.g. Tsai et al. (Citation2005)).
Table 3. Derivatives of the function h, general at point (x, y) or specifically at point (K, K) for .
The derivations given in (Equation6(6) )–(Equation14
(14) ) are still in general form with regard to the used estimators. For
and
(cf. (Equation2
(2) ) and (Equation3
(3) )) we have (see Appendix A.3)
(15)
and(16)
Besides the application to the Shewhart control chart it can also be applied to the individuals control chart. Since a different estimator for the standard deviation is used in this case, namely
, the explicit calculation of
,
and
will be different here. In Appendix A.4, we show that in this case
(17)
and(18)
4.2. Examples of computation of the correction factors
In this section, we demonstrate how to calculate the correction factor for both the subgroup control chart and individuals control chart. In addition, we give an overview of correction factors for different values of , n and m.
First, we give an example of the calculation of a correction factor for a subgroup control chart with ,
and
. In this case,
. We need to find the correction factor c in
. For the subgroup control chart, c is given by formula (Equation14
(14) ). To calculate c, we need to find
,
,
,
and
. These are as follows.
From this, we can derive c as
Next, we give an example of the calculation of a correction factor for individuals control chart with ,
and
. Note that in this case
is estimated by
. We now have
. Again, we need to find the correction factor c in
using (Equation14
(14) ). To calculate c, we need to find
,
,
,
and
. These are as follows.
The desired value of c is now given by
In Table , we present the correction factors for ,
,
and
for various values of n and m. As can be seen from the table, a smaller n and m result in a larger correction. Similarly, the smaller the value of
, the larger the correction needed. Finally, smaller values of
and n result in a negative correction factor. The reason is that there is a larger probability of extreme limits resulting in high CARLs. These high CARLs have an impact on the EARL – calculated as the average of the CARL – so that the correction factor has to be negative. This is not the case for higher values of n and m or higher values of
.
Table 4. Correction factors c for various values of , n and m.
4.3. Accuracy of correction factors
In this section, we assess the accuracy of the correction factors. In order to do so, we simulate the performance of control charts with these correction factors. The simulation procedure is described in Section 3.2.
The in-control EARL values are presented in Table . For comparison purposes, the in-control EARLs of the uncorrected charts are presented in brackets. The EARLs of the uncorrected charts deviate from the desired value . The smaller the value of
and the smaller the values of m and n, the larger the deviation is. As we can conclude from Table , the correction factor performs relatively well: for sample sizes greater than
and
, the correction factor leads an EARL close to the desired value. As we will see in the next section, this leads to better out-of-control performance as well: when the in-control ARL is exceptionally high, the control chart is not able to detect changes in the mean very quickly.
Table 5. EARL of corrected and, between brackets, uncorrected control charts.
5. Implications of proposed corrected charts
In this section we discuss the implications of using the proposed correct control charts. First, we discuss the out-of-control performance compared to uncorrected charts. Afterwards, we evaluate the variation between CARLs in both the in-control and out-of-control situation.
5.1. Out-of-control performance of corrected charts
To evaluate the out-of-control performance of the charts with the new correction factors, we determine the EARLs for two out-of-control situations. We use the same simulation procedure as described earlier but with the adjustment that the process mean has changed, i.e. with
. Again, without loss of generality we set
and
in the simulations.
Table shows the results for and Table for
. We can conclude from the tables that the corrected control charts are more powerful in detecting shifts in the process mean than the uncorrected charts, the reason being the high in-control ARL of some uncorrected charts. The positive effect of the correction factor shows up mainly for small sample sizes: for the individuals control chart (
) and for
. In conclusion, for small sample sizes the corrected control charts lead to more stable in-control as well as out-of-control performance compared to the uncorrected control charts.
Table 6. Corrected and, between brackets, uncorrected out-of-control EARL for .
Table 7. Corrected and, between brackets, uncorrected out-of-control EARL for .
5.2. Variation in CARLs
We have derived correction factors that lead to the desired value of the in-control EARL. Note that a given correction factor leads only to a desired average value: the ARL values will vary across the conditional control charts used by each individual practitioner. To illustrate this, we have drawn boxplots for the CARL values obtained in the simulations. For each simulation run, we can calculate from (Equation10
(10) ) and we can calculate the percentiles of the CARLs obtained by the simulations runs.
Figures and show the 10th, 25th, 50th, 75th and 90th percentiles of the in-control CARLs when , for
and
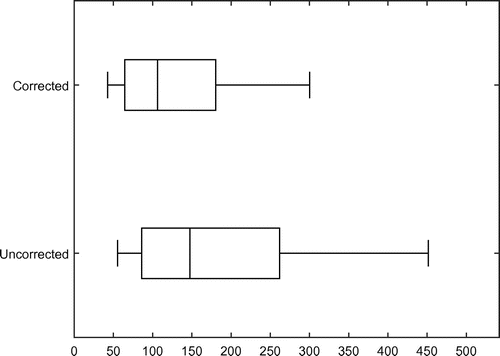
, respectively. As shown in the figures both the corrected and the uncorrected control charts display quite some variation within the CARL values. However, this variation is much less for the corrected charts than for the uncorrected charts. The same results are found in the out-of-control situation, as can be seen in Figures and . These figures show the 10th, 25th, 50th, 75th and 90th percentiles of the out-of-control (
) CARLs when
, for
and
, respectively.
Figure 1. 10th, 25th, 50th, 75th and 90th percentiles of the in-control CARLs for and
.
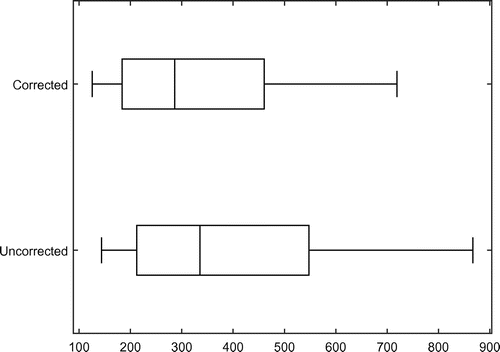
Figure 2. 10th, 25th, 50th, 75th and 90th percentiles of the in-control CARLs for and
.
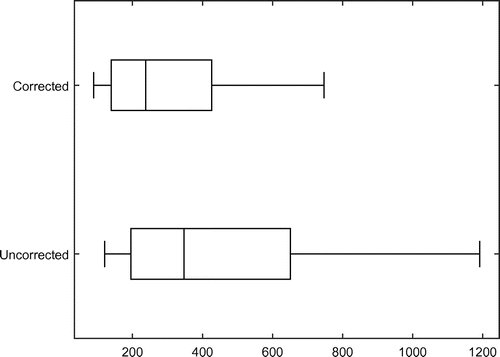
Figure 3. 10th, 25th, 50th, 75th and 90th percentiles of the out-of-control () CARLs for
and
.
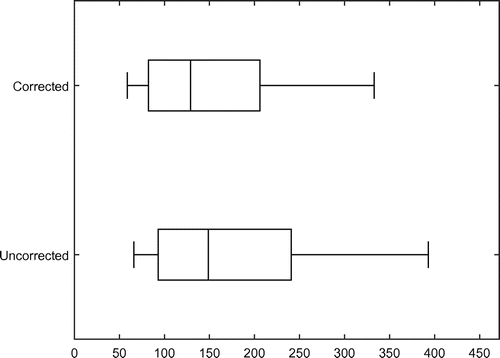
Figure 4. 10th, 25th, 50th, 75th and 90th percentiles of the out-of-control () CARLs for
and
.
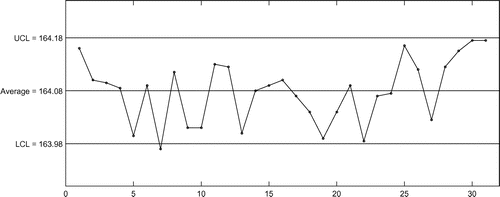
6. Application of the proposed control chart
In this section we demonstrate the application of the proposed control chart through a real-life example. Data is collected of the torque of Torque-to-Yield bolts that are used as fasteners in engines at a subsidiary of Paccar. The bolts are tightened at several different positions of the engines using a specific fastening procedure. At the end of this procedure, the torque is measured (in Newton-meter) for bolts at two specific positions. The measurements are performed by a process engineer for the purpose of process monitoring. Clearly, detecting trends or anomalies in the applied torque is very important, as this indicates problems with either the bolt(s) or the fastening procedure. For example, the performance of the used wrenches can deteriorate over time, which can result in fasteners being too tight or too loose. It is thus of major importance to detect such out-of-control situations.
Table 8. Phase I (’s) and Phase II (
’s) data of torque values.
An initial Phase I data-set of 40 observations, consisting of subgroups of size
, is collected by the process engineer to construct the control limits (see Table ). First, we have checked our data for normality. We found no reason to reject the normality assumption, because the p-value is larger than 0.1 (using the Shapiro-Wilk test for normality). Afterwards, the control limits are constructed and used to monitor the process mean. The Phase II data-set consists of 31 subgroups of size 2 (see also Table . The control limits are obtained using the following steps:
| (1) | First, we determine our parameters. We have | ||||
| (2) | Next, we calculate the required correction c. This requires the calculations of | ||||
| (3) | Finally, we calculate the control limits using | ||||
Figure 5. Control chart of the monitoring of torque values with the proposed control limits. The monitored Phase II sample consists of subgroups of size
each.
7. Concluding remarks
The ARL is a well-known metric to evaluate control chart performance. However, when the parameters of the process characteristic are estimated from a limited amount of data, the expected value of the in-control ARL differs substantially from the desired value.
In this paper, we have derived correction factors for the Shewhart X and control charts that can be used to obtain the desired value of the in-control ARL in expectation. As is shown, the correction factor is accurate: it leads to the desired value of the in-control ARL for a broad range of parameter values (
, n and m). Thus, using such a factor leads to a control chart with the desired in-control EARL. Moreover, the correction factor overcomes the problem of potentially having high CARLs in the out-of-control situation. The added value of the correction factor shows up predominantly when sample sizes are small, namely the individuals chart (
) and the subgroup control chart when
or 5 and
.
Acknowledgements
The authors are very grateful to the editor, associate editor and anonymous referees. Their constructive comments have contributed to substantial improvements of this paper. Furthermore, the authors thank Marco Huisman for his valuable contribution in the case reported in this paper.
Notes
No potential conflict of interest was reported by the authors.
References
- Albers, W., and W. C. M. Kallenberg. 2004. “Estimation in Shewhart Control Charts: Effects and Corrections.” Metrika 59: 207–234.
- Albers, W., and W. C. M. Kallenberg. 2005. “New Corrections for Old Control Charts.” Quality Engineering 17: 467–473.
- Chakraborti, S. 2006. “Parameter Estimation and Design Considerations in Prospective Applications of the X Chart.” Journal of Applied Statistics 33 (4): 439–459.
- Chen, G. 1997. “The Mean and Standard Deviation of the Run Length Distribution of X Charts when Control Limits are Estimated.” Statistica Sinica 7 (3): 789–798.
- Cryer, J. D., and T. P. Ryan. 1990. “The Estimation of Sigma for an X Chart: MR/d2 or S/c4 ?” Journal of Quality Technology 22: 187–192.
- Does, R. J. M. M., and B. F. Schriever. 1992. “Variables Control Chart Limits and Tests for Special Causes.” Statistica Neerlandica 46: 229–245.
- Faraz, A., W. H. Woodall, and C. Heuchenne. 2015. “Guaranteed Conditional Performance of the S2 Control Chart with Estimated Parameters.” International Journal of Production Research 53 (14): 4405–4413.
- Hillier, F. 1969. “X and R Chart Control Limits Based on a Small Number of Subgroups.” Journal of Quality Technology 1: 17–26.
- Jensen, W. A., L. A. Jones-Farmer, C. W. Champ, and W. H. Woodall. 2006. “Effects of Parameter Estimation on Control Chart Properties: A Literature Review.” Journal of Quality Technology 38 (4): 349–364.
- Psarakis, S., A. K. Vyniou, and P. Castagliola. 2014. “Some Recent Developments on the Effects of Parameter Estimation on Control Charts.” Quality and Reliability Engineering International 30 (8): 641–650.
- Quesenberry, C. P. 1993. “The Effect of Sample Size on Estimated Limits for X and X Control Charts.” Journal of Quality Technology 25 (4): 237–247.
- Saleh, N. A., M. A. Mahmoud, M. J. Keefe, and W. H. Woodall. 2015. “The Difficulty in Designing Shewhart X and X Control Charts with Estimated Parameters.” Journal of Quality Technology 47 (2): 127–138.
- Schoonhoven, M., and R. J. M. M. Does. 2012. “A Robust Standard Deviation Control Chart.” Technometrics 54 (1): 73–82.
- Schoonhoven, M., M. Riaz, and R. J. M. M. Does. 2009. “Design Schemes for the X.” Quality and Reliability Engineering International 25 (5): 581–594.
- Tsai, T. R., J. J. Lin, S. J. Wu, and H. C. Lin. 2005. “On Estimating Control Limits of X Chart when the Number of Subgroups is Small.” International Journal of Advanced Manufacturing Technology 26 (11–12): 1312–1316.
Appendix 1
Albers and Kallenberg correction
Although Albers and Kallenberg (Citation2005) derived corrections for the individuals X chart only, it is possible to apply their approach to the chart as well. First note that they derive correction factors
in the form
rather than
as we do. Their approach for the individuals chart states that in the one-sided case, the bias is best removed when
(A1)
Next, note that can essentially be treated as a
variable. Consequently, replacing
and
in (EquationA1
(A1) ) by
and
, respectively, leads to the required corrections for the
chart. This gives us
. In order to obtain the required correction for the two-sided case, Albers and Kallenberg instruct to add a minus sign in front of the obtained correction, and to adjust the value of K from
to
. Finally, since their correction is in the form of
, we then construct
to make our correction factors comparable. Note that for
this result corresponds with the original proposal of Albers and Kallenberg (Citation2005).
Correction factor
Here, we show how to derive (Equation14(14) ) from (Equation13
(13) ). As given in (Equation13
(13) ), we want to have
Next, we apply a two-step Taylor approximation around K to the middle part and ignore relatively small factors such as ,
and
. This essentially boils down to approximating
by
and replacing
by K in the remaining parts. We then find that this equation is approximately equal to
Note that , and that for unbiased estimators
and
there holds
and
. Then, solving this equation to c leads to
Subgroup control chart
For , we have
where for and
(cf. (Equation2
(2) ) and (Equation3
(3) )) we have
and
so that
and
Individuals control chart
For the individuals control chart, the calculation of ,
and
is different. For
, we have
Cryer and Ryan (Citation1990) showed that
and thus
Hence,
and